Instability in Indian Agriculture - NCAP
Instability in Indian Agriculture - NCAP
Instability in Indian Agriculture - NCAP

Create successful ePaper yourself
Turn your PDF publications into a flip-book with our unique Google optimized e-Paper software.
<strong>Instability</strong> <strong>in</strong> <strong>Indian</strong> <strong>Agriculture</strong><br />
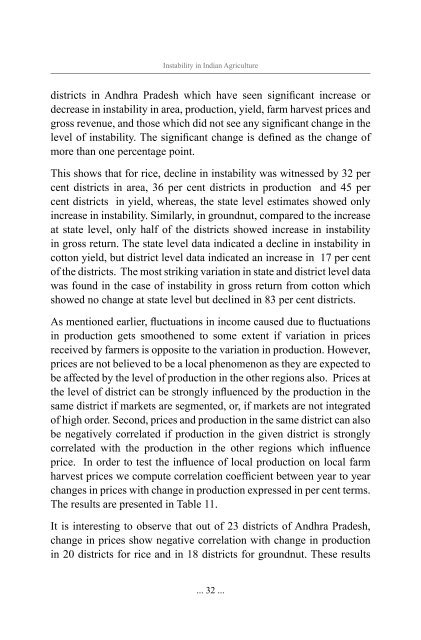
districts <strong>in</strong> Andhra Pradesh which have seen significant <strong>in</strong>crease or<br />
decrease <strong>in</strong> <strong>in</strong>stability <strong>in</strong> area, production, yield, farm harvest prices and<br />
gross revenue, and those which did not see any significant change <strong>in</strong> the<br />
level of <strong>in</strong>stability. The significant change is def<strong>in</strong>ed as the change of<br />
more than one percentage po<strong>in</strong>t.<br />
This shows that for rice, decl<strong>in</strong>e <strong>in</strong> <strong>in</strong>stability was witnessed by 32 per<br />
cent districts <strong>in</strong> area, 36 per cent districts <strong>in</strong> production and 45 per<br />
cent districts <strong>in</strong> yield, whereas, the state level estimates showed only<br />
<strong>in</strong>crease <strong>in</strong> <strong>in</strong>stability. Similarly, <strong>in</strong> groundnut, compared to the <strong>in</strong>crease<br />
at state level, only half of the districts showed <strong>in</strong>crease <strong>in</strong> <strong>in</strong>stability<br />
<strong>in</strong> gross return. The state level data <strong>in</strong>dicated a decl<strong>in</strong>e <strong>in</strong> <strong>in</strong>stability <strong>in</strong><br />
cotton yield, but district level data <strong>in</strong>dicated an <strong>in</strong>crease <strong>in</strong> 17 per cent<br />
of the districts. The most strik<strong>in</strong>g variation <strong>in</strong> state and district level data<br />
was found <strong>in</strong> the case of <strong>in</strong>stability <strong>in</strong> gross return from cotton which<br />
showed no change at state level but decl<strong>in</strong>ed <strong>in</strong> 83 per cent districts.<br />
As mentioned earlier, fluctuations <strong>in</strong> <strong>in</strong>come caused due to fluctuations<br />
<strong>in</strong> production gets smoothened to some extent if variation <strong>in</strong> prices<br />
received by farmers is opposite to the variation <strong>in</strong> production. However,<br />
prices are not believed to be a local phenomenon as they are expected to<br />
be affected by the level of production <strong>in</strong> the other regions also. Prices at<br />
the level of district can be strongly <strong>in</strong>fluenced by the production <strong>in</strong> the<br />
same district if markets are segmented, or, if markets are not <strong>in</strong>tegrated<br />
of high order. Second, prices and production <strong>in</strong> the same district can also<br />
be negatively correlated if production <strong>in</strong> the given district is strongly<br />
correlated with the production <strong>in</strong> the other regions which <strong>in</strong>fluence<br />
price. In order to test the <strong>in</strong>fluence of local production on local farm<br />
harvest prices we compute correlation coefficient between year to year<br />
changes <strong>in</strong> prices with change <strong>in</strong> production expressed <strong>in</strong> per cent terms.<br />
The results are presented <strong>in</strong> Table 11.<br />
It is <strong>in</strong>terest<strong>in</strong>g to observe that out of 23 districts of Andhra Pradesh,<br />
change <strong>in</strong> prices show negative correlation with change <strong>in</strong> production<br />
<strong>in</strong> 20 districts for rice and <strong>in</strong> 18 districts for groundnut. These results<br />
... 32 ...