Instability in Indian Agriculture - NCAP
Instability in Indian Agriculture - NCAP
Instability in Indian Agriculture - NCAP

Create successful ePaper yourself
Turn your PDF publications into a flip-book with our unique Google optimized e-Paper software.
<strong>Instability</strong> <strong>in</strong> <strong>Indian</strong> <strong>Agriculture</strong><br />
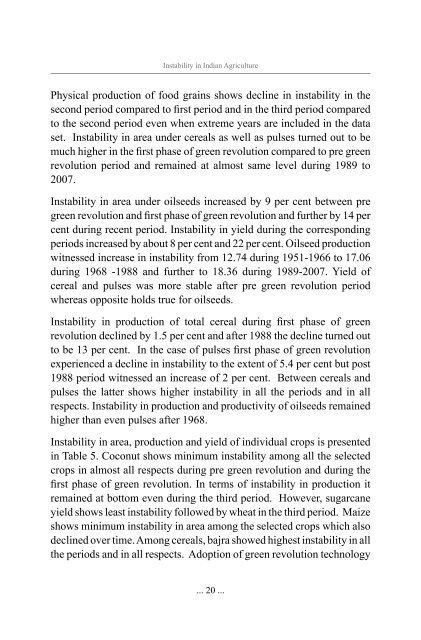
Physical production of food gra<strong>in</strong>s shows decl<strong>in</strong>e <strong>in</strong> <strong>in</strong>stability <strong>in</strong> the<br />
second period compared to first period and <strong>in</strong> the third period compared<br />
to the second period even when extreme years are <strong>in</strong>cluded <strong>in</strong> the data<br />
set. <strong>Instability</strong> <strong>in</strong> area under cereals as well as pulses turned out to be<br />
much higher <strong>in</strong> the first phase of green revolution compared to pre green<br />
revolution period and rema<strong>in</strong>ed at almost same level dur<strong>in</strong>g 1989 to<br />
2007.<br />
<strong>Instability</strong> <strong>in</strong> area under oilseeds <strong>in</strong>creased by 9 per cent between pre<br />
green revolution and first phase of green revolution and further by 14 per<br />
cent dur<strong>in</strong>g recent period. <strong>Instability</strong> <strong>in</strong> yield dur<strong>in</strong>g the correspond<strong>in</strong>g<br />
periods <strong>in</strong>creased by about 8 per cent and 22 per cent. Oilseed production<br />
witnessed <strong>in</strong>crease <strong>in</strong> <strong>in</strong>stability from 12.74 dur<strong>in</strong>g 1951-1966 to 17.06<br />
dur<strong>in</strong>g 1968 -1988 and further to 18.36 dur<strong>in</strong>g 1989-2007. Yield of<br />
cereal and pulses was more stable after pre green revolution period<br />
whereas opposite holds true for oilseeds.<br />
<strong>Instability</strong> <strong>in</strong> production of total cereal dur<strong>in</strong>g first phase of green<br />
revolution decl<strong>in</strong>ed by 1.5 per cent and after 1988 the decl<strong>in</strong>e turned out<br />
to be 13 per cent. In the case of pulses first phase of green revolution<br />
experienced a decl<strong>in</strong>e <strong>in</strong> <strong>in</strong>stability to the extent of 5.4 per cent but post<br />
1988 period witnessed an <strong>in</strong>crease of 2 per cent. Between cereals and<br />
pulses the latter shows higher <strong>in</strong>stability <strong>in</strong> all the periods and <strong>in</strong> all<br />
respects. <strong>Instability</strong> <strong>in</strong> production and productivity of oilseeds rema<strong>in</strong>ed<br />
higher than even pulses after 1968.<br />
<strong>Instability</strong> <strong>in</strong> area, production and yield of <strong>in</strong>dividual crops is presented<br />
<strong>in</strong> Table 5. Coconut shows m<strong>in</strong>imum <strong>in</strong>stability among all the selected<br />
crops <strong>in</strong> almost all respects dur<strong>in</strong>g pre green revolution and dur<strong>in</strong>g the<br />
first phase of green revolution. In terms of <strong>in</strong>stability <strong>in</strong> production it<br />
rema<strong>in</strong>ed at bottom even dur<strong>in</strong>g the third period. However, sugarcane<br />
yield shows least <strong>in</strong>stability followed by wheat <strong>in</strong> the third period. Maize<br />
shows m<strong>in</strong>imum <strong>in</strong>stability <strong>in</strong> area among the selected crops which also<br />
decl<strong>in</strong>ed over time. Among cereals, bajra showed highest <strong>in</strong>stability <strong>in</strong> all<br />
the periods and <strong>in</strong> all respects. Adoption of green revolution technology<br />
... 20 ...