Instability in Indian Agriculture - NCAP
Instability in Indian Agriculture - NCAP
Instability in Indian Agriculture - NCAP

You also want an ePaper? Increase the reach of your titles
YUMPU automatically turns print PDFs into web optimized ePapers that Google loves.
<strong>Instability</strong> <strong>in</strong> <strong>Indian</strong> <strong>Agriculture</strong><br />
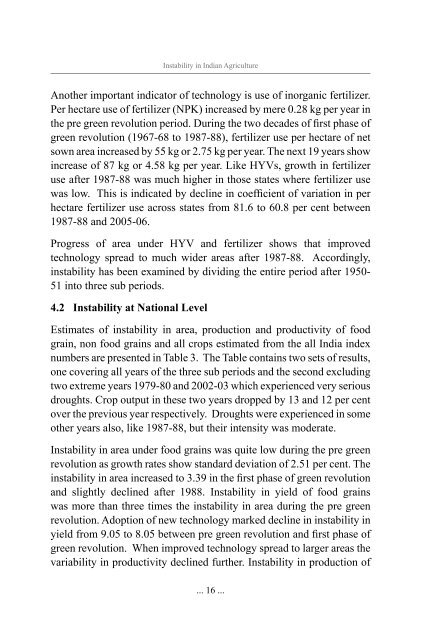
Another important <strong>in</strong>dicator of technology is use of <strong>in</strong>organic fertilizer.<br />
Per hectare use of fertilizer (NPK) <strong>in</strong>creased by mere 0.28 kg per year <strong>in</strong><br />
the pre green revolution period. Dur<strong>in</strong>g the two decades of first phase of<br />
green revolution (1967-68 to 1987-88), fertilizer use per hectare of net<br />
sown area <strong>in</strong>creased by 55 kg or 2.75 kg per year. The next 19 years show<br />
<strong>in</strong>crease of 87 kg or 4.58 kg per year. Like HYVs, growth <strong>in</strong> fertilizer<br />
use after 1987-88 was much higher <strong>in</strong> those states where fertilizer use<br />
was low. This is <strong>in</strong>dicated by decl<strong>in</strong>e <strong>in</strong> coefficient of variation <strong>in</strong> per<br />
hectare fertilizer use across states from 81.6 to 60.8 per cent between<br />
1987-88 and 2005-06.<br />
Progress of area under HYV and fertilizer shows that improved<br />
technology spread to much wider areas after 1987-88. Accord<strong>in</strong>gly,<br />
<strong>in</strong>stability has been exam<strong>in</strong>ed by divid<strong>in</strong>g the entire period after 1950-<br />
51 <strong>in</strong>to three sub periods.<br />
4.2 <strong>Instability</strong> at National Level<br />
Estimates of <strong>in</strong>stability <strong>in</strong> area, production and productivity of food<br />
gra<strong>in</strong>, non food gra<strong>in</strong>s and all crops estimated from the all India <strong>in</strong>dex<br />
numbers are presented <strong>in</strong> Table 3. The Table conta<strong>in</strong>s two sets of results,<br />
one cover<strong>in</strong>g all years of the three sub periods and the second exclud<strong>in</strong>g<br />
two extreme years 1979-80 and 2002-03 which experienced very serious<br />
droughts. Crop output <strong>in</strong> these two years dropped by 13 and 12 per cent<br />
over the previous year respectively. Droughts were experienced <strong>in</strong> some<br />
other years also, like 1987-88, but their <strong>in</strong>tensity was moderate.<br />
<strong>Instability</strong> <strong>in</strong> area under food gra<strong>in</strong>s was quite low dur<strong>in</strong>g the pre green<br />
revolution as growth rates show standard deviation of 2.51 per cent. The<br />
<strong>in</strong>stability <strong>in</strong> area <strong>in</strong>creased to 3.39 <strong>in</strong> the first phase of green revolution<br />
and slightly decl<strong>in</strong>ed after 1988. <strong>Instability</strong> <strong>in</strong> yield of food gra<strong>in</strong>s<br />
was more than three times the <strong>in</strong>stability <strong>in</strong> area dur<strong>in</strong>g the pre green<br />
revolution. Adoption of new technology marked decl<strong>in</strong>e <strong>in</strong> <strong>in</strong>stability <strong>in</strong><br />
yield from 9.05 to 8.05 between pre green revolution and first phase of<br />
green revolution. When improved technology spread to larger areas the<br />
variability <strong>in</strong> productivity decl<strong>in</strong>ed further. <strong>Instability</strong> <strong>in</strong> production of<br />
... 16 ...