Instability in Indian Agriculture - NCAP
Instability in Indian Agriculture - NCAP
Instability in Indian Agriculture - NCAP

Create successful ePaper yourself
Turn your PDF publications into a flip-book with our unique Google optimized e-Paper software.
Ramesh Chand and S S Raju<br />
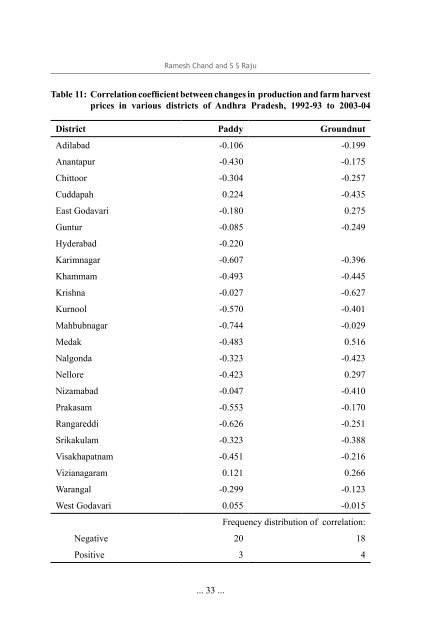
Table 11: Correlation coefficient between changes <strong>in</strong> production and farm harvest<br />
prices <strong>in</strong> various districts of Andhra Pradesh, 1992-93 to 2003-04<br />
District Paddy Groundnut<br />
Adilabad -0.106 -0.199<br />
Anantapur -0.430 -0.175<br />
Chittoor -0.304 -0.257<br />
Cuddapah 0.224 -0.435<br />
East Godavari -0.180 0.275<br />
Guntur -0.085 -0.249<br />
Hyderabad -0.220<br />
Karimnagar -0.607 -0.396<br />
Khammam -0.493 -0.445<br />
Krishna -0.027 -0.627<br />
Kurnool -0.570 -0.401<br />
Mahbubnagar -0.744 -0.029<br />
Medak -0.483 0.516<br />
Nalgonda -0.323 -0.423<br />
Nellore -0.423 0.297<br />
Nizamabad -0.047 -0.410<br />
Prakasam -0.553 -0.170<br />
Rangareddi -0.626 -0.251<br />
Srikakulam -0.323 -0.388<br />
Visakhapatnam -0.451 -0.216<br />
Vizianagaram 0.121 0.266<br />
Warangal -0.299 -0.123<br />
West Godavari 0.055 -0.015<br />
Frequency distribution of correlation:<br />
Negative 20 18<br />
Positive 3 4<br />
... 33 ...