Annual Report 2010-2011 - Colombo Stock Exchange
Annual Report 2010-2011 - Colombo Stock Exchange
Annual Report 2010-2011 - Colombo Stock Exchange
Create successful ePaper yourself
Turn your PDF publications into a flip-book with our unique Google optimized e-Paper software.
Ten Year Summary<br />
Net Turnover<br />
Rs. mn.<br />
30,000<br />
25,000<br />
20,000<br />
15,000<br />
10,000<br />
5,000<br />
0<br />
07/08<br />
08/09<br />
09/10<br />
10/11<br />
<strong>2010</strong>/<strong>2011</strong> 2009/<strong>2010</strong> 2008/2009<br />
Rs. ‘000 Rs. ‘000 Rs. ‘000<br />
TRADING RESULTS<br />
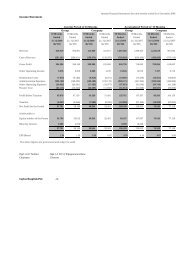
Net turnover 27,241,577 22,339,288 21,103,176<br />
Profit from operations 3,450,366 1,969,697 1,378,556<br />
Loss on disposal of investment<br />
Finance cost (794,617) (969,147) (1,436,225)<br />
Profit from operations after finance cost 2,655,749 1,000,550 (57,669)<br />
Income from associates before tax 113,008 59,609 41,015<br />
Profit/(loss) before tax from continuing operations 2,793,757 1,060,159 (16,654)<br />
Income tax expense (616,566) (330,592) (180,411)<br />
Profit/(loss) for the year from continuing operations 2,152,191 729,567 (197,065)<br />
Loss after tax from discontinued operations (11,609) (17,873) (107,963)<br />
Profit/(loss) for the year 2,140,582 711,694 (305,028)<br />
Minority interest 459,898 131,490 24,055<br />
Profit/(loss) attributable to equity holders of parent 1,680,684 580,204 (329,083)<br />
Gross dividend 515,946 - -<br />
Profit from operations<br />
Rs. mn.<br />
4,000<br />
3,500<br />
3,000<br />
2,500<br />
2,000<br />
1,500<br />
1,000<br />
500<br />
0<br />
Total Assets<br />
07/08<br />
08/09<br />
09/10<br />
10/11<br />
BALANCE SHEET<br />
Assets<br />
Property, plant and equipment 10,607,259 10,142,761 10,167,170<br />
Intangible assets 497,279 480,177 491,491<br />
Investments in associates and other investments 480,186 180,919 136,757<br />
Current assets 9,054,733 6,560,960 6,128,679<br />
20,639,457 17,364,817 16,924,097<br />
Equity and liabilities<br />
Stated Capital 1,627,612 1,578,475 1,578,475<br />
Capital and revenue reserves 3,348,003 2,183,265 1,603,061<br />
Foreign currency translation 27,314 31,152 32,371<br />
Preliminary and pre-operating expenses - - -<br />
Minority interest 1,860,693 1,503,071 1,380,908<br />
Term loans payable after one year 1,998,291 1,957,680 2,354,617<br />
Deferred income and Deferred tax 595,352 553,879 499,951<br />
Provisions and other liabilities 1,662,131 1,529,685 1,103,222<br />
Net liability to the lessor payable after one year 650,980 672,158 697,432<br />
Current liabilities 8,869,081 7,355,452 7,674,060<br />
20,639,457 17,364,817 16,924,097<br />
Rs. mn.<br />
25,000<br />
20,000<br />
15,000<br />
10,000<br />
5,000<br />
0<br />
07/08<br />
08/09<br />
09/10<br />
10/11<br />
RATIOS & OTHER INFORMATION<br />
Earnings per share (Rs) 0.87 0.30 (2.57)<br />
Market value per share (Rs) 13.60 3.67 25.00<br />
Price earnings ratio (No. of Times) 15.63 12.23 -<br />
Net assets per share (Rs) 2.58 1.97 25.06<br />
Return on equity (%) 38.22 16.56 (9.76)<br />
Dividend per share (Rs) 0.30 1 -<br />
Dividend cover (No. of Times) 2.90 4.52 -<br />
Interest cover (No. of Times) 4.34 2.03 0.96<br />
Current ratio (No. of Times) 1.02 0.89 0.80<br />
Gearing ratio (%) 38.62 49.69 59.80<br />
Richard Pieris and Company PLC | <strong>Annual</strong> <strong>Report</strong> <strong>2010</strong>/<strong>2011</strong> 104


