

Annual Report 2010-2011 - Colombo Stock Exchange
Annual Report 2010-2011 - Colombo Stock Exchange
Annual Report 2010-2011 - Colombo Stock Exchange

Create successful ePaper yourself
Turn your PDF publications into a flip-book with our unique Google optimized e-Paper software.
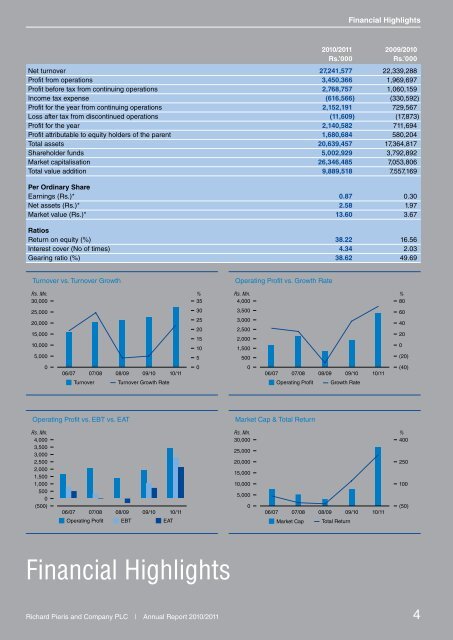
Financial Highlights<br />
<strong>2010</strong>/<strong>2011</strong> 2009/<strong>2010</strong><br />
Rs.’000<br />
Rs.’000<br />
Net turnover 27,241,577 22,339,288<br />
Profit from operations 3,450,366 1,969,697<br />
Profit before tax from continuing operations 2,768,757 1,060,159<br />
Income tax expense (616,566) (330,592)<br />
Profit for the year from continuing operations 2,152,191 729,567<br />
Loss after tax from discontinued operations (11,609) (17,873)<br />
Profit for the year 2,140,582 711,694<br />
Profit attributable to equity holders of the parent 1,680,684 580,204<br />
Total assets 20,639,457 17,364,817<br />
Shareholder funds 5,002,929 3,792,892<br />
Market capitalisation 26,346,485 7,053,806<br />
Total value addition 9,889,518 7,557,169<br />
Per Ordinary Share<br />
Earnings (Rs.)* 0.87 0.30<br />
Net assets (Rs.)* 2.58 1.97<br />
Market value (Rs.)* 13.60 3.67<br />
Ratios<br />
Return on equity (%) 38.22 16.56<br />
Interest cover (No of times) 4.34 2.03<br />
Gearing ratio (%) 38.62 49.69<br />
Turnover vs. Turnover Growth<br />
Rs. Mn. %<br />
30,000<br />
25,000<br />
20,000<br />
35<br />
30<br />
25<br />
20<br />
15,000<br />
15<br />
10,000<br />
10<br />
5,000<br />
0<br />
5<br />
0<br />
06/07 07/08 08/09 09/10 10/11<br />
Turnover Turnover Growth Rate<br />
Operating Profit vs. Growth Rate<br />
Rs. Mn. %<br />
4,000<br />
3,500<br />
3,000<br />
80<br />
60<br />
40<br />
2,500<br />
20<br />
2,000<br />
1,500<br />
500<br />
0<br />
(20)<br />
0<br />
(40)<br />
06/07 07/08 08/09 09/10 10/11<br />
Operating Profit Growth Rate<br />
Operating Profit vs. EBT vs. EAT<br />
Market Cap & Total Return<br />
Rs. Mn.<br />
4,000<br />
3,500<br />
3,000<br />
2,500<br />
2,000<br />
1,500<br />
1,000<br />
500<br />
0<br />
(500)<br />
06/07 07/08 08/09 09/10 10/11<br />
Operating Profit EBT<br />
EAT<br />
Rs. Mn. %<br />
30,000<br />
400<br />
25,000<br />
20,000<br />
250<br />
15,000<br />
10,000<br />
100<br />
5,000<br />
0<br />
(50)<br />
06/07 07/08 08/09 09/10 10/11<br />
Market Cap Total Return<br />
Financial Highlights<br />
Richard Pieris and Company PLC | <strong>Annual</strong> <strong>Report</strong> <strong>2010</strong>/<strong>2011</strong> 4


