

Annual Report 2010-2011 - Colombo Stock Exchange
Annual Report 2010-2011 - Colombo Stock Exchange
Annual Report 2010-2011 - Colombo Stock Exchange

Create successful ePaper yourself
Turn your PDF publications into a flip-book with our unique Google optimized e-Paper software.
Chairman’s Review<br />
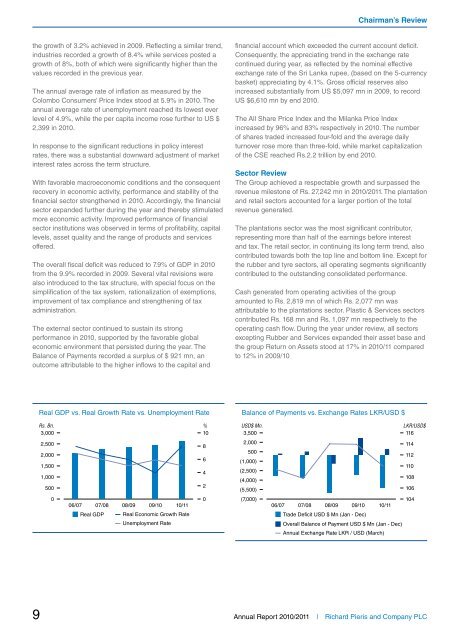
the growth of 3.2% achieved in 2009. Reflecting a similar trend,<br />
industries recorded a growth of 8.4% while services posted a<br />
growth of 8%, both of which were significantly higher than the<br />
values recorded in the previous year.<br />
The annual average rate of inflation as measured by the<br />
<strong>Colombo</strong> Consumers’ Price Index stood at 5.9% in <strong>2010</strong>. The<br />
annual average rate of unemployment reached its lowest ever<br />
level of 4.9%, while the per capita income rose further to US $<br />
2,399 in <strong>2010</strong>.<br />
In response to the significant reductions in policy interest<br />
rates, there was a substantial downward adjustment of market<br />
interest rates across the term structure.<br />
With favorable macroeconomic conditions and the consequent<br />
recovery in economic activity, performance and stability of the<br />
financial sector strengthened in <strong>2010</strong>. Accordingly, the financial<br />
sector expanded further during the year and thereby stimulated<br />
more economic activity. Improved performance of financial<br />
sector institutions was observed in terms of profitability, capital<br />
levels, asset quality and the range of products and services<br />
offered.<br />
The overall fiscal deficit was reduced to 7.9% of GDP in <strong>2010</strong><br />
from the 9.9% recorded in 2009. Several vital revisions were<br />
also introduced to the tax structure, with special focus on the<br />
simplification of the tax system, rationalization of exemptions,<br />
improvement of tax compliance and strengthening of tax<br />
administration.<br />
The external sector continued to sustain its strong<br />
performance in <strong>2010</strong>, supported by the favorable global<br />
economic environment that persisted during the year. The<br />
Balance of Payments recorded a surplus of $ 921 mn, an<br />
outcome attributable to the higher inflows to the capital and<br />
financial account which exceeded the current account deficit.<br />
Consequently, the appreciating trend in the exchange rate<br />
continued during year, as reflected by the nominal effective<br />
exchange rate of the Sri Lanka rupee, (based on the 5-currency<br />
basket) appreciating by 4.1%. Gross official reserves also<br />
increased substantially from US $5,097 mn in 2009, to record<br />
US $6,610 mn by end <strong>2010</strong>.<br />
The All Share Price Index and the Milanka Price Index<br />
increased by 96% and 83% respectively in <strong>2010</strong>. The number<br />
of shares traded increased four-fold and the average daily<br />
turnover rose more than three-fold, while market capitalization<br />
of the CSE reached Rs.2.2 trillion by end <strong>2010</strong>.<br />
Sector Review<br />
The Group achieved a respectable growth and surpassed the<br />
revenue milestone of Rs. 27,242 mn in <strong>2010</strong>/<strong>2011</strong>. The plantation<br />
and retail sectors accounted for a larger portion of the total<br />
revenue generated.<br />
The plantations sector was the most significant contributor,<br />
representing more than half of the earnings before interest<br />
and tax. The retail sector, in continuing its long term trend, also<br />
contributed towards both the top line and bottom line. Except for<br />
the rubber and tyre sectors, all operating segments significantly<br />
contributed to the outstanding consolidated performance.<br />
Cash generated from operating activities of the group<br />
amounted to Rs. 2,819 mn of which Rs. 2,077 mn was<br />
attributable to the plantations sector. Plastic & Services sectors<br />
contributed Rs. 168 mn and Rs. 1,097 mn respectively to the<br />
operating cash flow. During the year under review, all sectors<br />
excepting Rubber and Services expanded their asset base and<br />
the group Return on Assets stood at 17% in <strong>2010</strong>/11 compared<br />
to 12% in 2009/10<br />
Real GDP vs. Real Growth Rate vs. Unemployment Rate<br />
Balance of Payments vs. <strong>Exchange</strong> Rates LKR/USD $<br />
Rs. Bn. %<br />
3,000<br />
2,500<br />
10<br />
8<br />
2,000<br />
6<br />
1,500<br />
4<br />
1,000<br />
500<br />
2<br />
0<br />
0<br />
06/07 07/08 08/09 09/10 10/11<br />
Real GDP Real Economic Growth Rate<br />
Unemployment Rate<br />
USD$ Mn.<br />
3,500<br />
2,000<br />
500<br />
(1,000)<br />
(2,500)<br />
(4,000)<br />
(5,500)<br />
(7,000)<br />
LKR/USD$<br />
116<br />
114<br />
112<br />
110<br />
108<br />
106<br />
104<br />
06/07 07/08 08/09 09/10 10/11<br />
Trade Deficit USD $ Mn (Jan - Dec)<br />
Overall Balance of Payment USD $ Mn (Jan - Dec)<br />
<strong>Annual</strong> <strong>Exchange</strong> Rate LKR / USD (March)<br />
9<br />
<strong>Annual</strong> <strong>Report</strong> <strong>2010</strong>/<strong>2011</strong> | Richard Pieris and Company PLC


