

Annual Report 2010-2011 - Colombo Stock Exchange
Annual Report 2010-2011 - Colombo Stock Exchange
Annual Report 2010-2011 - Colombo Stock Exchange

You also want an ePaper? Increase the reach of your titles
YUMPU automatically turns print PDFs into web optimized ePapers that Google loves.
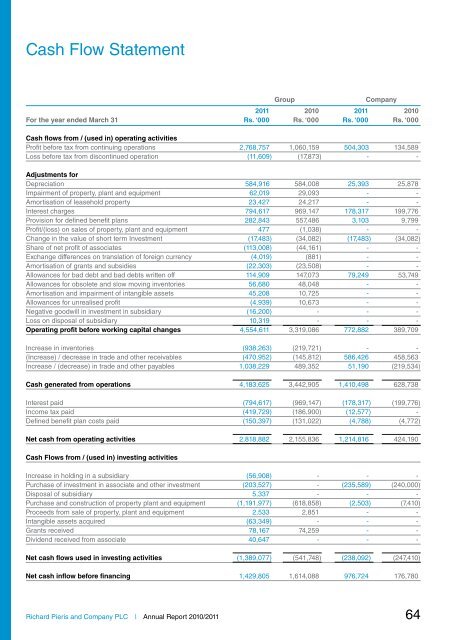
Cash Flow Statement<br />
Group<br />
Company<br />
<strong>2011</strong> <strong>2010</strong> <strong>2011</strong> <strong>2010</strong><br />
For the year ended March 31 Rs. ‘000 Rs. ‘000 Rs. ‘000 Rs. ‘000<br />
Cash flows from / (used in) operating activities<br />
Profit before tax from continuing operations 2,768,757 1,060,159 504,303 134,589<br />
Loss before tax from discontinued operation (11,609) (17,873) - -<br />
Adjustments for<br />
Depreciation 584,916 584,008 25,393 25,878<br />
Impairment of property, plant and equipment 62,019 29,093 - -<br />
Amortisation of leasehold property 23,427 24,217 - -<br />
Interest charges 794,617 969,147 178,317 199,776<br />
Provision for defined benefit plans 282,843 557,486 3,103 9,799<br />
Profit/(loss) on sales of property, plant and equipment 477 (1,038) - -<br />
Change in the value of short term Investment (17,483) (34,082) (17,483) (34,082)<br />
Share of net profit of associates (113,008) (44,161) - -<br />
<strong>Exchange</strong> differences on translation of foreign currency (4,019) (881) - -<br />
Amortisation of grants and subsidies (22,303) (23,508) - -<br />
Allowances for bad debt and bad debts written off 114,909 147,073 79,249 53,749<br />
Allowances for obsolete and slow moving inventories 56,680 48,048 - -<br />
Amortisation and impairment of intangible assets 45,208 10,725 - -<br />
Allowances for unrealised profit (4,939) 10,673 - -<br />
Negative goodwill in investment in subsidiary (16,200) - - -<br />
Loss on disposal of subsidiary 10,319 - - -<br />
Operating profit before working capital changes 4,554,611 3,319,086 772,882 389,709<br />
Increase in inventories (938,263) (219,721) - -<br />
(Increase) / decrease in trade and other receivables (470,952) (145,812) 586,426 458,563<br />
Increase / (decrease) in trade and other payables 1,038,229 489,352 51,190 (219,534)<br />
Cash generated from operations 4,183,625 3,442,905 1,410,498 628,738<br />
Interest paid (794,617) (969,147) (178,317) (199,776)<br />
Income tax paid (419,729) (186,900) (12,577) -<br />
Defined benefit plan costs paid (150,397) (131,022) (4,788) (4,772)<br />
Net cash from operating activities 2,818,882 2,155,836 1,214,816 424,190<br />
Cash Flows from / (used in) investing activities<br />
Increase in holding in a subsidiary (56,908) - - -<br />
Purchase of investment in associate and other investment (203,527) - (235,589) (240,000)<br />
Disposal of subsidiary 5,337 - - -<br />
Purchase and construction of property plant and equipment (1,191,977) (618,858) (2,503) (7,410)<br />
Proceeds from sale of property, plant and equipment 2,533 2,851 - -<br />
Intangible assets acquired (63,349) - - -<br />
Grants received 78,167 74,259 - -<br />
Dividend received from associate 40,647 - - -<br />
Net cash flows used in investing activities (1,389,077) (541,748) (238,092) (247,410)<br />
Net cash inflow before financing 1,429,805 1,614,088 976,724 176,780<br />
Richard Pieris and Company PLC | <strong>Annual</strong> <strong>Report</strong> <strong>2010</strong>/<strong>2011</strong> 64


