Chapter 10 - NCPN
Chapter 10 - NCPN
Chapter 10 - NCPN

Create successful ePaper yourself
Turn your PDF publications into a flip-book with our unique Google optimized e-Paper software.
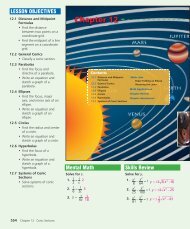
Lesson <strong>10</strong>.4 Graphing Trigonometric<br />
Functions<br />
Objectives<br />
Graph trigonometric<br />
functions.<br />
A floating object is observed to<br />
move in circles when waves oscillate<br />
harmoniously in deep water. When<br />
the object is placed in deeper water, it<br />
moves along a circular path. The size<br />
of the circular path gets smaller and<br />
smaller in diameter at different water<br />
depths. At a certain depth, the object<br />
would stand still. This is the wave’s<br />
base, which is exactly half the wave’s<br />
length. An oceanologist is studying the<br />
position of a leaf floating on the surface<br />
of a wave. The oceanologist describes<br />
the motion of the leaf by the function y = 1.5sin 2θ. The oceanologist<br />
wants to graph this function to display the motion of the leaf.<br />
The Sine Function<br />
Recall that the function, y = sin θ, takes an angle measure as its input<br />
and gives the corresponding y-coordinate where the terminal side of<br />
the angle intersects the unit circle. So the domain of the function is<br />
the set of all angle measures, θ, and the range is between –1 and 1.<br />
The graph of a sine function is called a sine curve.<br />
The amplitude of a function is half the positive difference between<br />
its maximum and minimum values. So the amplitude of the function<br />
y = sin θ is 1. The period of a function is the horizontal length of one<br />
cycle. The function y = sin θ completes one full cycle as its output<br />
values range from 0 to 1 to –1 and then back to 0. So the period of the<br />
standard sine curve is 360° or 2π radians.<br />
454 <strong>Chapter</strong> <strong>10</strong> Trigonometric Functions and Identities