Tree Configuration Thermosyphon Study - LEPTEN
Tree Configuration Thermosyphon Study - LEPTEN
Tree Configuration Thermosyphon Study - LEPTEN

You also want an ePaper? Increase the reach of your titles
YUMPU automatically turns print PDFs into web optimized ePapers that Google loves.
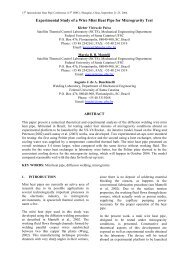
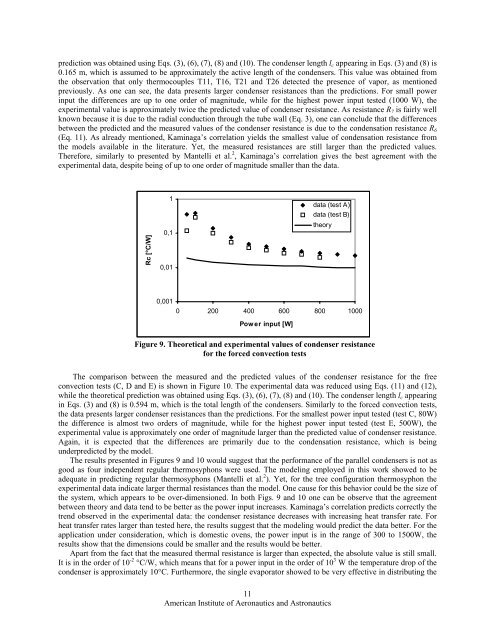
prediction was obtained using Eqs. (3), (6), (7), (8) and (10). The condenser length l c appearing in Eqs. (3) and (8) is<br />
0.165 m, which is assumed to be approximately the active length of the condensers. This value was obtained from<br />
the observation that only thermocouples T11, T16, T21 and T26 detected the presence of vapor, as mentioned<br />
previously. As one can see, the data presents larger condenser resistances than the predictions. For small power<br />
input the differences are up to one order of magnitude, while for the highest power input tested (1000 W), the<br />
experimental value is approximately twice the predicted value of condenser resistance. As resistance R 7 is fairly well<br />
known because it is due to the radial conduction through the tube wall (Eq. 3), one can conclude that the differences<br />
between the predicted and the measured values of the condenser resistance is due to the condensation resistance R 6<br />
(Eq. 11). As already mentioned, Kaminaga’s correlation yields the smallest value of condensation resistance from<br />
the models available in the literature. Yet, the measured resistances are still larger than the predicted values.<br />
Therefore, similarly to presented by Mantelli et al. 2 , Kaminaga’s correlation gives the best agreement with the<br />
experimental data, despite being of up to one order of magnitude smaller than the data.<br />
Rc [°C/W]<br />
1<br />
0,1<br />
0,01<br />
data (test A)<br />
data (test B)<br />
theory<br />
0,001<br />
0 200 400 600 800 1000<br />
Pow er input [W]<br />
Figure 9. Theoretical and experimental values of condenser resistance<br />
for the forced convection tests<br />
The comparison between the measured and the predicted values of the condenser resistance for the free<br />
convection tests (C, D and E) is shown in Figure 10. The experimental data was reduced using Eqs. (11) and (12),<br />
while the theoretical prediction was obtained using Eqs. (3), (6), (7), (8) and (10). The condenser length l c appearing<br />
in Eqs. (3) and (8) is 0.594 m, which is the total length of the condensers. Similarly to the forced convection tests,<br />
the data presents larger condenser resistances than the predictions. For the smallest power input tested (test C, 80W)<br />
the difference is almost two orders of magnitude, while for the highest power input tested (test E, 500W), the<br />
experimental value is approximately one order of magnitude larger than the predicted value of condenser resistance.<br />
Again, it is expected that the differences are primarily due to the condensation resistance, which is being<br />
underpredicted by the model.<br />
The results presented in Figures 9 and 10 would suggest that the performance of the parallel condensers is not as<br />
good as four independent regular thermosyphons were used. The modeling employed in this work showed to be<br />
adequate in predicting regular thermosyphons (Mantelli et al. 2 ). Yet, for the tree configuration thermosyphon the<br />
experimental data indicate larger thermal resistances than the model. One cause for this behavior could be the size of<br />
the system, which appears to be over-dimensioned. In both Figs. 9 and 10 one can be observe that the agreement<br />
between theory and data tend to be better as the power input increases. Kaminaga’s correlation predicts correctly the<br />
trend observed in the experimental data: the condenser resistance decreases with increasing heat transfer rate. For<br />
heat transfer rates larger than tested here, the results suggest that the modeling would predict the data better. For the<br />
application under consideration, which is domestic ovens, the power input is in the range of 300 to 1500W, the<br />
results show that the dimensions could be smaller and the results would be better.<br />
Apart from the fact that the measured thermal resistance is larger than expected, the absolute value is still small.<br />
It is in the order of 10 -2 °C/W, which means that for a power input in the order of 10 3 W the temperature drop of the<br />
condenser is approximately 10°C. Furthermore, the single evaporator showed to be very effective in distributing the<br />
11<br />
American Institute of Aeronautics and Astronautics