Tree Configuration Thermosyphon Study - LEPTEN
Tree Configuration Thermosyphon Study - LEPTEN
Tree Configuration Thermosyphon Study - LEPTEN

Create successful ePaper yourself
Turn your PDF publications into a flip-book with our unique Google optimized e-Paper software.
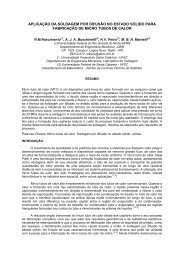
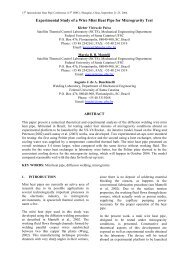
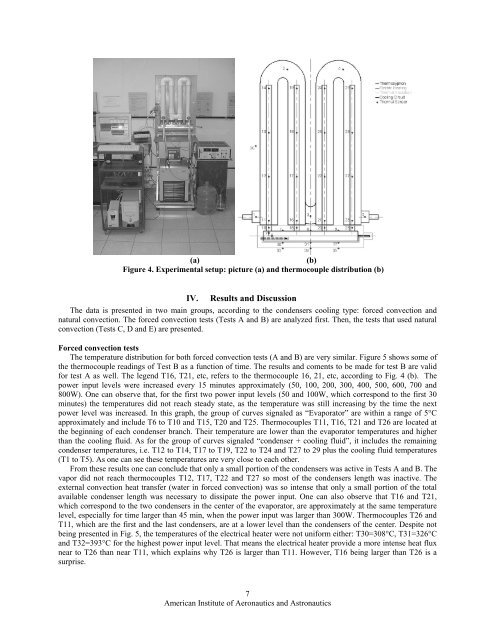
(a)<br />
(b)<br />
Figure 4. Experimental setup: picture (a) and thermocouple distribution (b)<br />
IV. Results and Discussion<br />
The data is presented in two main groups, according to the condensers cooling type: forced convection and<br />
natural convection. The forced convection tests (Tests A and B) are analyzed first. Then, the tests that used natural<br />
convection (Tests C, D and E) are presented.<br />
Forced convection tests<br />
The temperature distribution for both forced convection tests (A and B) are very similar. Figure 5 shows some of<br />
the thermocouple readings of Test B as a function of time. The results and coments to be made for test B are valid<br />
for test A as well. The legend T16, T21, etc, refers to the thermocouple 16, 21, etc, according to Fig. 4 (b). The<br />
power input levels were increased every 15 minutes approximately (50, 100, 200, 300, 400, 500, 600, 700 and<br />
800W). One can observe that, for the first two power input levels (50 and 100W, which correspond to the first 30<br />
minutes) the temperatures did not reach steady state, as the temperature was still increasing by the time the next<br />
power level was increased. In this graph, the group of curves signaled as “Evaporator” are within a range of 5°C<br />
approximately and include T6 to T10 and T15, T20 and T25. Thermocouples T11, T16, T21 and T26 are located at<br />
the beginning of each condenser branch. Their temperature are lower than the evaporator temperatures and higher<br />
than the cooling fluid. As for the group of curves signaled “condenser + cooling fluid”, it includes the remaining<br />
condenser temperatures, i.e. T12 to T14, T17 to T19, T22 to T24 and T27 to 29 plus the cooling fluid temperatures<br />
(T1 to T5). As one can see these temperatures are very close to each other.<br />
From these results one can conclude that only a small portion of the condensers was active in Tests A and B. The<br />
vapor did not reach thermocouples T12, T17, T22 and T27 so most of the condensers length was inactive. The<br />
external convection heat transfer (water in forced convection) was so intense that only a small portion of the total<br />
available condenser length was necessary to dissipate the power input. One can also observe that T16 and T21,<br />
which correspond to the two condensers in the center of the evaporator, are approximately at the same temperature<br />
level, especially for time larger than 45 min, when the power input was larger than 300W. Thermocouples T26 and<br />
T11, which are the first and the last condensers, are at a lower level than the condensers of the center. Despite not<br />
being presented in Fig. 5, the temperatures of the electrical heater were not uniform either: T30=308°C, T31=326°C<br />
and T32=393°C for the highest power input level. That means the electrical heater provide a more intense heat flux<br />
near to T26 than near T11, which explains why T26 is larger than T11. However, T16 being larger than T26 is a<br />
surprise.<br />
7<br />
American Institute of Aeronautics and Astronautics