Tree Configuration Thermosyphon Study - LEPTEN
Tree Configuration Thermosyphon Study - LEPTEN
Tree Configuration Thermosyphon Study - LEPTEN

Create successful ePaper yourself
Turn your PDF publications into a flip-book with our unique Google optimized e-Paper software.
90<br />
T6, T7, T8, T9<br />
80<br />
70<br />
T12, T17, T22, T27<br />
temperature [°C]<br />
60<br />
50<br />
40<br />
T10, T15, T20, T25<br />
T11, T16, T21, T26<br />
T13, T18, T23, T28<br />
T14, T19, T24, T29<br />
30<br />
cooling fluid (stagnant air)<br />
20<br />
0 50 100 150 200 250 300 350 400<br />
time [min]<br />
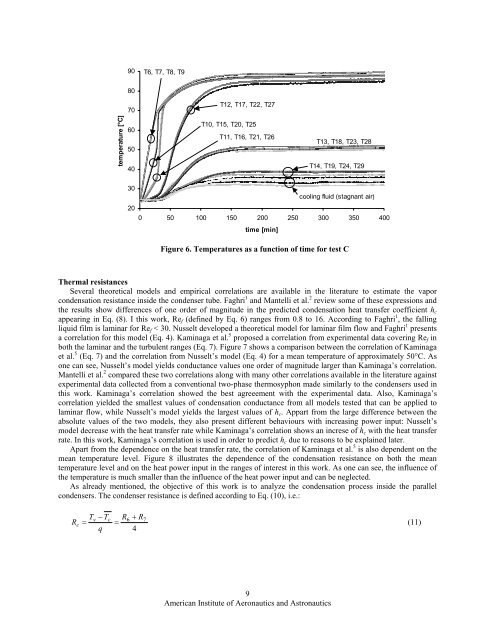
Figure 6. Temperatures as a function of time for test C<br />
Thermal resistances<br />
Several theoretical models and empirical correlations are available in the literature to estimate the vapor<br />
condensation resistance inside the condenser tube. Faghri 1 and Mantelli et al. 2 review some of these expressions and<br />
the results show differences of one order of magnitude in the predicted condensation heat transfer coefficient h c<br />
appearing in Eq. (8). I this work, Re f (defined by Eq. 6) ranges from 0.8 to 16. According to Faghri 1 , the falling<br />
liquid film is laminar for Re f < 30. Nusselt developed a theoretical model for laminar film flow and Faghri 1 presents<br />
a correlation for this model (Eq. 4). Kaminaga et al. 5 proposed a correlation from experimental data covering Re f in<br />
both the laminar and the turbulent ranges (Eq. 7). Figure 7 shows a comparison between the correlation of Kaminaga<br />
et al. 5 (Eq. 7) and the correlation from Nusselt’s model (Eq. 4) for a mean temperature of approximately 50°C. As<br />
one can see, Nusselt’s model yields conductance values one order of magnitude larger than Kaminaga’s correlation.<br />
Mantelli et al. 2 compared these two correlations along with many other correlations available in the literature against<br />
experimental data collected from a conventional two-phase thermosyphon made similarly to the condensers used in<br />
this work. Kaminaga’s correlation showed the best agreeement with the experimental data. Also, Kaminaga’s<br />
correlation yielded the smallest values of condensation conductance from all models tested that can be applied to<br />
laminar flow, while Nusselt’s model yields the largest values of h c . Appart from the large difference between the<br />
absolute values of the two models, they also present different behaviours with increasing power input: Nusselt’s<br />
model decrease with the heat transfer rate while Kaminaga’s correlation shows an increse of h c with the heat transfer<br />
rate. In this work, Kaminaga’s correlation is used in order to predict h c due to reasons to be explained later.<br />
Apart from the dependence on the heat transfer rate, the correlation of Kaminaga et al. 5 is also dependent on the<br />
mean temperature level. Figure 8 illustrates the dependence of the condensation resistance on both the mean<br />
temperature level and on the heat power input in the ranges of interest in this work. As one can see, the influence of<br />
the temperature is much smaller than the influence of the heat power input and can be neglected.<br />
As already mentioned, the objective of this work is to analyze the condensation process inside the parallel<br />
condensers. The condenser resistance is defined according to Eq. (10), i.e.:<br />
R<br />
c<br />
Tv<br />
− Tc<br />
R 6 + R<br />
= = 7<br />
(11)<br />
q 4<br />
9<br />
American Institute of Aeronautics and Astronautics