

Download - FEAS
Download - FEAS
Download - FEAS

You also want an ePaper? Increase the reach of your titles
YUMPU automatically turns print PDFs into web optimized ePapers that Google loves.
FEDERATION OF EURO-ASIAN STOCK EXCHANGES SEMI ANNUAL REPORT OCTOBER 2006<br />
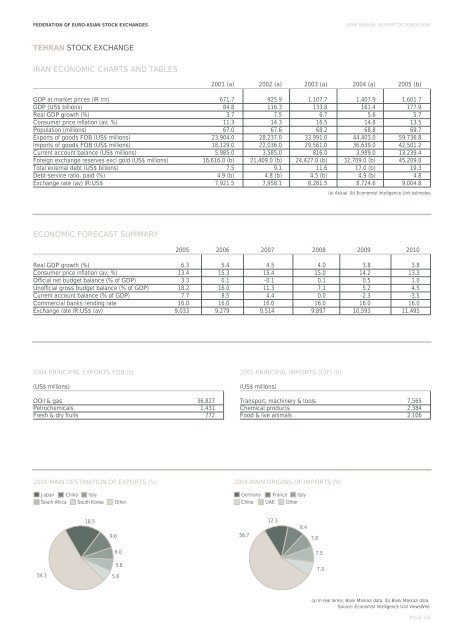
TEHRAN STOCK EXCHANGE<br />
IRAN ECONOMIC CHARTS AND TABLES<br />
2001 (a) 2002 (a) 2003 (a) 2004 (a) 2005 (b)<br />
GDP at market prices (IR trn) 671.7 925.9 1,107.7 1,407.9 1,601.7<br />
GDP (US$ billions) 84.8 116.3 133.8 161.4 177.9<br />
Real GDP growth (%) 3.7 7.5 6.7 5.6 5.7<br />
Consumer price inflation (av; %) 11.3 14.3 16.5 14.8 13.5<br />
Population (millions) 67.0 67.6 68.2 68.8 69.7<br />
Exports of goods FOB (US$ millions) 23,904.0 28,237.0 33,991.0 44,403.0 59,736.8<br />
Imports of goods FOB (US$ millions) 18,129.0 22,036.0 29,561.0 36,639.0 42,501.2<br />
Current account balance (US$ millions) 5,985.0 3,585.0 816.0 3,989.0 13,239.4<br />
Foreign exchange reserves excl gold (US$ millions) 16,616.0 (b) 21,409.0 (b) 24,427.0 (b) 32,709.0 (b) 45,209.0<br />
Total external debt (US$ billions) 7.5 9.1 11.6 17.0 (b) 19.3<br />
Debt-service ratio, paid (%) 4.9 (b) 4.8 (b) 4.5 (b) 4.9 (b) 4.8<br />
Exchange rate (av) IR:US$ 7,921.5 7,958.1 8,281.5 8,724.6 9,004.8<br />
(a) Actual. (b) Economist Intelligence Unit estimates.<br />
ECONOMIC FORECAST SUMMARY<br />
2005 2006 2007 2008 2009 2010<br />
Real GDP growth (%) 6.3 5.4 4.5 4.0 3.8 3.8<br />
Consumer price inflation (av; %) 13.4 15.3 15.4 15.0 14.2 13.3<br />
Official net budget balance (% of GDP) 3.3 0.1 -0.1 0.1 0.5 1.0<br />
Unofficial gross budget balance (% of GDP) 18.2 16.0 11.3 7.1 5.2 4.5<br />
Current account balance (% of GDP) 7.7 8.5 4.4 0.0 -2.3 -3.5<br />
Commercial banks' lending rate 16.0 16.0 16.0 16.0 16.0 16.0<br />
Exchange rate IR:US$ (av) 9,033 9,279 9,514 9,897 10,593 11,495<br />
2004-PRINCIPAL EXPORTS FOB (b)<br />
(US$ millions)<br />
OOil & gas 36,827<br />
Petrochemicals 1,431<br />
Fresh & dry fruits 772<br />
2001-PRINCIPAL IMPORTS (CIF) (b)<br />
(US$ millions)<br />
Transport, machinery & tools 7,565<br />
Chemical products 2,384<br />
Food & live animals 2,106<br />
2004-MAIN DESTINATION OF EXPORTS (%) 2004-MAIN ORIGINS OF IMPORTS (%)<br />
Japan<br />
China<br />
Italy<br />
Germany<br />
France<br />
Italy<br />
South Africa<br />
South Korea<br />
Other<br />
China<br />
UAE<br />
Other<br />
18.5<br />
12.3<br />
8.4<br />
9.6<br />
56.7<br />
7.8<br />
6.0<br />
7.5<br />
54.3<br />
5.8<br />
5.8<br />
7.3<br />
(a) In real terms; Bank Markazi data. (b) Bank Markazi data.<br />
Source: Economist Intelligence Unit ViewsWire<br />
PAGE 131


