

Download - FEAS
Download - FEAS
Download - FEAS

You also want an ePaper? Increase the reach of your titles
YUMPU automatically turns print PDFs into web optimized ePapers that Google loves.
FEDERATION OF EURO-ASIAN STOCK EXCHANGES SEMI ANNUAL REPORT OCTOBER 2006<br />
FEDERATION OF EURO-ASIAN STOCK EXCHANGES<br />
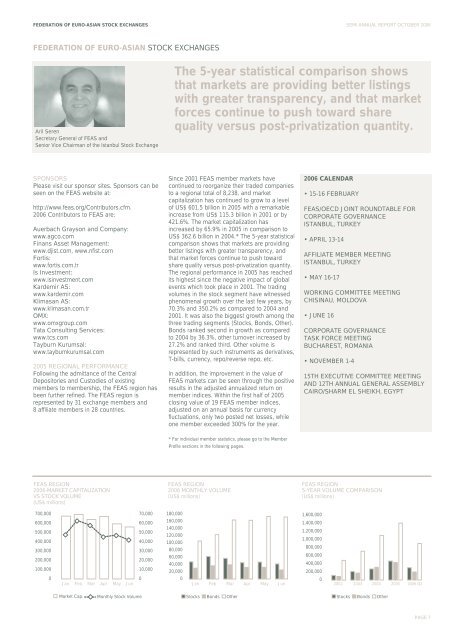
Aril Seren<br />
Secretary General of <strong>FEAS</strong> and<br />
Senior Vice Chairman of the Istanbul Stock Exchange<br />
The 5-year statistical comparison shows<br />
that markets are providing better listings<br />
with greater transparency, and that market<br />
forces continue to push toward share<br />
quality versus post-privatization quantity.<br />
SPONSORS<br />
Please visit our sponsor sites. Sponsors can be<br />
seen on the <strong>FEAS</strong> website at:<br />
http://www.feas.org/Contributors.cfm.<br />
2006 Contributors to <strong>FEAS</strong> are:<br />
Auerbach Grayson and Company:<br />
www.agco.com<br />
Finans Asset Management:<br />
www.djist.com, www.nfist.com<br />
Fortis:<br />
www.fortis.com.tr<br />
Is Investment:<br />
www.isinvestment.com<br />
Kardemir AS:<br />
www.kardemir.com<br />
Klimasan AS:<br />
www.klimasan.com.tr<br />
OMX:<br />
www.omxgroup.com<br />
Tata Consulting Services:<br />
www.tcs.com<br />
Tayburn Kurumsal:<br />
www.tayburnkurumsal.com<br />
2005 REGIONAL PERFORMANCE<br />
Following the admittance of the Central<br />
Depositories and Custodies of existing<br />
members to membership, the <strong>FEAS</strong> region has<br />
been further refined. The <strong>FEAS</strong> region is<br />
represented by 31 exchange members and<br />
8 affiliate members in 28 countries.<br />
Since 2001 <strong>FEAS</strong> member markets have<br />
continued to reorganize their traded companies<br />
to a regional total of 8,238, and market<br />
capitalization has continued to grow to a level<br />
of US$ 601.5 billion in 2005 with a remarkable<br />
increase from US$ 115.3 billion in 2001 or by<br />
421.6%. The market capitalization has<br />
increased by 65.9% in 2005 in comparison to<br />
US$ 362.6 billion in 2004.* The 5-year statistical<br />
comparison shows that markets are providing<br />
better listings with greater transparency, and<br />
that market forces continue to push toward<br />
share quality versus post-privatization quantity.<br />
The regional performance in 2005 has reached<br />
its highest since the negative impact of global<br />
events which took place in 2001. The trading<br />
volumes in the stock segment have witnessed<br />
phenomenal growth over the last few years, by<br />
70.3% and 350.2% as compared to 2004 and<br />
2001. It was also the biggest growth among the<br />
three trading segments (Stocks, Bonds, Other).<br />
Bonds ranked second in growth as compared<br />
to 2004 by 36.3%, other turnover increased by<br />
27.2% and ranked third. Other volume is<br />
represented by such instruments as derivatives,<br />
T-bills, currency, repo/reverse repo, etc.<br />
In addition, the improvement in the value of<br />
<strong>FEAS</strong> markets can be seen through the positive<br />
results in the adjusted annualized return on<br />
member indices. Within the first half of 2005<br />
closing value of 19 <strong>FEAS</strong> member indices,<br />
adjusted on an annual basis for currency<br />
fluctuations, only two posted net losses, while<br />
one member exceeded 300% for the year.<br />
2006 CALENDAR<br />
• 15-16 FEBRUARY<br />
<strong>FEAS</strong>/OECD JOINT ROUNDTABLE FOR<br />
CORPORATE GOVERNANCE<br />
ISTANBUL, TURKEY<br />
• APRIL 13-14<br />
AFFILIATE MEMBER MEETING<br />
ISTANBUL, TURKEY<br />
• MAY 16-17<br />
WORKING COMMITTEE MEETING<br />
CHISINAU, MOLDOVA<br />
• JUNE 16<br />
CORPORATE GOVERNANCE<br />
TASK FORCE MEETING<br />
BUCHAREST, ROMANIA<br />
• NOVEMBER 1-4<br />
15TH EXECUTIVE COMMITTEE MEETING<br />
AND 12TH ANNUAL GENERAL ASSEMBLY<br />
CAIRO/SHARM EL SHEIKH, EGYPT<br />
* For individual member statistics, please go to the Member<br />
Profile sections in the following pages.<br />
<strong>FEAS</strong> REGION<br />
2006-MARKET CAPITALIZATION<br />
VS STOCK VOLUME<br />
(US$ millions)<br />
<strong>FEAS</strong> REGION<br />
2006 MONTHLY VOLUME<br />
(US$ millions)<br />
<strong>FEAS</strong> REGION<br />
5-YEAR VOLUME COMPARISON<br />
(US$ millions)<br />
700,000<br />
600,000<br />
500,000<br />
400,000<br />
300,000<br />
200,000<br />
100,000<br />
0<br />
Jan Feb Mar Apr May Jun<br />
70,000<br />
60,000<br />
50,000<br />
40,000<br />
30,000<br />
20,000<br />
10,000<br />
0<br />
180,000<br />
160,000<br />
140,000<br />
120,000<br />
100,000<br />
80,000<br />
60,000<br />
40,000<br />
20,000<br />
0<br />
Jan Feb Mar Apr May Jun<br />
1,600,000<br />
1,400,000<br />
1,200,000<br />
1,000,000<br />
800,000<br />
600,000<br />
400,000<br />
200,000<br />
0<br />
2002 2003 2004 2005 2006 Q2<br />
Market Cap.<br />
Monthly Stock Volume<br />
Stocks<br />
Bonds<br />
Other<br />
Stocks<br />
Bonds<br />
Other<br />
PAGE 7


