

Download - FEAS
Download - FEAS
Download - FEAS

You also want an ePaper? Increase the reach of your titles
YUMPU automatically turns print PDFs into web optimized ePapers that Google loves.
FEDERATION OF EURO-ASIAN STOCK EXCHANGES SEMI ANNUAL REPORT OCTOBER 2006<br />
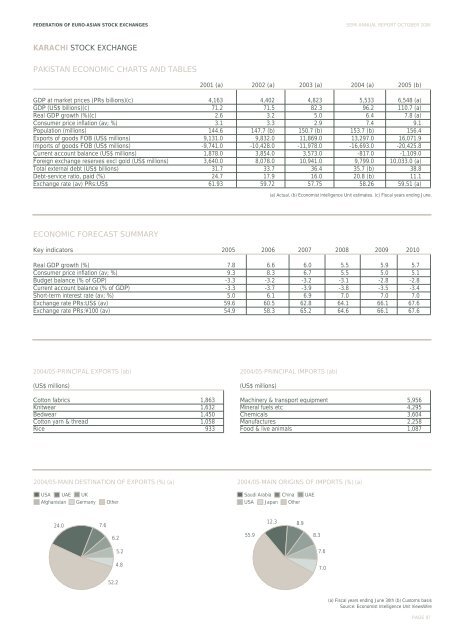
KARACHI STOCK EXCHANGE<br />
PAKISTAN ECONOMIC CHARTS AND TABLES<br />
2001 (a) 2002 (a) 2003 (a) 2004 (a) 2005 (b)<br />
GDP at market prices (PRs billions)(c) 4,163 4,402 4,823 5,533 6,548 (a)<br />
GDP (US$ billions)(c) 71.2 71.5 82.3 96.2 110.7 (a)<br />
Real GDP growth (%)(c) 2.6 3.2 5.0 6.4 7.8 (a)<br />
Consumer price inflation (av; %) 3.1 3.3 2.9 7.4 9.1<br />
Population (millions) 144.6 147.7 (b) 150.7 (b) 153.7 (b) 156.4<br />
Exports of goods FOB (US$ millions) 9,131.0 9,832.0 11,869.0 13,297.0 16,071.9<br />
Imports of goods FOB (US$ millions) -9,741.0 -10,428.0 -11,978.0 -16,693.0 -20,425.8<br />
Current account balance (US$ millions) 1,878.0 3,854.0 3,573.0 -817.0 -1,109.0<br />
Foreign exchange reserves excl gold (US$ millions) 3,640.0 8,078.0 10,941.0 9,799.0 10,033.0 (a)<br />
Total external debt (US$ billions) 31.7 33.7 36.4 35.7 (b) 38.8<br />
Debt-service ratio, paid (%) 24.7 17.9 16.0 20.8 (b) 11.1<br />
Exchange rate (av) PRs:US$ 61.93 59.72 57.75 58.26 59.51 (a)<br />
(a) Actual. (b) Economist Intelligence Unit estimates. (c) Fiscal years ending June.<br />
ECONOMIC FORECAST SUMMARY<br />
Key indicators 2005 2006 2007 2008 2009 2010<br />
Real GDP growth (%) 7.8 6.6 6.0 5.5 5.9 5.7<br />
Consumer price inflation (av; %) 9.3 8.3 6.7 5.5 5.0 5.1<br />
Budget balance (% of GDP) -3.3 -3.2 -3.2 -3.1 -2.8 -2.8<br />
Current account balance (% of GDP) -3.3 -3.7 -3.9 -3.8 -3.5 -3.4<br />
Short-term interest rate (av; %) 5.0 6.1 6.9 7.0 7.0 7.0<br />
Exchange rate PRs:US$ (av) 59.6 60.5 62.8 64.1 66.1 67.6<br />
Exchange rate PRs:¥100 (av) 54.9 58.3 65.2 64.6 66.1 67.6<br />
2004/05-PRINCIPAL EXPORTS (ab)<br />
(US$ millions)<br />
Cotton fabrics 1,863<br />
Knitwear 1,632<br />
Bedwear 1,450<br />
Cotton yarn & thread 1,058<br />
Rice 933<br />
2004/05-PRINCIPAL IMPORTS (ab)<br />
(US$ millions)<br />
Machinery & transport equipment 5,956<br />
Mineral fuels etc 4,295<br />
Chemicals 3,604<br />
Manufactures 2,258<br />
Food & live animals 1,087<br />
2004/05-MAIN DESTINATION OF EXPORTS (%) (a)<br />
2004/05-MAIN ORIGINS OF IMPORTS (%) (a)<br />
USA<br />
UAE<br />
UK<br />
Saudi Arabia<br />
China<br />
UAE<br />
Afghanistan<br />
Germany<br />
Other<br />
USA<br />
Japan<br />
Other<br />
24.0<br />
7.6<br />
12.3<br />
8.9<br />
6.2<br />
55.9<br />
8.3<br />
5.2<br />
7.6<br />
4.8<br />
7.0<br />
52.2<br />
(a) Fiscal years ending June 30th (b) Customs basis<br />
Source: Economist Intelligence Unit ViewsWire<br />
PAGE 87


