

Download - FEAS
Download - FEAS
Download - FEAS

You also want an ePaper? Increase the reach of your titles
YUMPU automatically turns print PDFs into web optimized ePapers that Google loves.
FEDERATION OF EURO-ASIAN STOCK EXCHANGES SEMI ANNUAL REPORT OCTOBER 2006<br />
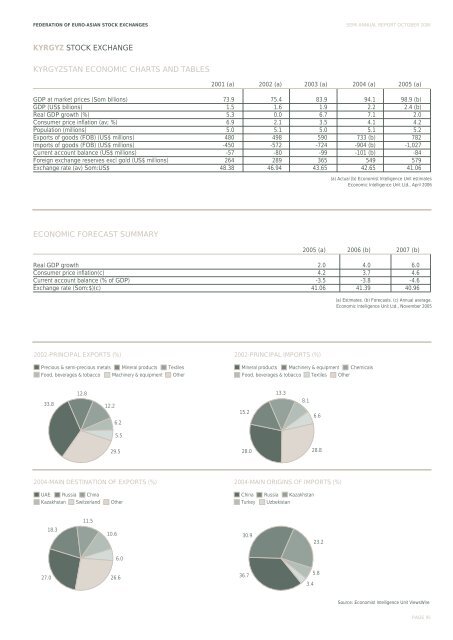
KYRGYZ STOCK EXCHANGE<br />
KYRGYZSTAN ECONOMIC CHARTS AND TABLES<br />
2001 (a) 2002 (a) 2003 (a) 2004 (a) 2005 (a)<br />
GDP at market prices (Som billions) 73.9 75.4 83.9 94.1 98.9 (b)<br />
GDP (US$ billions) 1.5 1.6 1.9 2.2 2.4 (b)<br />
Real GDP growth (%) 5.3 0.0 6.7 7.1 2.0<br />
Consumer price inflation (av; %) 6.9 2.1 3.5 4.1 4.2<br />
Population (millions) 5.0 5.1 5.0 5.1 5.2<br />
Exports of goods (FOB) (US$ millions) 480 498 590 733 (b) 782<br />
Imports of goods (FOB) (US$ millions) -450 -572 -724 -904 (b) -1,027<br />
Current account balance (US$ millions) -57 -80 -99 -101 (b) -84<br />
Foreign exchange reserves excl gold (US$ millions) 264 289 365 549 579<br />
Exchange rate (av) Som:US$ 48.38 46.94 43.65 42.65 41.06<br />
(a) Actual (b) Economist Intelligence Unit estimates<br />
Economic Intelligence Unit Ltd., April 2006<br />
ECONOMIC FORECAST SUMMARY<br />
2005 (a) 2006 (b) 2007 (b)<br />
Real GDP growth 2.0 4.0 6.0<br />
Consumer price inflation(c) 4.2 3.7 4.6<br />
Current account balance (% of GDP) -3.5 -3.8 -4.6<br />
Exchange rate (Som:$)(c) 41.06 41.39 40.96<br />
(a) Estimates. (b) Forecasts. (c) Annual average.<br />
Economic Intelligence Unit Ltd., November 2005<br />
2002-PRINCIPAL EXPORTS (%) 2002-PRINCIPAL IMPORTS (%)<br />
Precious & semi-precious metals Mineral products Textiles<br />
Food, beverages & tobacco Machinery & equipment Other<br />
Mineral products Machinery & equipment Chemicals<br />
Food, beverages & tobacco Textiles Other<br />
12.8<br />
13.3<br />
33.8<br />
12.2<br />
6.2<br />
15.2<br />
8.1<br />
6.6<br />
5.5<br />
29.5<br />
28.0<br />
28.8<br />
2004-MAIN DESTINATION OF EXPORTS (%) 2004-MAIN ORIGINS OF IMPORTS (%)<br />
UAE<br />
Russia<br />
China<br />
China<br />
Russia<br />
Kazakhstan<br />
Kazakhstan<br />
Switzerland<br />
Other<br />
Turkey<br />
Uzbekistan<br />
11.5<br />
18.3<br />
10.6<br />
30.9<br />
23.2<br />
6.0<br />
27.0<br />
26.6<br />
36.7<br />
3.4<br />
5.8<br />
Source: Economist Intelligence Unit ViewsWire<br />
PAGE 95


