

Download - FEAS
Download - FEAS
Download - FEAS

You also want an ePaper? Increase the reach of your titles
YUMPU automatically turns print PDFs into web optimized ePapers that Google loves.
FEDERATION OF EURO-ASIAN STOCK EXCHANGES SEMI ANNUAL REPORT OCTOBER 2006<br />
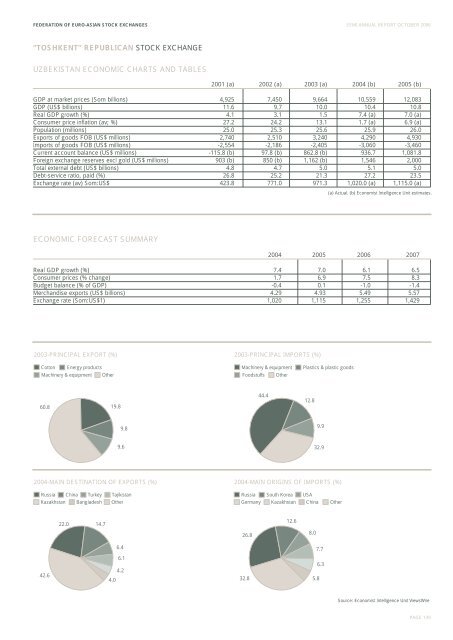
“TOSHKENT” REPUBLICAN STOCK EXCHANGE<br />
UZBEKISTAN ECONOMIC CHARTS AND TABLES<br />
2001 (a) 2002 (a) 2003 (a) 2004 (b) 2005 (b)<br />
GDP at market prices (Som billions) 4,925 7,450 9,664 10,559 12,083<br />
GDP (US$ billions) 11.6 9.7 10.0 10.4 10.8<br />
Real GDP growth (%) 4.1 3.1 1.5 7.4 (a) 7.0 (a)<br />
Consumer price inflation (av; %) 27.2 24.2 13.1 1.7 (a) 6.9 (a)<br />
Population (millions) 25.0 25.3 25.6 25.9 26.0<br />
Exports of goods FOB (US$ millions) 2,740 2,510 3,240 4,290 4,930<br />
Imports of goods FOB (US$ millions) -2,554 -2,186 -2,405 -3,060 -3,460<br />
Current account balance (US$ millions) -115.8 (b) 97.8 (b) 862.8 (b) 936.7 1,081.8<br />
Foreign exchange reserves excl gold (US$ millions) 903 (b) 850 (b) 1,162 (b) 1,546 2,000<br />
Total external debt (US$ billions) 4.8 4.7 5.0 5.1 5.0<br />
Debt-service ratio, paid (%) 26.8 25.2 21.3 27.2 23.5<br />
Exchange rate (av) Som:US$ 423.8 771.0 971.3 1,020.0 (a) 1,115.0 (a)<br />
(a) Actual. (b) Economist Intelligence Unit estimates.<br />
ECONOMIC FORECAST SUMMARY<br />
2004 2005 2006 2007<br />
Real GDP growth (%) 7.4 7.0 6.1 6.5<br />
Consumer prices (% change) 1.7 6.9 7.5 8.3<br />
Budget balance (% of GDP) -0.4 0.1 -1.0 -1.4<br />
Merchandise exports (US$ billions) 4.29 4.93 5.49 5.57<br />
Exchange rate (Som:US$1) 1,020 1,115 1,255 1,429<br />
2003-PRINCIPAL EXPORT (%) 2003-PRINCIPAL IMPORTS (%)<br />
Cotton Energy products<br />
Machinery & equipment Other<br />
Machinery & equipment<br />
Foodstuffs<br />
Other<br />
Plastics & plastic goods<br />
60.8<br />
19.8<br />
44.4<br />
12.8<br />
9.8<br />
9.9<br />
9.6<br />
32.9<br />
2004-MAIN DESTINATION OF EXPORTS (%) 2004-MAIN ORIGINS OF IMPORTS (%)<br />
Russia<br />
China Turkey Tajikistan<br />
Russia<br />
South Korea<br />
USA<br />
Kazakhstan<br />
Bangladesh<br />
Other<br />
Germany<br />
Kazakhstan<br />
China<br />
Other<br />
22.0<br />
14.7<br />
12.6<br />
26.8<br />
8.0<br />
6.4<br />
7.7<br />
42.6<br />
6.1<br />
4.2<br />
4.0<br />
32.8<br />
5.8<br />
6.3<br />
Source: Economist Intelligence Unit ViewsWire<br />
PAGE 139


