

Download - FEAS
Download - FEAS
Download - FEAS

You also want an ePaper? Increase the reach of your titles
YUMPU automatically turns print PDFs into web optimized ePapers that Google loves.
FEDERATION OF EURO-ASIAN STOCK EXCHANGES SEMI ANNUAL REPORT OCTOBER 2006<br />
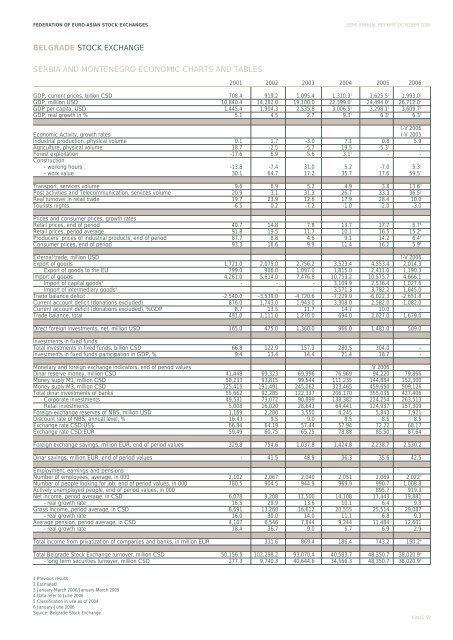
BELGRADE STOCK EXCHANGE<br />
SERBIA AND MONTENEGRO ECONOMIC CHARTS AND TABLES<br />
2001 2002 2003 2004 2005 2006<br />
GDP, current prices, billion CSD 708.4 919.2 1,095.4 1,310.3 1 1,625.5 1 1,993.0 2<br />
GDP, milliion USD 10,840.4 14,282.0 19,100.0 22,399.0 1 24,494.0 1 26,712.0 2<br />
GDP per capita, USD 1,445.4 1,904.3 2,535.8 3,006.5 1 3,298.1 1 3,609.7 2<br />
GDP, real growth in % 5.1 4.5 2.7 9.3 1 6.3 1 6.3 3<br />
I-V 2006<br />
Economic Activity, growth rates I-V 2005<br />
Industrial production, physical volume 0.1 1.7 -3.0 7.1 0.8 5.9<br />
Agriculture, physical volume 18.7 -2.5 -5.7 19.5 -5.3 1 -<br />
Forest exploitation -17.6 6.9 5.6 3.1 1 - -<br />
Construction<br />
- working hours -13.8 -7.4 31.0 5.2 -7.0 5.3 3<br />
- work value 30.1 64.7 17.2 35.7 17.6 59.5 3<br />
Transport, services volume 9.6 6.9 5.2 4.9 3.8 13.6 3<br />
Post activities and Telecommunication, services volume 20.9 3.1 31.3 26.7 33.3 36.5 3<br />
Real turnover in retail trade 19.7 23.9 12.6 17.9 28.4 10.0<br />
Tourists nights -6.5 0.2 -7.2 -1.0 -2.0 -3.0<br />
Prices and consumer prices, growth rates<br />
Retail prices, end of period 40.7 14.8 7.8 13.7 17.7 5.7 4<br />
Retail prices, period average 91.8 19.5 11.7 10.1 16.5 15.2 4<br />
Producers’ prices of industrial products, end of period 87.7 8.8 4.6 9.1 14.2 6.4 4<br />
Consumer prices, end of period 93.3 16.6 9.9 11.4 16.2 5.9 4<br />
External trade, million USD I-V 2006<br />
Export of goods 1,721.0 2,075.0 2,756.2 3,523.4 4,553.4 2,014.3<br />
Export of goods to the EU 799.0 906.0 1,097.0 1,815.0 2,411.0 1,190.3<br />
Import of goods 4,261.0 5,614.0 7,476.8 10,753.2 10,575.7 4,666.1<br />
Import of capital goods 5 - - - 3,109.9 2,536.4 1,027.6<br />
Import of intermediary goods 5 - - - 3,571.3 3,782.2 1,645.0<br />
Trade balance deficit -2,540.0 -3,539.0 -4,720.6 -7,229.9 -6,022.3 -2,651.8<br />
Current account deficit (donations excluded) 876.0 1,743.0 1,943.0 3,308.0 2,582.0 -1,082.0<br />
Current account deficit (donations excluded), %GDP 8.7 13.5 11.7 14.7 10.0 -<br />
Trade balance, total 491.0 1,111.0 1,270.0 694.0 2,027.0 1,679.0<br />
Direct foreign investments, net, million USD 165.0 475.0 1,360.0 966.0 1,481.0 509.0<br />
Investments in fixed funds<br />
Total investments in fixed funds, billion CSD 66.8 122.9 157.3 280.5 304.0 -<br />
Investments in fixed funds participation in GDP, % 9.4 13.4 14.4 21.4 18.7 -<br />
Monetary and foreign exchange indicators, end of period values V 2006<br />
Dinar reserve money, million CSD 41,448 69,323 69,996 76,969 94,220 79,866<br />
Money suply M1, million CSD 58,233 93,815 99,544 111,235 144,884 152,300<br />
Money suply M3, million CSD 125,415 191,491 245,062 323,465 459,650 509,126<br />
Total dinar investments of banks 55,662 92,285 122,337 206,170 355,035 427,406<br />
Corporate investments 49,531 73,072 90,899 138,382 224,254 263,513<br />
Retail investments 5,008 16,020 28,643 64,441 124,937 157,309<br />
Foreign-exchange reserves of NBS, million USD 1,169 2,280 3,550 4,245 5,843 7,921<br />
Discount rate of NBS, annual level, % 16.43 9.5 9.0 8.5 8.5 8.5<br />
Exchange rate CSD:US$ 66.84 64.19 57.44 57.94 72.22 68.17<br />
Exchange rate CSD:EUR 59.49 60.75 65.25 78.88 85.50 87.64<br />
Foreign exchange savings, million EUR, end of period values 329.8 754.6 1,037.8 1,424.8 2,238.7 2,530.2<br />
Dinar savings, million EUR, end of period values - 41.5 48.9 36.3 35.6 42.5<br />
Employment, earnings and pensions<br />
Number of employees, average, in 000 2,102 2,067 2,040 2,051 2,069 2,022 1<br />
Number of people looking for job, end of period values, in 000 780.5 904.5 944.9 969.9 990.7 1,008.8<br />
Actively unemployed people, end of period values, in 000 895.7 919.3<br />
Net income, period average, in CSD 6,078 9,208 11,500 14,108 17,443 19,881<br />
- real growth rate 16.5 29.9 13.6 10.1 6.4 9.3<br />
Gross income, period average, in CSD 8,691 13,260 16,612 20,555 25,514 29,087<br />
- real growth rate 16.0 30.0 14.0 11.1 6.8 9.3<br />
Average pension, period average, in CSD 4,107 6,546 7,844 9,244 11,484 12,601<br />
- real growth rate 18.4 36.7 9.0 5.7 6.9 2.9<br />
Total income from privatization of companies and banks, in million EUR 331.6 869.4 186.4 743.2 150.2 6<br />
Total Belgrade Stock Exchange turnover, million CSD 50,156.5 102,298.2 93,070.4 40,583.7 48,350.7 38,020.9 6<br />
- long term securities turnover, million CSD 277.3 9,740.3 40,644.6 34,566.3 48,350.7 38,020.9 6<br />
1 Previous results<br />
2 Estimated<br />
3 January-March 2006/January-March 2005<br />
4 Data refer to June 2006<br />
5 Classification in use as of 2004<br />
6 January-June 2006<br />
Source: Belgrade Stock Exchange<br />
PAGE 59


