

Download - FEAS
Download - FEAS
Download - FEAS

Create successful ePaper yourself
Turn your PDF publications into a flip-book with our unique Google optimized e-Paper software.
FEDERATION OF EURO-ASIAN STOCK EXCHANGES SEMI ANNUAL REPORT OCTOBER 2006<br />
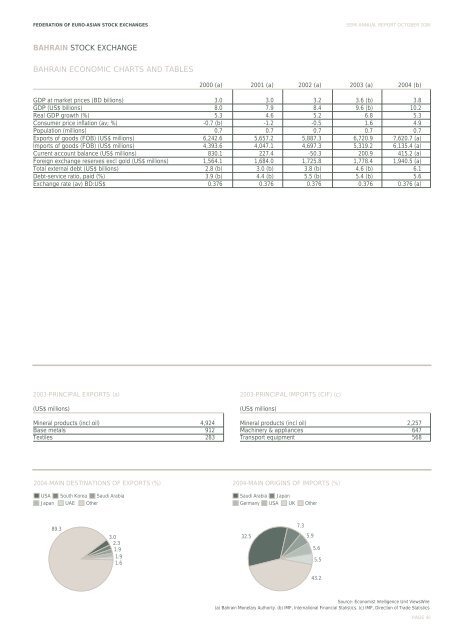
BAHRAIN STOCK EXCHANGE<br />
BAHRAIN ECONOMIC CHARTS AND TABLES<br />
2000 (a) 2001 (a) 2002 (a) 2003 (a) 2004 (b)<br />
GDP at market prices (BD billions) 3.0 3.0 3.2 3.6 (b) 3.8<br />
GDP (US$ billions) 8.0 7.9 8.4 9.6 (b) 10.2<br />
Real GDP growth (%) 5.3 4.6 5.2 6.8 5.3<br />
Consumer price inflation (av; %) -0.7 (b) -1.2 -0.5 1.6 4.9<br />
Population (millions) 0.7 0.7 0.7 0.7 0.7<br />
Exports of goods (FOB) (US$ millions) 6,242.6 5,657.2 5,887.3 6,720.9 7,620.7 (a)<br />
Imports of goods (FOB) (US$ millions) 4,393.6 4,047.1 4,697.3 5,319.2 6,135.4 (a)<br />
Current account balance (US$ millions) 830.1 227.4 -50.3 200.9 415.2 (a)<br />
Foreign exchange reserves excl gold (US$ millions) 1,564.1 1,684.0 1,725.8 1,778.4 1,940.5 (a)<br />
Total external debt (US$ billions) 2.8 (b) 3.0 (b) 3.8 (b) 4.6 (b) 6.1<br />
Debt-service ratio, paid (%) 3.9 (b) 4.4 (b) 5.5 (b) 5.4 (b) 5.6<br />
Exchange rate (av) BD:US$ 0.376 0.376 0.376 0.376 0.376 (a)<br />
2003-PRINCIPAL EXPORTS (a)<br />
(US$ millions)<br />
Mineral products (incl oil) 4,924<br />
Base metals 912<br />
Textiles 283<br />
2003-PRINCIPAL IMPORTS (CIF) (c)<br />
(US$ millions)<br />
Mineral products (incl oil) 2,257<br />
Machinery & appliances 647<br />
Transport equipment 568<br />
2004-MAIN DESTINATIONS OF EXPORTS (%) 2004-MAIN ORIGINS OF IMPORTS (%)<br />
USA<br />
Japan<br />
South Korea Saudi Arabia<br />
UAE Other<br />
Saudi Arabia Japan<br />
Germany USA UK<br />
Other<br />
89.3<br />
3.0<br />
2.3<br />
1.9<br />
1.9<br />
1.6<br />
32.5<br />
7.3<br />
5.9<br />
5.6<br />
5.5<br />
43.2<br />
Source: Economist Intelligence Unit ViewsWire<br />
(a) Bahrain Monetary Authority. (b) IMF, International Financial Statistics. (c) IMF, Direction of Trade Statistics<br />
PAGE 45


