

Download - FEAS
Download - FEAS
Download - FEAS

You also want an ePaper? Increase the reach of your titles
YUMPU automatically turns print PDFs into web optimized ePapers that Google loves.
FEDERATION OF EURO-ASIAN STOCK EXCHANGES SEMI ANNUAL REPORT OCTOBER 2006<br />
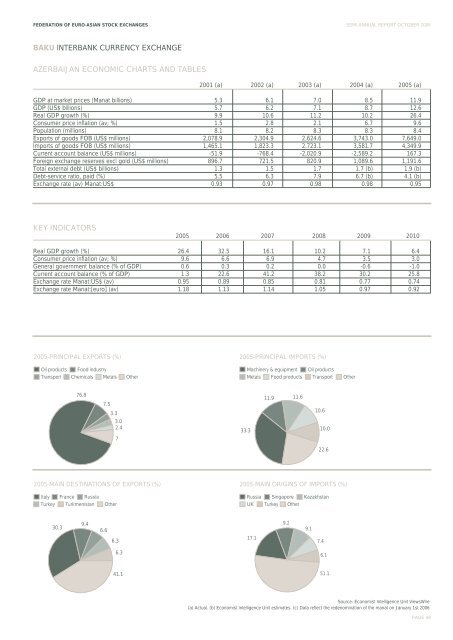
BAKU INTERBANK CURRENCY EXCHANGE<br />
AZERBAIJAN ECONOMIC CHARTS AND TABLES<br />
2001 (a) 2002 (a) 2003 (a) 2004 (a) 2005 (a)<br />
GDP at market prices (Manat billions) 5.3 6.1 7.0 8.5 11.9<br />
GDP (US$ billions) 5.7 6.2 7.1 8.7 12.6<br />
Real GDP growth (%) 9.9 10.6 11.2 10.2 26.4<br />
Consumer price inflation (av; %) 1.5 2.8 2.1 6.7 9.6<br />
Population (millions) 8.1 8.2 8.3 8.3 8.4<br />
Exports of goods FOB (US$ millions) 2,078.9 2,304.9 2,624.6 3,743.0 7,649.0<br />
Imports of goods FOB (US$ millions) 1,465.1 1,823.3 2,723.1 3,581.7 4,349.9<br />
Current account balance (US$ millions) -51.9 -768.4 -2,020.9 -2,589.2 167.3<br />
Foreign exchange reserves excl gold (US$ millions) 896.7 721.5 820.9 1,089.6 1,191.6<br />
Total external debt (US$ billions) 1.3 1.5 1.7 1.7 (b) 1.9 (b)<br />
Debt-service ratio, paid (%) 5.5 6.3 7.9 6.7 (b) 4.1 (b)<br />
Exchange rate (av) Manat:US$ 0.93 0.97 0.98 0.98 0.95<br />
KEY INDICATORS<br />
2005 2006 2007 2008 2009 2010<br />
Real GDP growth (%) 26.4 32.5 16.1 10.2 7.1 6.4<br />
Consumer price inflation (av; %) 9.6 6.6 6.9 4.7 3.5 3.0<br />
General government balance (% of GDP) 0.6 0.3 0.2 0.0 -0.6 -1.0<br />
Current account balance (% of GDP) 1.3 22.6 41.2 38.2 30.2 25.8<br />
Exchange rate Manat:US$ (av) 0.95 0.89 0.85 0.81 0.77 0.74<br />
Exchange rate Manat:[euro] (av) 1.18 1.13 1.14 1.05 0.97 0.92<br />
2005-PRINCIPAL EXPORTS (%) 2005-PRINCIPAL IMPORTS (%)<br />
Oil products<br />
Transport<br />
Food industry<br />
Chemicals Metals<br />
Other<br />
Machinery & equipment<br />
Metals Food products<br />
Oil products<br />
Transport<br />
Other<br />
76.8<br />
7.5<br />
3.3<br />
3.0<br />
2.4<br />
7<br />
33.3<br />
11.9<br />
11.6<br />
10.6<br />
10.0<br />
22.6<br />
2005-MAIN DESTINATIONS OF EXPORTS (%) 2005-MAIN ORIGINS OF IMPORTS (%)<br />
Italy<br />
Turkey<br />
France Russia<br />
Turkmenistan<br />
Other<br />
Russia<br />
UK<br />
Singapore<br />
Turkey Other<br />
Kazakhstan<br />
30.3<br />
9.4<br />
6.6<br />
6.3<br />
17.1<br />
9.2<br />
9.1<br />
7.4<br />
6.3<br />
6.1<br />
41.1<br />
51.1<br />
Source: Economist Intelligence Unit ViewsWire<br />
(a) Actual. (b) Economist Intelligence Unit estimates. (c) Data reflect the redenomination of the manat on January 1st 2006<br />
PAGE 49


