- Page 1 and 2: Analysing spatial point patterns in
- Page 3 and 4: CONTENTS 3 Contents PART I. OVERVIE
- Page 5 and 6: CONTENTS 5 PART I. OVERVIEW The fir
- Page 7 and 8: 130 1.1 Types of data 7 The mark co
- Page 9 and 10: 1.2 Typical scientific questions 9
- Page 11 and 12: 1.2 Typical scientific questions 11
- Page 13 and 14: 13 We’ll cover both classical and
- Page 15 and 16: 2.4 Marks and covariates 15 Data ar
- Page 17 and 18: 2.4 Marks and covariates 17 example
- Page 19 and 20: 3.3 Contributed libraries for R 19
- Page 21 and 22: 4.4 Licence 21 The response will be
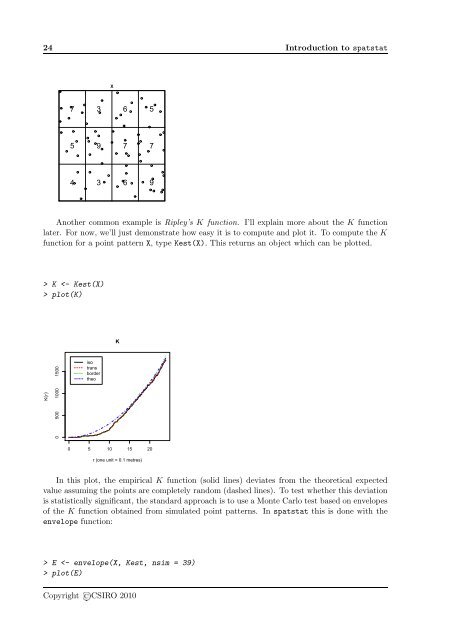
- Page 23: 0.005 4.6 Exploratory data analysis
- Page 27 and 28: 4.8 Multitype point patterns 27 4.8
- Page 29 and 30: 4.8 Multitype point patterns 29 e.g
- Page 31 and 32: 4.9 Installed datasets 31 PART II.
- Page 33 and 34: 5.2 Classes in spatstat 33 Point pa
- Page 35 and 36: 5.3 Return values 35 density(swedis
- Page 37 and 38: 5.3 Return values 37 Many of the fu
- Page 39 and 40: 6.2 Creating a ppp object 39 To rea
- Page 41 and 42: 6.4 Categorical marks 41 longleaf T
- Page 43 and 44: 6.6 Checking data 43 > par(mfrow =
- Page 45 and 46: 45 7 Converting from GIS formats Th
- Page 47 and 48: 8.1 Making windows by hand 47 8.1.3
- Page 49 and 50: 8.2 Converting from GIS formats 49
- Page 51 and 52: 8.5 Creating a point pattern in any
- Page 53 and 54: 53 9 Manipulating point patterns Be
- Page 55 and 56: 9.2 Operations on ppp objects 55 [1
- Page 57 and 58: 9.2 Operations on ppp objects 57 ma
- Page 59 and 60: 9.3 Example 59 You may also notice
- Page 61 and 62: 9.5 List of operations on point pat
- Page 63 and 64: 63 10 Pixel images in spatstat An o
- Page 65 and 66: 10.2 Inspecting an image 65 > f w
- Page 67 and 68: 10.2 Inspecting an image 67 > plot(
- Page 69 and 70: 10.3 Manipulating images 69 0 200 6
- Page 71 and 72: 71 > W V 3) > U 3, 42, Z)) Other
- Page 73 and 74: 11.3 Operations involving a tessell
- Page 75 and 76:
11.3 Operations involving a tessell
- Page 77 and 78:
11.3 Operations involving a tessell
- Page 79 and 80:
12.2 Inhomogeneous intensity 79 12.
- Page 81 and 82:
12.2 Inhomogeneous intensity 81 den
- Page 83 and 84:
13.3 Relative distribution estimate
- Page 85 and 86:
1 1 2 4 4 1 2 13.4 Distance map 85
- Page 87 and 88:
13.4 Distance map 87 PART IV. POISS
- Page 89 and 90:
14.2 Quadrat counting tests for CSR
- Page 91 and 92:
14.4 Kolmogorov-Smirnov test of CSR
- Page 93 and 94:
14.5 Using covariate data 93 Becaus
- Page 95 and 96:
95 15 Maximum likelihood for Poisso
- Page 97 and 98:
15.3 Fitting Poisson processes in s
- Page 99 and 100:
15.4 Fitted models 99 > ppm(bei, ~s
- Page 101 and 102:
15.4 Fitted models 101 > predict(fi
- Page 103 and 104:
15.4 Fitted models 103 effectfun(fi
- Page 105 and 106:
15.5 Simulating the fitted model 10
- Page 107 and 108:
16.2 Validation using residuals 107
- Page 109 and 110:
16.2 Validation using residuals 109
- Page 111 and 112:
16.2 Validation using residuals 111
- Page 113 and 114:
113 PART V. INTERACTION Part V of t
- Page 115 and 116:
115 independent + + + + + + + + + +
- Page 117 and 118:
19.2 Empty space distances 117 Anot
- Page 119 and 120:
19.2 Empty space distances 119 cell
- Page 121 and 122:
19.2 Empty space distances 121 Fest
- Page 123 and 124:
19.3 Nearest neighbour distances 12
- Page 125 and 126:
19.4 Pairwise distances and the K f
- Page 127 and 128:
19.4 Pairwise distances and the K f
- Page 129 and 130:
19.6 Manipulating and plotting summ
- Page 131 and 132:
19.7 Caveats 131 Kest(X) X K(r) 0.0
- Page 133 and 134:
20.1 Envelopes and Monte Carlo test
- Page 135 and 136:
20.1 Envelopes and Monte Carlo test
- Page 137 and 138:
20.1 Envelopes and Monte Carlo test
- Page 139 and 140:
139 21 Spatial bootstrap methods Sp
- Page 141 and 142:
22.2 Cox processes 141 22.2 Cox pro
- Page 143 and 144:
22.4 Sequential models 143 rSSI(0.0
- Page 145 and 146:
23.1 Fitting a cluster process 145
- Page 147 and 148:
23.4 Generic algorithm for minimum
- Page 149 and 150:
149 In data sharpening [27] the poi
- Page 151 and 152:
25.2 Inhomogeneous cluster models 1
- Page 153 and 154:
25.4 Local scaling 153 > data(bei)
- Page 155 and 156:
25.4 Local scaling 155 PART VI. GIB
- Page 157 and 158:
26.3 Pairwise interaction models 15
- Page 159 and 160:
26.4 Higher-order interactions 159
- Page 161 and 162:
26.6 Simulating Gibbs models 161 St
- Page 163 and 164:
27.2 Fitting Gibbs models in spatst
- Page 165 and 166:
27.3 Interpoint interactions 165 27
- Page 167 and 168:
27.4 Fitted point process models 16
- Page 169 and 170:
27.6 Dealing with nuisance paramete
- Page 171 and 172:
171 Stationary Strauss process Firs
- Page 173 and 174:
28.2 Residuals for Gibbs processes
- Page 175 and 176:
28.2 Residuals for Gibbs processes
- Page 177 and 178:
28.3 New methods 177 PART VII. MARK
- Page 179 and 180:
29.3 Methodological issues 179 A ma
- Page 181 and 182:
181 Chorley−Ribble Data For furth
- Page 183 and 184:
30.2 Inspecting a marked point patt
- Page 185 and 186:
30.3 Manipulating data 185 > data(l
- Page 187 and 188:
187 31 Exploratory tools for multit
- Page 189 and 190:
31.2 Simple summaries of neighbouri
- Page 191 and 192:
31.3 Distance methods and summary f
- Page 193 and 194:
31.3 Distance methods and summary f
- Page 195 and 196:
31.3 Distance methods and summary f
- Page 197 and 198:
31.4 Randomisation tests 197 31.4 R
- Page 199 and 200:
31.4 Randomisation tests 199 > plot
- Page 201 and 202:
32.1 Numeric marks: distribution an
- Page 203 and 204:
32.3 Reverse conditional moments 20
- Page 205 and 206:
33.2 Simulation 205 33.2 Simulation
- Page 207 and 208:
33.3 Fitting Poisson models 207 33.
- Page 209 and 210:
33.3 Fitting Poisson models 209 whe
- Page 211 and 212:
34.1 Gibbs models 211 34.1.3 Pairwi
- Page 213 and 214:
34.3 Fitting Gibbs models to multit
- Page 215 and 216:
34.3 Fitting Gibbs models to multit
- Page 217 and 218:
217 There are also the usual method
- Page 219 and 220:
219 lty col key label meaning iso 1
- Page 221 and 222:
221 38 Replicated data and hyperfra
- Page 223 and 224:
223 H H(r) 0.0 0.2 0.4 0.6 0.8 km h
- Page 225 and 226:
REFERENCES 225 References [1] F.P.
- Page 227 and 228:
REFERENCES 227 [32] P.J. Diggle. Bi
- Page 229 and 230:
Index analysis of deviance, 103 are
- Page 231 and 232:
INDEX 231 models, 25, 224 Monte Car


