Analysing spatial point patterns in R - CSIRO
Analysing spatial point patterns in R - CSIRO
Analysing spatial point patterns in R - CSIRO

You also want an ePaper? Increase the reach of your titles
YUMPU automatically turns print PDFs into web optimized ePapers that Google loves.
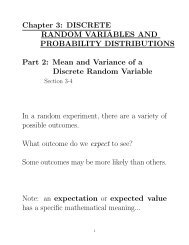
4.7 Models 25<br />
E<br />
K(r)<br />
0 500 1000 1500 2000<br />
obs<br />
theo<br />
hi<br />
lo<br />
0 5 10 15 20<br />
r (one unit = 0.1 metres)<br />
4.7 Models<br />
The ma<strong>in</strong> strength of spatstat is that it supports statistical models of <strong>po<strong>in</strong>t</strong> <strong>patterns</strong>. Models<br />
can be fitted to <strong>po<strong>in</strong>t</strong> pattern data; the fitted models can be used to summarise the data or<br />
make predictions; the fitted models can be simulated (i.e. a random pattern can be generated<br />
accord<strong>in</strong>g to the model); and there are facilities for model selection, for test<strong>in</strong>g whether a term <strong>in</strong><br />
the model is required (like analysis of variance), and for model criticism (like residuals, regression<br />
diagnostics, and goodness-of-fit tests).<br />
Participants <strong>in</strong> this workshop often say “I’m not <strong>in</strong>terested <strong>in</strong> modell<strong>in</strong>g my data; I only<br />
want to analyse it.” However, any k<strong>in</strong>d of data analysis or data manipulation is equivalent to<br />
impos<strong>in</strong>g assumptions. We can’t say someth<strong>in</strong>g is ‘statistically significant’ unless we assume a<br />
model, because the p-value is the probability accord<strong>in</strong>g to a model. The purpose of statistical<br />
modell<strong>in</strong>g is to make these assumptions or hypotheses explicit. By do<strong>in</strong>g so, we are able to<br />
determ<strong>in</strong>e the best and most powerful way to analyse data, we can subject the assumptions<br />
to criticism, and we are more aware of the potential pitfalls of analysis. In statistical usage, a<br />
model is always tentative; it is assumed for the sake of argument; we might even want it to be<br />
wrong. In the famous words of George Box: “All models are wrong, but some are useful.” If you<br />
only want to do data analysis without statistical models, your results will be less <strong>in</strong>formative<br />
and more vulnerable to critique.<br />
A statistical model for a <strong>po<strong>in</strong>t</strong> pattern is technically termed a <strong>po<strong>in</strong>t</strong> process model. Th<strong>in</strong>k of<br />
a <strong>po<strong>in</strong>t</strong> process as a black box that generates a random <strong>spatial</strong> <strong>po<strong>in</strong>t</strong> pattern accord<strong>in</strong>g to some<br />
rules. To fit a <strong>po<strong>in</strong>t</strong> process model to a <strong>po<strong>in</strong>t</strong> pattern dataset <strong>in</strong> spatstat, use the function ppm<br />
(<strong>po<strong>in</strong>t</strong> process model). This is analogous to the standard functions <strong>in</strong> R for fitt<strong>in</strong>g l<strong>in</strong>ear models<br />
(lm), generalized l<strong>in</strong>ear models (glm) and so on.<br />
> data(swedishp<strong>in</strong>es)<br />
> X fit fit<br />
Stationary Strauss process<br />
First order term:<br />
beta<br />
0.04378316<br />
Copyright<strong>CSIRO</strong> 2010