Practical Manual - Malareo
Practical Manual - Malareo
Practical Manual - Malareo

Create successful ePaper yourself
Turn your PDF publications into a flip-book with our unique Google optimized e-Paper software.
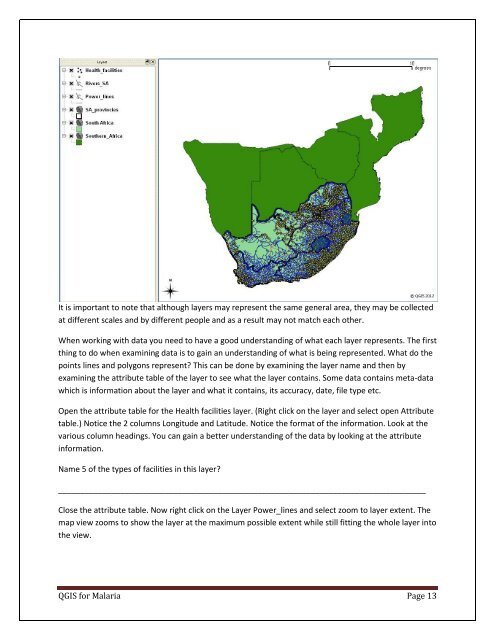
It is important to note that although layers may represent the same general area, they may be collected<br />
at different scales and by different people and as a result may not match each other.<br />
When working with data you need to have a good understanding of what each layer represents. The first<br />
thing to do when examining data is to gain an understanding of what is being represented. What do the<br />
points lines and polygons represent This can be done by examining the layer name and then by<br />
examining the attribute table of the layer to see what the layer contains. Some data contains meta-data<br />
which is information about the layer and what it contains, its accuracy, date, file type etc.<br />
Open the attribute table for the Health facilities layer. (Right click on the layer and select open Attribute<br />
table.) Notice the 2 columns Longitude and Latitude. Notice the format of the information. Look at the<br />
various column headings. You can gain a better understanding of the data by looking at the attribute<br />
information.<br />
Name 5 of the types of facilities in this layer<br />
___________________________________________________________________________________<br />
Close the attribute table. Now right click on the Layer Power_lines and select zoom to layer extent. The<br />
map view zooms to show the layer at the maximum possible extent while still fitting the whole layer into<br />
the view.<br />
QGIS for Malaria Page 13