


Create successful ePaper yourself
Turn your PDF publications into a flip-book with our unique Google optimized e-Paper software.
16 — 2010 <strong>FINANCIAL</strong> <strong>REPORT</strong><br />
These offers also benefi ted from regulatory changes authorising<br />
the increase in the prize payout to players. Finally, the football<br />
World Cup, a major sporting event, was a resounding success.<br />
4.1.2. Distribution of player stake<br />
The €10,551.4m in player stake were distributed between<br />
players, the hedging of counterparty risk, French public fi nance<br />
and la <strong>Française</strong> <strong>des</strong> <strong>Jeux</strong>.<br />
The amount paid out to players was €6,788.9m. This fi gure was<br />
up by 7.6% over 2009, mainly due to the increase in prize payout<br />
to players on sports betting, both in the brick-and-mortar network<br />
as well as online.<br />
Legislative changes authorised the increase in the maximum payout<br />
from an average of 75% to 85% and as a result, the rate of<br />
redistribution to players rose from 63.1% to 64.3%.<br />
Allocation to counterparty funds, net of counterparty spreads,<br />
totalled €76.1m and represented 0.7% of player stake in 2010<br />
compared to 0.4% in 2009. These funds are intended to hedge<br />
the counterparty risk of certain games, i.e. the risk that the total<br />
prize amount actually distributed to winners is higher than the share<br />
of player stake set aside for this purpose, in accordance with the<br />
requirements of the Budget Minister’s decree. The increase in net<br />
provisions is linked to the rise in player stake and changes in<br />
counterparty spreads.<br />
Government levies on player stake (including VAT on gaming<br />
revenue, tax on winnings and rounding of winnings, excluding the<br />
permanent fund surplus) totalled €2,516.0m, down 0.6% compared<br />
with 2009. These represented 23.8% of player stake, against 25.3%<br />
in 2009, a decline attributed to the increase in prize payouts to<br />
players.<br />
Gaming revenue corresponds to commissions paid to la <strong>Française</strong><br />
<strong>des</strong> <strong>Jeux</strong> and its distribution network, which totalled €1,170.4m, or<br />
11.1% of player stake, unchanged compared to 2009.<br />
4.1.3. Other revenue and other operating income<br />
Other revenue, mainly composed of rentals of point-of-sale<br />
(POS) terminals and equipment to retailers, totalled €25.4m, up<br />
3.9% compared to 2009 due to the increase in the number of<br />
real-time points of sale.<br />
Revenue from ordinary activities, composed of gaming<br />
revenue and other revenue, amou nted to €1,195.8m, against<br />
€1,138.4m in 2009.<br />
Other operating income consists primarily of unclaimed prizes<br />
on scratch games (+ €7.2m) and capitalised production (+ €2.8m).<br />
Operating income amounted to €1,256.1m, up 5.5% compared<br />
to 2009.<br />
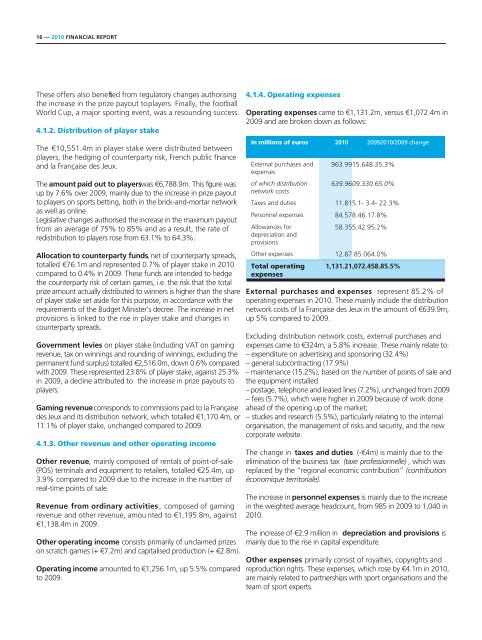
4.1.4. Operating expenses<br />
Operating expenses came to €1,131.2m, versus €1,072.4m in<br />
2009 and are broken down as follows:<br />
In millions of euros 2010 20092010/2009 change<br />
External purchases and<br />
expenses<br />
of which distribution<br />
network costs<br />
963.9915.648.35.3%<br />
639.9609.330.65.0%<br />
Taxes and duties 11.815.1- 3.4- 22.3%<br />
Personnel expenses 84.578.46.17.8%<br />
Allowances for<br />
depreciation and<br />
provisions<br />
58.355.42.95.2%<br />
Other expenses 12.87.85.064.0%<br />
Total operating<br />
expenses<br />
1,131.21,072.458.85.5%<br />
External purchases and expenses represent 85.2% of<br />
operating expenses in 2010. These mainly include the distribution<br />
network costs of la <strong>Française</strong> <strong>des</strong> <strong>Jeux</strong> in the amount of €639.9m,<br />
up 5% compared to 2009.<br />
Excluding distribution network costs, external purchases and<br />
expenses came to €324m, a 5.8% increase. These mainly relate to:<br />
– expenditure on advertising and sponsoring (32.4%)<br />
– general subcontracting (17.9%)<br />
– maintenance (15.2%), based on the number of points of sale and<br />
the equipment installed<br />
– postage, telephone and leased lines (7.2%), unchanged from 2009<br />
– fees (5.7%), which were higher in 2009 because of work done<br />
ahead of the opening up of the market;<br />
– studies and research (5.5%), particularly relating to the internal<br />
organisation, the management of risks and security, and the new<br />
corporate website.<br />
The change in taxes and duties (-€4m) is mainly due to the<br />
elimination of the business tax (taxe professionnelle) , which was<br />
replaced by the “regional economic contribution” (contribution<br />
économique territoriale).<br />
The increase in personnel expenses is mainly due to the increase<br />
in the weighted average headcount, from 985 in 2009 to 1,040 in<br />
2010.<br />
The increase of €2.9 million in depreciation and provisions is<br />
mainly due to the rise in capital expenditure.<br />
Other expenses primarily consist of royalties, copyrights and<br />
reproduction rights. These expenses, which rose by €4.1m in 2010,<br />
are mainly related to partnerships with sport organisations and the<br />
team of sport experts.
