52 — 2010 <strong>FINANCIAL</strong> <strong>REPORT</strong> 9 ADDITIONAL DISCLOSURES ON <strong>FINANCIAL</strong> INSTRUMENTS 9.1. IMPACT OF <strong>FINANCIAL</strong> INSTRUMENTS ON THE BALANCE SHEET In thousands of euros 31.12.2009 Carrying amount In thousands of euros 31.12.2010 AmountAnalysis by IAS 39 category Carrying amount Fair value Loans and receivables Liabilities at amortised cost Non-current fi nancial assets 510,361510,361-480,59829,763 Other non-current fi nancial assets 15,27215,27215,272-- Trade and other receivables 8,2228,2228,222-- Network receivables 215,259215,259215,259-- Current income tax assets 4,4574,4574,457-- Current fi nancial assets 342,381342,38122,020319,812549 Other current assets 65,04565,04565,045-- Cash and cash equivalents 369,119369,11931,619337,500- Total fi nancial assets 1,530,1161,530,116361,8941,137,91030,312 Non-current player funds 196,216196,216196,216-- Trade and other payables 83,39783,39783,397-- Network payables 131,715131,715131,715-- Government gaming levies 177,297177,297177,297-- Winnings payable and distributable, current player funds 361,641361,641361,641-- Other current liabilities 95,05895,05895,058-- Current income tax liabilities 764764764-- AmountAnalysis by IAS 39 category Non-current fi nancial assets 406,590406,590-406,590 Other non-current fi nancial assets 3,9853,9853,985-- Trade and other receivables 7,9967,9967,996-- Network receivables 173,760173,760173,760-- Current income tax assets 1,8771,8771,877-- Other fi nancial liabilities 26,85526,85526,343-512 Fair value Loans and receivables Liabilities at amortised cost Current fi nancial assets 132,445132,44533,05799,048340 Other current assets 60,09960,09960,099-- Cash and cash equivalents 748,464748,464129,948618,516- Total fi nancial assets 1,535,2161,535,216410,7221,124,154340 Non-current player funds 198,832198,832198,832-- Trade and other payables 61,78061,78061,780-- Network payables 115,966115,966115,966-- Government gaming levies 125,221125,221125,221-- Winnings payable and distributable, current player funds 436,504436,504436,504-- Other current liabilities 88,99188,99188,991-- Current income tax liabilities 562562562-- Other fi nancial liabilities 30,52130,52130,334-187 Total fi nancial liabilities 1,058,3771,058,3771,058,190-187 Total fi nancial liabilities 1,072,9431,072,9431,072,431-512 *Fair value through profi t or loss. Available-for-sale financial assets Available-for-sale financial assets Derivative fi nancial instruments* Derivative fi nancial instruments*
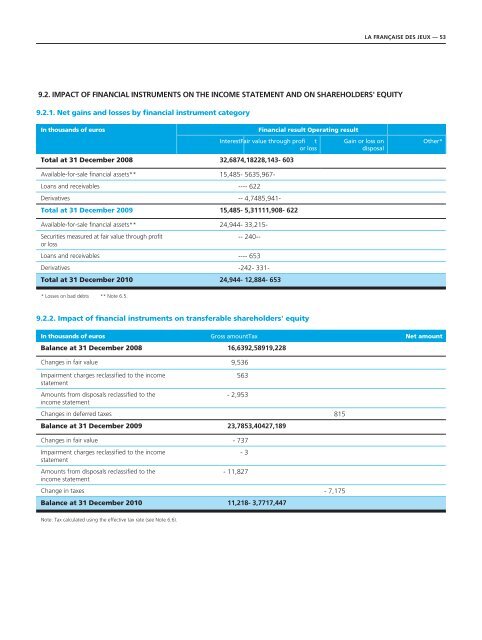
9.2. IMPACT OF <strong>FINANCIAL</strong> INSTRUMENTS ON THE INCOME STATEMENT AND ON SHAREHOLDERS' EQUITY 9.2.1. Net gains and losses by fi nancial instrument category In thousands of euros Financial result Operating result InterestFair value through profi t or loss Total at 31 December 2008 32,6874,18228,143- 603 Available-for-sale fi nancial assets** 15,485- 5635,967- Loans and receivables ---- 622 Derivatives -- 4,7485,941- Total at 31 December 2009 15,485- 5,31111,908- 622 Available-for-sale fi nancial assets** 24,944- 33,215- Securities measured at fair value through profi t or loss -- 240-- Loans and receivables ---- 653 Derivatives -242- 331- Total at 31 December 2010 24,944- 12,884- 653 * Losses on bad debts ** Note 6.5. 9.2.2. Impact of fi nancial instruments on transferable shareholders' equity LA FRANÇAISE DES JEUX — 53 Gain or loss on disposal In thousands of euros Gross amountTax Net amount Balance at 31 December 2008 16,6392,58919,228 Changes in fair value 9,536 Impairment charges reclassifi ed to the income statement Amounts from disposals reclassifi ed to the income statement 563 - 2,953 Changes in deferred taxes 815 Balance at 31 December 2009 23,7853,40427,189 Changes in fair value - 737 Impairment charges reclassifi ed to the income statement Amounts from disposals reclassifi ed to the income statement - 3 - 11,827 Change in taxes - 7,175 Balance at 31 December 2010 11,218- 3,7717,447 Note: Tax calculated using the effective tax rate (see Note 6.6). Other*