NDT Annual Report 2012/13 - Department of Tourism
NDT Annual Report 2012/13 - Department of Tourism
NDT Annual Report 2012/13 - Department of Tourism

You also want an ePaper? Increase the reach of your titles
YUMPU automatically turns print PDFs into web optimized ePapers that Google loves.
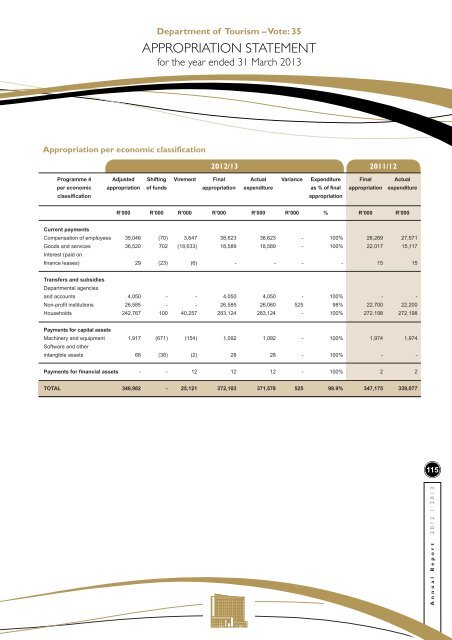
<strong>Department</strong> <strong>of</strong> <strong>Tourism</strong> – Vote: 35<br />
APPROPRIATION STATEMENT<br />
for the year ended 31 March 20<strong>13</strong><br />
Appropriation per economic classification<br />
<strong>2012</strong>/<strong>13</strong> 2011/12<br />
Programme 4<br />
per economic<br />
classification<br />
Adjusted<br />
appropriation<br />
Shifting<br />
<strong>of</strong> funds<br />
Virement<br />
Final<br />
appropriation<br />
Actual<br />
expenditure<br />
Variance<br />
Expenditure<br />
as % <strong>of</strong> final<br />
appropriation<br />
Final<br />
appropriation<br />
Actual<br />
expenditure<br />
R’000<br />
R’000<br />
R’000<br />
R’000<br />
R’000<br />
R’000<br />
%<br />
R’000<br />
R’000<br />
Current payments<br />
Compensation <strong>of</strong> employees<br />
Goods and services<br />
Interest (paid on<br />
finance leases)<br />
35,046<br />
36,520<br />
29<br />
(70)<br />
702<br />
(23)<br />
3,647<br />
(18,633)<br />
(6)<br />
38,623<br />
18,589<br />
-<br />
38,623<br />
18,589<br />
-<br />
-<br />
-<br />
-<br />
100%<br />
100%<br />
-<br />
28,269<br />
22,017<br />
15<br />
27,571<br />
15,117<br />
15<br />
Transfers and subsidies<br />
<strong>Department</strong>al agencies<br />
and accounts<br />
Non-pr<strong>of</strong>it institutions<br />
Households<br />
4,050<br />
26,585<br />
242,767<br />
-<br />
-<br />
100<br />
-<br />
-<br />
40,257<br />
4,050<br />
26,585<br />
283,124<br />
4,050<br />
26,060<br />
283,124<br />
-<br />
525<br />
-<br />
100%<br />
98%<br />
100%<br />
-<br />
22,700<br />
272,198<br />
-<br />
22,200<br />
272,198<br />
Payments for capital assets<br />
Machinery and equipment<br />
S<strong>of</strong>tware and other<br />
intangible assets<br />
1,917<br />
68<br />
(671)<br />
(38)<br />
(154)<br />
(2)<br />
1,092<br />
28<br />
1,092<br />
28<br />
-<br />
-<br />
100%<br />
100%<br />
1,974<br />
-<br />
1,974<br />
-<br />
Payments for financial assets<br />
-<br />
-<br />
12<br />
12<br />
12<br />
-<br />
100%<br />
2<br />
2<br />
TOTAL<br />
346,982<br />
-<br />
25,121<br />
372,103<br />
371,578<br />
525<br />
99.9%<br />
347,175<br />
339,077<br />
115<br />
<strong>Annual</strong> <strong>Report</strong> <strong>2012</strong> / 20<strong>13</strong>