Comprehensive District Annual Plan 2011-12 Balasore District
Comprehensive District Annual Plan 2011-12 Balasore District
Comprehensive District Annual Plan 2011-12 Balasore District
You also want an ePaper? Increase the reach of your titles
YUMPU automatically turns print PDFs into web optimized ePapers that Google loves.
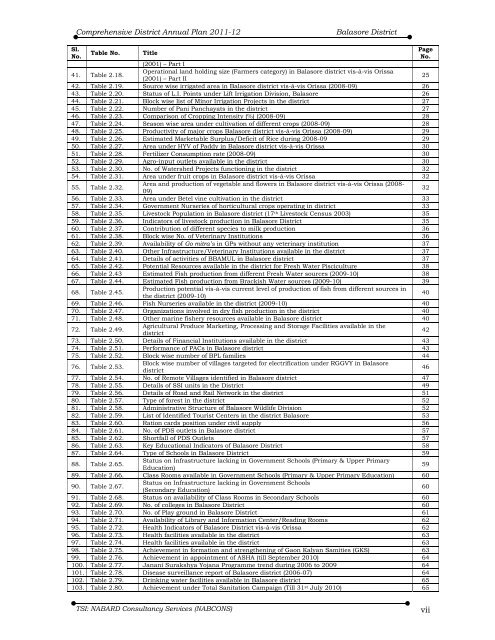
<strong>Comprehensive</strong> <strong>District</strong> <strong>Annual</strong> <strong>Plan</strong> <strong>2011</strong>-<strong>12</strong> <strong>Balasore</strong> <strong>District</strong><br />
Sl.<br />
No.<br />
Table No. Title<br />
41. Table 2.18.<br />
(2001) – Part I<br />
Operational land holding size (Farmers category) in <strong>Balasore</strong> district vis-à-vis Orissa<br />
(2001) – Part II<br />
25<br />
42. Table 2.19. Source wise irrigated area in <strong>Balasore</strong> district vis-à-vis Orissa (2008-09) 26<br />
43. Table 2.20. Status of L.I. Points under Lift Irrigation Division, <strong>Balasore</strong> 26<br />
44. Table 2.21. Block wise list of Minor Irrigation Projects in the district 27<br />
45. Table 2.22. Number of Pani Panchayats in the district 27<br />
46. Table 2.23. Comparison of Cropping Intensity (%) (2008-09) 28<br />
47. Table 2.24. Season wise area under cultivation of different crops (2008-09) 28<br />
48. Table 2.25. Productivity of major crops <strong>Balasore</strong> district vis-à-vis Orissa (2008-09) 29<br />
49. Table 2.26. Estimated Marketable Surplus/Deficit of Rice during 2008-09 29<br />
50. Table 2.27. Area under HYV of Paddy in <strong>Balasore</strong> district vis-à-vis Orissa 30<br />
51. Table 2.28. Fertilizer Consumption rate (2008-09) 30<br />
52. Table 2.29. Agro-input outlets available in the district 30<br />
53. Table 2.30. No. of Watershed Projects functioning in the district 32<br />
54. Table 2.31. Area under fruit crops in <strong>Balasore</strong> district vis-à-vis Orissa 32<br />
55. Table 2.32.<br />
Area and production of vegetable and flowers in <strong>Balasore</strong> district vis-à-vis Orissa (2008-<br />
09)<br />
32<br />
56. Table 2.33. Area under Betel vine cultivation in the district 33<br />
57. Table 2.34. Government Nurseries of horticultural crops operating in district 33<br />
58. Table 2.35. Livestock Population in <strong>Balasore</strong> district (17th Livestock Census 2003) 35<br />
59. Table 2.36. Indicators of livestock production in <strong>Balasore</strong> <strong>District</strong> 35<br />
60. Table 2.37. Contribution of different species to milk production 36<br />
61. Table 2.38. Block wise No. of Veterinary Institutions 36<br />
62. Table 2.39. Availability of Go mitra’s in GPs without any veterinary institution 37<br />
63. Table 2.40. Other Infrastructure/Veterinary Institutions available in the district 37<br />
64. Table 2.41. Details of activities of BBAMUL in <strong>Balasore</strong> district 37<br />
65. Table 2.42. Potential Resources available in the district for Fresh Water Pisciculture 38<br />
66. Table 2.43 Estimated Fish production from different Fresh Water sources (2009-10) 38<br />
67. Table 2.44. Estimated Fish production from Brackish Water sources (2009-10) 39<br />
68. Table 2.45.<br />
Production potential vis-à-vis current level of production of fish from different sources in<br />
the district (2009-10)<br />
40<br />
69. Table 2.46. Fish Nurseries available in the district (2009-10) 40<br />
70. Table 2.47. Organizations involved in dry fish production in the district 40<br />
71. Table 2.48. Other marine fishery resources available in <strong>Balasore</strong> district 40<br />
72. Table 2.49.<br />
Agricultural Produce Marketing, Processing and Storage Facilities available in the<br />
district<br />
42<br />
73. Table 2.50. Details of Financial Institutions available in the district 43<br />
74. Table 2.51. Performance of PACs in <strong>Balasore</strong> district 43<br />
75. Table 2.52. Block wise number of BPL families 44<br />
76. Table 2.53.<br />
Block wise number of villages targeted for electrification under RGGVY in <strong>Balasore</strong><br />
district<br />
46<br />
77. Table 2.54. No. of Remote Villages identified in <strong>Balasore</strong> district 47<br />
78. Table 2.55. Details of SSI units in the <strong>District</strong> 49<br />
79. Table 2.56. Details of Road and Rail Network in the district 51<br />
80. Table 2.57. Type of forest in the district 52<br />
81. Table 2.58. Administrative Structure of <strong>Balasore</strong> Wildlife Division 52<br />
82. Table 2.59. List of Identified Tourist Centers in the district <strong>Balasore</strong> 53<br />
83. Table 2.60. Ration cards position under civil supply 56<br />
84. Table 2.61. No. of PDS outlets in <strong>Balasore</strong> district 57<br />
85. Table 2.62. Shortfall of PDS Outlets 57<br />
86. Table 2.63. Key Educational Indicators of <strong>Balasore</strong> <strong>District</strong> 58<br />
87. Table 2.64. Type of Schools in <strong>Balasore</strong> <strong>District</strong> 59<br />
88. Table 2.65.<br />
Status on Infrastructure lacking in Government Schools (Primary & Upper Primary<br />
Education)<br />
59<br />
89. Table 2.66. Class Rooms available in Government Schools (Primary & Upper Primary Education) 60<br />
90. Table 2.67.<br />
Status on Infrastructure lacking in Government Schools<br />
(Secondary Education)<br />
60<br />
91. Table 2.68. Status on availability of Class Rooms in Secondary Schools 60<br />
92. Table 2.69. No. of colleges in <strong>Balasore</strong> <strong>District</strong> 60<br />
93. Table 2.70. No. of Play ground in <strong>Balasore</strong> <strong>District</strong> 61<br />
94. Table 2.71. Availability of Library and Information Center/Reading Rooms 62<br />
95. Table 2.72. Health Indicators of <strong>Balasore</strong> <strong>District</strong> vis-à-vis Orissa 62<br />
96. Table 2.73. Health facilities available in the district 63<br />
97. Table 2.74. Health facilities available in the district 63<br />
98. Table 2.75. Achievement in formation and strengthening of Gaon Kalyan Samities (GKS) 63<br />
99. Table 2.76. Achievement in appointment of ASHA (till September 2010) 64<br />
100. Table 2.77. Janani Surakshya Yojana Programme trend during 2006 to 2009 64<br />
101. Table 2.78. Disease surveillance report of <strong>Balasore</strong> district (2006-07) 64<br />
102. Table 2.79. Drinking water facilities available in <strong>Balasore</strong> district 65<br />
103. Table 2.80. Achievement under Total Sanitation Campaign (Till 31st July 2010) 65<br />
TSI: NABARD Consultancy Services (NABCONS) vii<br />
Page<br />
No.


