National Horticultural Research Network - Horticulture Industry ...
National Horticultural Research Network - Horticulture Industry ...
National Horticultural Research Network - Horticulture Industry ...

Create successful ePaper yourself
Turn your PDF publications into a flip-book with our unique Google optimized e-Paper software.
<strong>National</strong> <strong>Horticultural</strong> <strong>Research</strong> <strong>Network</strong><br />
Fruit Sector RD&E Framework September 2010<br />
__________________________________________________________________________________<br />
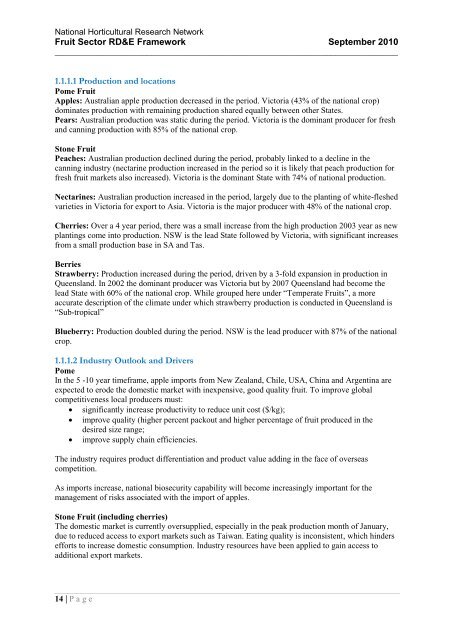
1.1.1.1 Production and locations<br />
Pome Fruit<br />
Apples: Australian apple production decreased in the period. Victoria (43% of the national crop)<br />
dominates production with remaining production shared equally between other States.<br />
Pears: Australian production was static during the period. Victoria is the dominant producer for fresh<br />
and canning production with 85% of the national crop.<br />
Stone Fruit<br />
Peaches: Australian production declined during the period, probably linked to a decline in the<br />
canning industry (nectarine production increased in the period so it is likely that peach production for<br />
fresh fruit markets also increased). Victoria is the dominant State with 74% of national production.<br />
Nectarines: Australian production increased in the period, largely due to the planting of white-fleshed<br />
varieties in Victoria for export to Asia. Victoria is the major producer with 48% of the national crop.<br />
Cherries: Over a 4 year period, there was a small increase from the high production 2003 year as new<br />
plantings come into production. NSW is the lead State followed by Victoria, with significant increases<br />
from a small production base in SA and Tas.<br />
Berries<br />
Strawberry: Production increased during the period, driven by a 3-fold expansion in production in<br />
Queensland. In 2002 the dominant producer was Victoria but by 2007 Queensland had become the<br />
lead State with 60% of the national crop. While grouped here under “Temperate Fruits”, a more<br />
accurate description of the climate under which strawberry production is conducted in Queensland is<br />
“Sub-tropical”<br />
Blueberry: Production doubled during the period. NSW is the lead producer with 87% of the national<br />
crop.<br />
1.1.1.2 <strong>Industry</strong> Outlook and Drivers<br />
Pome<br />
In the 5 -10 year timeframe, apple imports from New Zealand, Chile, USA, China and Argentina are<br />
expected to erode the domestic market with inexpensive, good quality fruit. To improve global<br />
competitiveness local producers must:<br />
significantly increase productivity to reduce unit cost ($/kg);<br />
improve quality (higher percent packout and higher percentage of fruit produced in the<br />
desired size range;<br />
improve supply chain efficiencies.<br />
The industry requires product differentiation and product value adding in the face of overseas<br />
competition.<br />
As imports increase, national biosecurity capability will become increasingly important for the<br />
management of risks associated with the import of apples.<br />
Stone Fruit (including cherries)<br />
The domestic market is currently oversupplied, especially in the peak production month of January,<br />
due to reduced access to export markets such as Taiwan. Eating quality is inconsistent, which hinders<br />
efforts to increase domestic consumption. <strong>Industry</strong> resources have been applied to gain access to<br />
additional export markets.<br />
14 | P a g e