National Horticultural Research Network - Horticulture Industry ...
National Horticultural Research Network - Horticulture Industry ...
National Horticultural Research Network - Horticulture Industry ...

You also want an ePaper? Increase the reach of your titles
YUMPU automatically turns print PDFs into web optimized ePapers that Google loves.
<strong>National</strong> <strong>Horticultural</strong> <strong>Research</strong> <strong>Network</strong><br />
Vegetable Sector RD&E Framework September 2010<br />
___________________________________________________________________<br />
Protected cropping and hydroponic production currently accounts for around 10% of both tomato<br />
and capsicum production. Covered production enables higher yields better and more consistent quality<br />
and more consistent supply at better controlled timings - all in line with good marketing.<br />
Protected cropping is likely to increase to a larger proportion of the crop. In the US, 40% of tomatoes<br />
are grown under cover.<br />
Opportunities. Higher priced tomatoes from covered production allow the redevelopment of the<br />
lower priced, field-grown sector using determinant varieties, low input systems and (possibly)<br />
mechanical harvesting.<br />
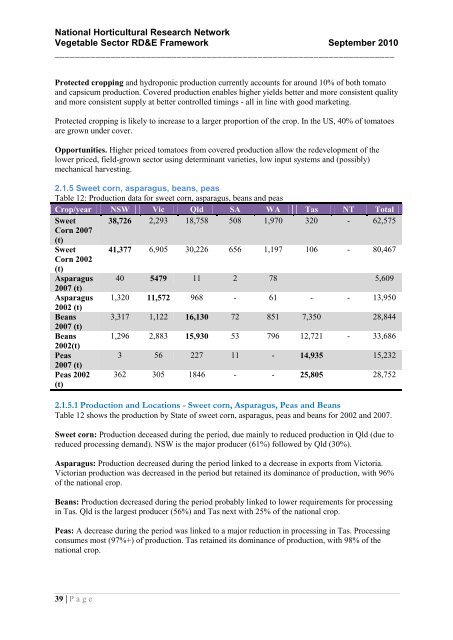
2.1.5 Sweet corn, asparagus, beans, peas<br />
Table 12: Production data for sweet corn, asparagus, beans and peas<br />
Crop/year NSW Vic Qld SA WA Tas NT Total<br />
Sweet 38,726 2,293 18,758 508 1,970 320 - 62,575<br />
Corn 2007<br />
(t)<br />
Sweet 41,377 6,905 30,226 656 1,197 106 - 80,467<br />
Corn 2002<br />
(t)<br />
Asparagus 40 5479 11 2 78 5,609<br />
2007 (t)<br />
Asparagus 1,320 11,572 968 - 61 - - 13,950<br />
2002 (t)<br />
Beans 3,317 1,122 16,130 72 851 7,350 28,844<br />
2007 (t)<br />
Beans 1,296 2,883 15,930 53 796 12,721 - 33,686<br />
2002(t)<br />
Peas<br />
3 56 227 11 - 14,935 15,232<br />
2007 (t)<br />
Peas 2002<br />
(t)<br />
362 305 1846 - - 25,805 28,752<br />
2.1.5.1 Production and Locations - Sweet corn, Asparagus, Peas and Beans<br />
Table 12 shows the production by State of sweet corn, asparagus, peas and beans for 2002 and 2007.<br />
Sweet corn: Production deceased during the period, due mainly to reduced production in Qld (due to<br />
reduced processing demand). NSW is the major producer (61%) followed by Qld (30%).<br />
Asparagus: Production decreased during the period linked to a decrease in exports from Victoria.<br />
Victorian production was decreased in the period but retained its dominance of production, with 96%<br />
of the national crop.<br />
Beans: Production decreased during the period probably linked to lower requirements for processing<br />
in Tas. Qld is the largest producer (56%) and Tas next with 25% of the national crop.<br />
Peas: A decrease during the period was linked to a major reduction in processing in Tas. Processing<br />
consumes most (97%+) of production. Tas retained its dominance of production, with 98% of the<br />
national crop.<br />
39 | P a g e