National Horticultural Research Network - Horticulture Industry ...
National Horticultural Research Network - Horticulture Industry ...
National Horticultural Research Network - Horticulture Industry ...

Create successful ePaper yourself
Turn your PDF publications into a flip-book with our unique Google optimized e-Paper software.
<strong>National</strong> <strong>Horticultural</strong> <strong>Research</strong> <strong>Network</strong><br />
Fruit Sector RD&E Framework September 2010<br />
____________________________________________________________________________________________________<br />
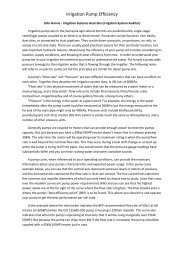
1.2 RD&E Resources and Capability - 2008/09<br />
This section presents an analysis of the extent and source of RD&E resources available to the fruit sector from PISC agencies. The university sector also has<br />
RD&E capabilities and invests in horticulture RD&E, but with the exception of the University of Tasmania in its joint venture, the resource applied to<br />
horticultural RD&E by the university sector are captured elsewhere (Chapter 5).<br />
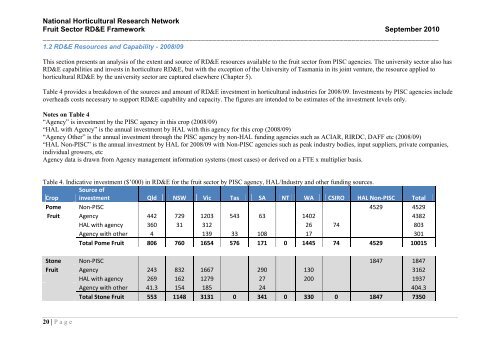
Table 4 provides a breakdown of the sources and amount of RD&E investment in horticultural industries for 2008/09. Investments by PISC agencies include<br />
overheads costs necessary to support RD&E capability and capacity. The figures are intended to be estimates of the investment levels only.<br />
Notes on Table 4<br />
“Agency” is investment by the PISC agency in this crop (2008/09)<br />
“HAL with Agency” is the annual investment by HAL with this agency for this crop (2008/09)<br />
“Agency Other” is the annual investment through the PISC agency by non-HAL funding agencies such as ACIAR, RIRDC, DAFF etc (2008/09)<br />
“HAL Non-PISC” is the annual investment by HAL for 2008/09 with Non-PISC agencies such as peak industry bodies, input suppliers, private companies,<br />
individual growers, etc<br />
Agency data is drawn from Agency management information systems (most cases) or derived on a FTE x multiplier basis.<br />
Table 4. Indicative investment ($‟000) in RD&E for the fruit sector by PISC agency, HAL/<strong>Industry</strong> and other funding sources.<br />
Source of<br />
Crop investment Qld NSW Vic Tas SA NT WA CSIRO HAL Non-PISC Total<br />
Pome Non-PISC 4529 4529<br />
Fruit Agency 442 729 1203 543 63 1402 4382<br />
HAL with agency 360 31 312 26 74 803<br />
Agency with other 4 139 33 108 17 301<br />
Total Pome Fruit 806 760 1654 576 171 0 1445 74 4529 10015<br />
Stone Non-PISC 1847 1847<br />
Fruit Agency 243 832 1667 290 130 3162<br />
HAL with agency 269 162 1279 27 200 1937<br />
Agency with other 41.3 154 185 24 404.3<br />
Total Stone Fruit 553 1148 3131 0 341 0 330 0 1847 7350<br />
20 | P a g e