National Horticultural Research Network - Horticulture Industry ...
National Horticultural Research Network - Horticulture Industry ...
National Horticultural Research Network - Horticulture Industry ...

Create successful ePaper yourself
Turn your PDF publications into a flip-book with our unique Google optimized e-Paper software.
<strong>National</strong> <strong>Horticultural</strong> <strong>Research</strong> <strong>Network</strong><br />
Vegetable Sector RD&E Framework September 2010<br />
___________________________________________________________________<br />
2.1.2.2 <strong>Industry</strong> Outlook and Drivers - Brassica vegetables<br />
In contrast to the Leafy and Asian vegetables, production trends indicate a mature domestic market<br />
for each of these crops. Loss of export markets has impacted upon cauliflower production in WA.<br />
These may be able to be regained if the AU$ returns to around US$0.70.<br />
The main issue for these crops is competitiveness against both fresh and frozen imports, requiring an<br />
increase in productivity. In the five years to 30 June 2007, total fresh and chilled Brassica vegetable<br />
imports grew by 86% to $41.4 million per annum, representing 18% of total industry value. The<br />
future demand for broccoli could be expected to be boosted by new generation phyto-nutrient<br />
products through the Vital Vegetables program and other initiatives.<br />
Strategies: include reduction in the cost of production to increase competitiveness against imports<br />
(primarily by mechanisation), and to regain export markets through the development of value added<br />
and differentiated products such as the Vital Vegetables program.<br />
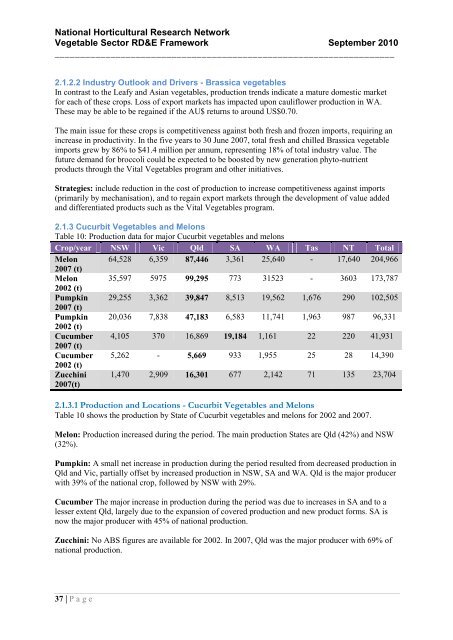
2.1.3 Cucurbit Vegetables and Melons<br />
Table 10: Production data for major Cucurbit vegetables and melons<br />
Crop/year NSW Vic Qld SA WA Tas NT Total<br />
Melon 64,528 6,359 87,446 3,361 25,640 - 17,640 204,966<br />
2007 (t)<br />
Melon 35,597 5975 99,295 773 31523 - 3603 173,787<br />
2002 (t)<br />
Pumpkin 29,255 3,362 39,847 8,513 19,562 1,676 290 102,505<br />
2007 (t)<br />
Pumpkin 20,036 7,838 47,183 6,583 11,741 1,963 987 96,331<br />
2002 (t)<br />
Cucumber 4,105 370 16,869 19,184 1,161 22 220 41,931<br />
2007 (t)<br />
Cucumber 5,262 - 5,669 933 1,955 25 28 14,390<br />
2002 (t)<br />
Zucchini<br />
2007(t)<br />
1,470 2,909 16,301 677 2,142 71 135 23,704<br />
2.1.3.1 Production and Locations - Cucurbit Vegetables and Melons<br />
Table 10 shows the production by State of Cucurbit vegetables and melons for 2002 and 2007.<br />
Melon: Production increased during the period. The main production States are Qld (42%) and NSW<br />
(32%).<br />
Pumpkin: A small net increase in production during the period resulted from decreased production in<br />
Qld and Vic, partially offset by increased production in NSW, SA and WA. Qld is the major producer<br />
with 39% of the national crop, followed by NSW with 29%.<br />
Cucumber The major increase in production during the period was due to increases in SA and to a<br />
lesser extent Qld, largely due to the expansion of covered production and new product forms. SA is<br />
now the major producer with 45% of national production.<br />
Zucchini: No ABS figures are available for 2002. In 2007, Qld was the major producer with 69% of<br />
national production.<br />
37 | P a g e