National Horticultural Research Network - Horticulture Industry ...
National Horticultural Research Network - Horticulture Industry ...
National Horticultural Research Network - Horticulture Industry ...

You also want an ePaper? Increase the reach of your titles
YUMPU automatically turns print PDFs into web optimized ePapers that Google loves.
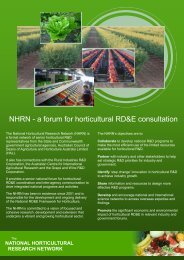
<strong>National</strong> <strong>Horticultural</strong> <strong>Research</strong> <strong>Network</strong><br />
Vegetable Sector RD&E Framework September 2010<br />
___________________________________________________________________<br />
2. Vegetable <strong>Industry</strong>. Situation and Outlook<br />
The industries covered by the vegetable sector can be grouped as follows:<br />
Leafy and Asian vegetables<br />
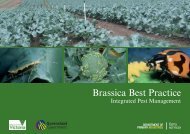
Major Brassica vegetables<br />
Cucurbit vegetables including melons<br />
Tomato and capsicum<br />
Sweet corn, asparagus, beans and peas<br />
Fresh and processing potatoes<br />
Carrots and onions<br />
Protected cropping<br />
ABS data (Cat7503.0, 2007/08) give the value of vegetable production in Australia and the various<br />
states as follows<br />
2008/09 NSW Vic Qld SA WA Tas NT Total<br />
$million 423 763 995 584 345 236 15 3,363<br />
2.1 Situation and Outlook<br />
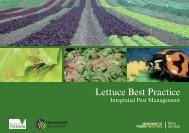
2.1.1 Leafy and Asian Vegetables<br />
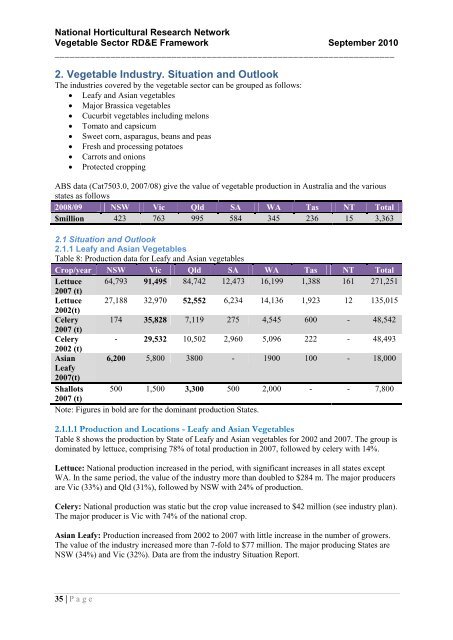
Table 8: Production data for Leafy and Asian vegetables<br />
Crop/year NSW Vic Qld SA WA Tas NT Total<br />
Lettuce 64,793 91,495 84,742 12,473 16,199 1,388 161 271,251<br />
2007 (t)<br />
Lettuce 27,188 32,970 52,552 6,234 14,136 1,923 12 135,015<br />
2002(t)<br />
Celery 174 35,828 7,119 275 4,545 600 - 48,542<br />
2007 (t)<br />
Celery - 29,532 10,502 2,960 5,096 222 - 48,493<br />
2002 (t)<br />
Asian 6,200 5,800 3800 - 1900 100 - 18,000<br />
Leafy<br />
2007(t)<br />
Shallots 500 1,500 3,300 500 2,000 - - 7,800<br />
2007 (t)<br />
Note: Figures in bold are for the dominant production States.<br />
2.1.1.1 Production and Locations - Leafy and Asian Vegetables<br />
Table 8 shows the production by State of Leafy and Asian vegetables for 2002 and 2007. The group is<br />
dominated by lettuce, comprising 78% of total production in 2007, followed by celery with 14%.<br />
Lettuce: <strong>National</strong> production increased in the period, with significant increases in all states except<br />
WA. In the same period, the value of the industry more than doubled to $284 m. The major producers<br />
are Vic (33%) and Qld (31%), followed by NSW with 24% of production.<br />
Celery: <strong>National</strong> production was static but the crop value increased to $42 million (see industry plan).<br />
The major producer is Vic with 74% of the national crop.<br />
Asian Leafy: Production increased from 2002 to 2007 with little increase in the number of growers.<br />
The value of the industry increased more than 7-fold to $77 million. The major producing States are<br />
NSW (34%) and Vic (32%). Data are from the industry Situation Report.<br />
35 | P a g e