National Horticultural Research Network - Horticulture Industry ...
National Horticultural Research Network - Horticulture Industry ...
National Horticultural Research Network - Horticulture Industry ...

You also want an ePaper? Increase the reach of your titles
YUMPU automatically turns print PDFs into web optimized ePapers that Google loves.
<strong>National</strong> <strong>Horticultural</strong> <strong>Research</strong> <strong>Network</strong><br />
Lifestyle Sector RD&E Framework September 2010<br />
___________________________________________________________________<br />
being of the Australian population, climate change mitigation and economic prosperity of the<br />
Australian economy.<br />
3.3 Situation and Outlook<br />
The industries covered by the lifestyle sector include cut flowers, turf and nursery/garden. Statistics<br />
for these industries are notoriously difficult to obtain so the industry based estimates, extracted from<br />
the industry Situation Reports have been used as well as data from the Australian Bureau of Statistics<br />
(www.abs.gov.au).<br />
3.3.1 Nursery and Garden<br />
The latest available Garden Market Monitor (published by the Nursery and Garden <strong>Industry</strong> of<br />
Australia) lists national green life (only) sales of at least $2.4 billion annually. The latest figures from<br />
Queensland (the most recent State figures) value the production sector at $639 million for that State<br />
alone.<br />
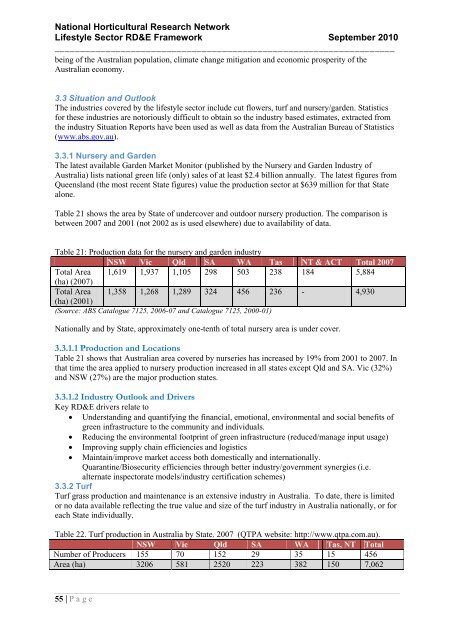
Table 21 shows the area by State of undercover and outdoor nursery production. The comparison is<br />
between 2007 and 2001 (not 2002 as is used elsewhere) due to availability of data.<br />
Table 21: Production data for the nursery and garden industry<br />
NSW Vic Qld SA WA Tas NT & ACT Total 2007<br />
Total Area 1,619 1,937 1,105 298 503 238 184 5,884<br />
(ha) (2007)<br />
Total Area 1,358 1,268 1,289 324 456 236 - 4,930<br />
(ha) (2001)<br />
(Source: ABS Catalogue 7125, 2006-07 and Catalogue 7125, 2000-01)<br />
<strong>National</strong>ly and by State, approximately one-tenth of total nursery area is under cover.<br />
3.3.1.1 Production and Locations<br />
Table 21 shows that Australian area covered by nurseries has increased by 19% from 2001 to 2007. In<br />
that time the area applied to nursery production increased in all states except Qld and SA. Vic (32%)<br />
and NSW (27%) are the major production states.<br />
3.3.1.2 <strong>Industry</strong> Outlook and Drivers<br />
Key RD&E drivers relate to<br />
Understanding and quantifying the financial, emotional, environmental and social benefits of<br />
green infrastructure to the community and individuals.<br />
Reducing the environmental footprint of green infrastructure (reduced/manage input usage)<br />
Improving supply chain efficiencies and logistics<br />
Maintain/improve market access both domestically and internationally.<br />
Quarantine/Biosecurity efficiencies through better industry/government synergies (i.e.<br />
alternate inspectorate models/industry certification schemes)<br />
3.3.2 Turf<br />
Turf grass production and maintenance is an extensive industry in Australia. To date, there is limited<br />
or no data available reflecting the true value and size of the turf industry in Australia nationally, or for<br />
each State individually.<br />
Table 22. Turf production in Australia by State. 2007 (QTPA website: http://www.qtpa.com.au).<br />
NSW Vic Qld SA WA Tas, NT Total<br />
Number of Producers 155 70 152 29 35 15 456<br />
Area (ha) 3206 581 2520 223 382 150 7,062<br />
55 | P a g e