National Horticultural Research Network - Horticulture Industry ...
National Horticultural Research Network - Horticulture Industry ...
National Horticultural Research Network - Horticulture Industry ...

Create successful ePaper yourself
Turn your PDF publications into a flip-book with our unique Google optimized e-Paper software.
<strong>National</strong> <strong>Horticultural</strong> <strong>Research</strong> <strong>Network</strong><br />
Vegetable Sector RD&E Framework September 2010<br />
_____________________________________________________________________________________________________<br />
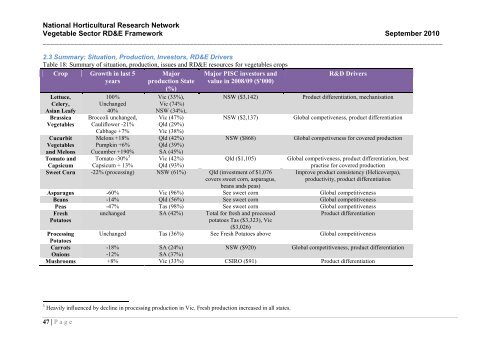
2.3 Summary: Situation, Production, Investors, RD&E Drivers<br />
Table 18: Summary of situation, production, issues and RD&E resources for vegetables crops<br />
Crop Growth in last 5<br />
years<br />
Major<br />
production State<br />
(%)<br />
Major PISC investors and<br />
value in 2008/09 ($’000)<br />
Lettuce,<br />
Celery,<br />
Asian Leafy<br />
Brassica<br />
Vegetables<br />
Cucurbit<br />
Vegetables<br />
and Melons<br />
Tomato and<br />
100%<br />
Unchanged<br />
40%<br />
Broccoli unchanged,<br />
Cauliflower -21%<br />
Cabbage +7%<br />
Melons +18%<br />
Pumpkin +6%<br />
Cucumber +190%<br />
Tomato -30% 3<br />
Vic (33%),<br />
Vic (74%)<br />
NSW (34%),<br />
Vic (47%)<br />
Qld (29%)<br />
Vic (38%)<br />
Qld (42%)<br />
Qld (39%)<br />
SA (45%)<br />
Vic (42%)<br />
NSW ($3,142)<br />
NSW ($2,137)<br />
NSW ($868)<br />
Qld ($1,105)<br />
Capsicum Capsicum + 13% Qld (93%)<br />
Sweet Corn -22% (processing) NSW (61%) Qld (investment of $1,076<br />
covers sweet corn, asparagus,<br />
beans ands peas)<br />
R&D Drivers<br />
Product differentiation, mechanisation<br />
Global competiveness, product differentiation<br />
Global competiveness for covered production<br />
Global competiveness, product differentiation, best<br />
practise for covered production<br />
Improve product consistency (Helicoverpa),<br />
productivity, product differentiation<br />
Asparagus -60% Vic (96%) See sweet corn Global competitiveness<br />
Beans -14% Qld (56%) See sweet corn Global competitiveness<br />
Peas -47% Tas (98%) See sweet corn Global competitiveness<br />
Fresh<br />
Potatoes<br />
unchanged SA (42%) Total for fresh and processed<br />
potatoes Tas ($3,323), Vic<br />
($3,026)<br />
Product differentiation<br />
Processing Unchanged Tas (36%) See Fresh Potatoes above Global competitiveness<br />
Potatoes<br />
Carrots<br />
-18%<br />
SA (24%)<br />
NSW ($920)<br />
Global competitiveness, product differentiation<br />
Onions<br />
-12%<br />
SA (37%)<br />
Mushrooms +8% Vic (33%) CSIRO ($91) Product differentiation<br />
3 Heavily influenced by decline in processing production in Vic. Fresh production increased in all states.<br />
47 | P a g e