National Horticultural Research Network - Horticulture Industry ...
National Horticultural Research Network - Horticulture Industry ...
National Horticultural Research Network - Horticulture Industry ...

Create successful ePaper yourself
Turn your PDF publications into a flip-book with our unique Google optimized e-Paper software.
<strong>National</strong> <strong>Horticultural</strong> <strong>Research</strong> <strong>Network</strong><br />
Vegetable Sector RD&E Framework September 2010<br />
___________________________________________________________________<br />
Processing: The major producer is Tas (36%) followed by Vic (25%)<br />
2.1.6.2 <strong>Industry</strong> Outlook and Drivers - Fresh and Processing Potatoes<br />
Fresh: This is a mature industry that has struggled to maintain its market share against other sources<br />
of starch such as pasta and rice. Key drivers are factors for improving production efficiency (e.g.<br />
disease management, irrigation) and preventing incursions from exotic pests and diseases.<br />
Opportunities exist for product differentiation through starch manipulation leading to low GI starch<br />
(breeding and biotechnology). Consumer preference for washed potatoes (rather than brushed) has<br />
driven a move to production in sandy soils (particularly SA).<br />
An interesting development has been the investment in fresh potato breeding by fresh potato supply<br />
chains, indicating a perceived market for differentiated products.<br />
Processing: Productivity gains are needed to combat overseas imports, including improving<br />
efficiency (e.g. disease management in processing potatoes) and preventing incursions from exotic<br />
pests and diseases.<br />
2.1.7 Carrots and Onions<br />
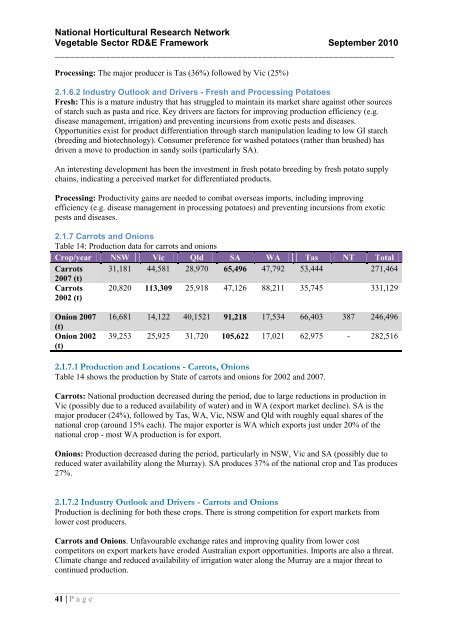
Table 14: Production data for carrots and onions<br />
Crop/year NSW Vic Qld SA WA Tas NT Total<br />
Carrots 31,181 44,581 28,970 65,496 47,792 53,444 271,464<br />
2007 (t)<br />
Carrots<br />
2002 (t)<br />
20,820 113,309 25,918 47,126 88,211 35,745 331,129<br />
Onion 2007<br />
(t)<br />
Onion 2002<br />
(t)<br />
16,681 14,122 40,1521 91,218 17,534 66,403 387 246,496<br />
39,253 25,925 31,720 105,622 17,021 62,975 - 282,516<br />
2.1.7.1 Production and Locations - Carrots, Onions<br />
Table 14 shows the production by State of carrots and onions for 2002 and 2007.<br />
Carrots: <strong>National</strong> production decreased during the period, due to large reductions in production in<br />
Vic (possibly due to a reduced availability of water) and in WA (export market decline). SA is the<br />
major producer (24%), followed by Tas, WA, Vic, NSW and Qld with roughly equal shares of the<br />
national crop (around 15% each). The major exporter is WA which exports just under 20% of the<br />
national crop - most WA production is for export.<br />
Onions: Production decreased during the period, particularly in NSW, Vic and SA (possibly due to<br />
reduced water availability along the Murray). SA produces 37% of the national crop and Tas produces<br />
27%.<br />
2.1.7.2 <strong>Industry</strong> Outlook and Drivers - Carrots and Onions<br />
Production is declining for both these crops. There is strong competition for export markets from<br />
lower cost producers.<br />
Carrots and Onions. Unfavourable exchange rates and improving quality from lower cost<br />
competitors on export markets have eroded Australian export opportunities. Imports are also a threat.<br />
Climate change and reduced availability of irrigation water along the Murray are a major threat to<br />
continued production.<br />
41 | P a g e