Latvia
Latvia
Latvia
Create successful ePaper yourself
Turn your PDF publications into a flip-book with our unique Google optimized e-Paper software.
Health systems in transition<br />
<strong>Latvia</strong><br />
Figures<br />
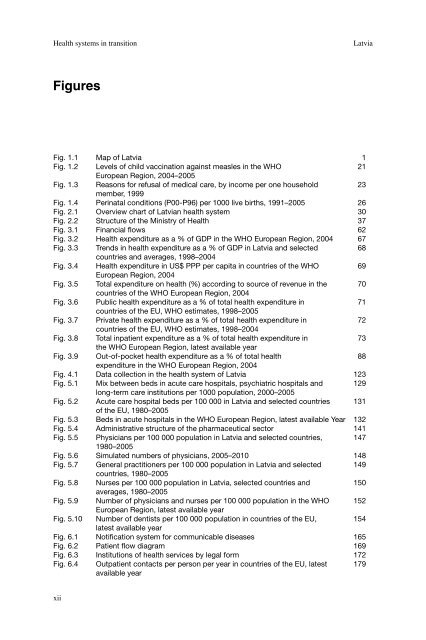
Fig. 1.1 Map of <strong>Latvia</strong> 1<br />
Fig. 1.2 Levels of child vaccination against measles in the WHO 21<br />
European Region, 2004–2005<br />
Fig. 1.3 Reasons for refusal of medical care, by income per one household 23<br />
member, 1999<br />
Fig. 1.4 Perinatal conditions (P00-P96) per 1000 live births, 1991–2005 26<br />
Fig. 2.1 Overview chart of <strong>Latvia</strong>n health system 30<br />
Fig. 2.2 Structure of the Ministry of Health 37<br />
Fig. 3.1 Financial flows 62<br />
Fig. 3.2 Health expenditure as a % of GDP in the WHO European Region, 2004 67<br />
Fig. 3.3 Trends in health expenditure as a % of GDP in <strong>Latvia</strong> and selected 68<br />
countries and averages, 1998–2004<br />
Fig. 3.4 Health expenditure in US$ PPP per capita in countries of the WHO 69<br />
European Region, 2004<br />
Fig. 3.5 Total expenditure on health (%) according to source of revenue in the 70<br />
countries of the WHO European Region, 2004<br />
Fig. 3.6 Public health expenditure as a % of total health expenditure in 71<br />
countries of the EU, WHO estimates, 1998–2005<br />
Fig. 3.7 Private health expenditure as a % of total health expenditure in 72<br />
countries of the EU, WHO estimates, 1998–2004<br />
Fig. 3.8 Total inpatient expenditure as a % of total health expenditure in 73<br />
the WHO European Region, latest available year<br />
Fig. 3.9 Out-of-pocket health expenditure as a % of total health 88<br />
expenditure in the WHO European Region, 2004<br />
Fig. 4.1 Data collection in the health system of <strong>Latvia</strong> 123<br />
Fig. 5.1 Mix between beds in acute care hospitals, psychiatric hospitals and 129<br />
long-term care institutions per 1000 population, 2000–2005<br />
Fig. 5.2 Acute care hospital beds per 100 000 in <strong>Latvia</strong> and selected countries 131<br />
of the EU, 1980–2005<br />
Fig. 5.3 Beds in acute hospitals in the WHO European Region, latest available Year 132<br />
Fig. 5.4 Administrative structure of the pharmaceutical sector 141<br />
Fig. 5.5 Physicians per 100 000 population in <strong>Latvia</strong> and selected countries, 147<br />
1980–2005<br />
Fig. 5.6 Simulated numbers of physicians, 2005–2010 148<br />
Fig. 5.7 General practitioners per 100 000 population in <strong>Latvia</strong> and selected 149<br />
countries, 1980–2005<br />
Fig. 5.8 Nurses per 100 000 population in <strong>Latvia</strong>, selected countries and 150<br />
averages, 1980–2005<br />
Fig. 5.9 Number of physicians and nurses per 100 000 population in the WHO 152<br />
European Region, latest available year<br />
Fig. 5.10 Number of dentists per 100 000 population in countries of the EU, 154<br />
latest available year<br />
Fig. 6.1 Notification system for communicable diseases 165<br />
Fig. 6.2 Patient flow diagram 169<br />
Fig. 6.3 Institutions of health services by legal form 172<br />
Fig. 6.4 Outpatient contacts per person per year in countries of the EU, latest 179<br />
available year<br />
xii


