Latvia
Latvia
Latvia

You also want an ePaper? Increase the reach of your titles
YUMPU automatically turns print PDFs into web optimized ePapers that Google loves.
Health systems in transition<br />
<strong>Latvia</strong><br />
1.4 Health status<br />
Life expectancy and mortality<br />
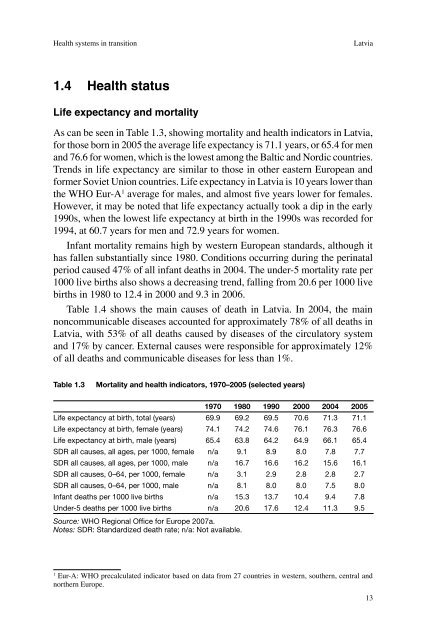
As can be seen in Table 1.3, showing mortality and health indicators in <strong>Latvia</strong>,<br />
for those born in 2005 the average life expectancy is 71.1 years, or 65.4 for men<br />
and 76.6 for women, which is the lowest among the Baltic and Nordic countries.<br />
Trends in life expectancy are similar to those in other eastern European and<br />
former Soviet Union countries. Life expectancy in <strong>Latvia</strong> is 10 years lower than<br />
the WHO Eur-A average for males, and almost five years lower for females.<br />
However, it may be noted that life expectancy actually took a dip in the early<br />
1990s, when the lowest life expectancy at birth in the 1990s was recorded for<br />
1994, at 60.7 years for men and 72.9 years for women.<br />
Infant mortality remains high by western European standards, although it<br />
has fallen substantially since 1980. Conditions occurring during the perinatal<br />
period caused 47% of all infant deaths in 2004. The under-5 mortality rate per<br />
1000 live births also shows a decreasing trend, falling from 20.6 per 1000 live<br />
births in 1980 to 12.4 in 2000 and 9.3 in 2006.<br />
Table 1.4 shows the main causes of death in <strong>Latvia</strong>. In 2004, the main<br />
noncommunicable diseases accounted for approximately 78% of all deaths in<br />
<strong>Latvia</strong>, with 53% of all deaths caused by diseases of the circulatory system<br />
and 17% by cancer. External causes were responsible for approximately 12%<br />
of all deaths and communicable diseases for less than 1%.<br />
Table 1.3<br />
Mortality and health indicators, 1970–2005 (selected years)<br />
1970 1980 1990 2000 2004 2005<br />
Life expectancy at birth, total (years) 69.9 69.2 69.5 70.6 71.3 71.1<br />
Life expectancy at birth, female (years) 74.1 74.2 74.6 76.1 76.3 76.6<br />
Life expectancy at birth, male (years) 65.4 63.8 64.2 64.9 66.1 65.4<br />
SDR all causes, all ages, per 1000, female n/a 9.1 8.9 8.0 7.8 7.7<br />
SDR all causes, all ages, per 1000, male n/a 16.7 16.6 16.2 15.6 16.1<br />
SDR all causes, 0–64, per 1000, female n/a 3.1 2.9 2.8 2.8 2.7<br />
SDR all causes, 0–64, per 1000, male n/a 8.1 8.0 8.0 7.5 8.0<br />
Infant deaths per 1000 live births n/a 15.3 13.7 10.4 9.4 7.8<br />
Under-5 deaths per 1000 live births n/a 20.6 17.6 12.4 11.3 9.5<br />
Source: WHO Regional Office for Europe 2007a.<br />
Notes: SDR: Standardized death rate; n/a: Not available.<br />
<br />
Eur-A: WHO precalculated indicator based on data from 27 countries in western, southern, central and<br />
northern Europe.<br />
13