Latvia
Latvia
Latvia

You also want an ePaper? Increase the reach of your titles
YUMPU automatically turns print PDFs into web optimized ePapers that Google loves.
Health systems in transition<br />
<strong>Latvia</strong><br />
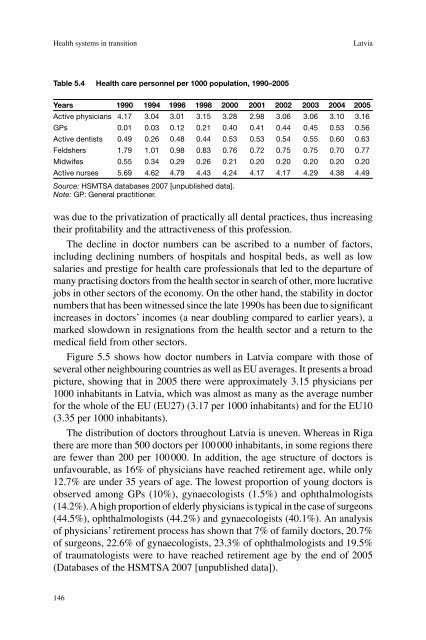
Table 5.4 Health care personnel per 1000 population, 1990–2005<br />
Years 1990 1994 1996 1998 2000 2001 2002 2003 2004 2005<br />
Active physicians 4.17 3.04 3.01 3.15 3.28 2.98 3.06 3.06 3.10 3.16<br />
GPs 0.01 0.03 0.12 0.21 0.40 0.41 0.44 0.45 0.53 0.56<br />
Active dentists 0.49 0.26 0.48 0.44 0.53 0.53 0.54 0.55 0.60 0.63<br />
Feldshers 1.79 1.01 0.98 0.83 0.76 0.72 0.75 0.75 0.70 0.77<br />
Midwifes 0.55 0.34 0.29 0.26 0.21 0.20 0.20 0.20 0.20 0.20<br />
Active nurses 5.69 4.62 4.79 4.43 4.24 4.17 4.17 4.29 4.38 4.49<br />
Source: HSMTSA databases 2007 [unpublished data].<br />
Note: GP: General practitioner.<br />
was due to the privatization of practically all dental practices, thus increasing<br />
their profitability and the attractiveness of this profession.<br />
The decline in doctor numbers can be ascribed to a number of factors,<br />
including declining numbers of hospitals and hospital beds, as well as low<br />
salaries and prestige for health care professionals that led to the departure of<br />
many practising doctors from the health sector in search of other, more lucrative<br />
jobs in other sectors of the economy. On the other hand, the stability in doctor<br />
numbers that has been witnessed since the late 1990s has been due to significant<br />
increases in doctors’ incomes (a near doubling compared to earlier years), a<br />
marked slowdown in resignations from the health sector and a return to the<br />
medical field from other sectors.<br />
Figure 5.5 shows how doctor numbers in <strong>Latvia</strong> compare with those of<br />
several other neighbouring countries as well as EU averages. It presents a broad<br />
picture, showing that in 2005 there were approximately 3.15 physicians per<br />
1000 inhabitants in <strong>Latvia</strong>, which was almost as many as the average number<br />
for the whole of the EU (EU27) (3.17 per 1000 inhabitants) and for the EU10<br />
(3.35 per 1000 inhabitants).<br />
The distribution of doctors throughout <strong>Latvia</strong> is uneven. Whereas in Riga<br />
there are more than 500 doctors per 100 000 inhabitants, in some regions there<br />
are fewer than 200 per 100 000. In addition, the age structure of doctors is<br />
unfavourable, as 16% of physicians have reached retirement age, while only<br />
12.7% are under 35 years of age. The lowest proportion of young doctors is<br />
observed among GPs (10%), gynaecologists (1.5%) and ophthalmologists<br />
(14.2%). A high proportion of elderly physicians is typical in the case of surgeons<br />
(44.5%), ophthalmologists (44.2%) and gynaecologists (40.1%). An analysis<br />
of physicians’ retirement process has shown that 7% of family doctors, 20.7%<br />
of surgeons, 22.6% of gynaecologists, 23.3% of ophthalmologists and 19.5%<br />
of traumatologists were to have reached retirement age by the end of 2005<br />
(Databases of the HSMTSA 2007 [unpublished data]).<br />
146