Annual Report 2012 - Fingrid
Annual Report 2012 - Fingrid
Annual Report 2012 - Fingrid

Create successful ePaper yourself
Turn your PDF publications into a flip-book with our unique Google optimized e-Paper software.
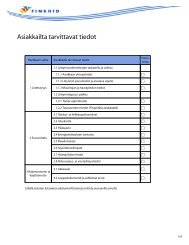
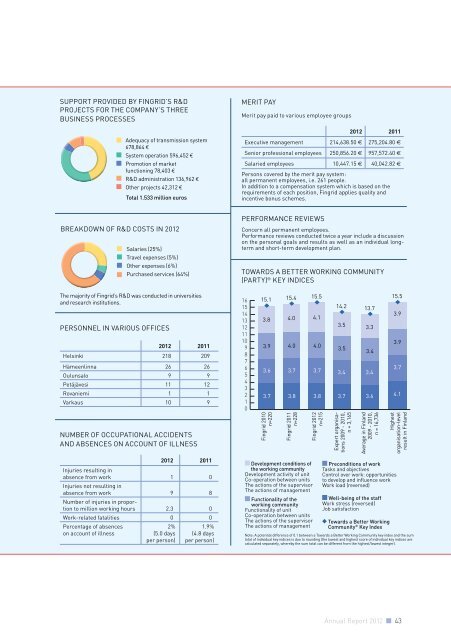
SUPPORT PROVIDED BY FINGRID’S R&D<br />
PROJECTS FOR THE COMPANY’S THREE<br />
BUSINESS PROCESSES<br />
Adequacy of transmission system<br />
678,864 €<br />
System operation 596,452 €<br />
Promotion of market<br />
functioning 78,403 €<br />
R&D administration 136,962 €<br />
Other projects 42,312 €<br />
Total 1.533 million euros<br />
MERIT PAY<br />
Merit pay paid to various employee groups<br />
<strong>2012</strong> 2011<br />
Executive management 214,638.50 € 275,204.80 €<br />
Senior professional employees 250,856.20 € 957,572.40 €<br />
Salaried employees 10,447.15 € 40,042.82 €<br />
Persons covered by the merit pay system:<br />
all permanent employees, i.e. 261 people.<br />
In addition to a compensation system which is based on the<br />
requirements of each position, <strong>Fingrid</strong> applies quality and<br />
incentive bonus schemes.<br />
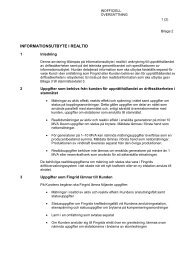
BREAKDOWN OF R&D COSTS IN <strong>2012</strong><br />
Salaries (25%)<br />
Travel expenses (5%)<br />
Other expenses (6%)<br />
Purchased services (64%)<br />
PERFORMANCE REVIEWS<br />
Concern all permanent employees.<br />
Performance reviews conducted twice a year include a discussion<br />
on the personal goals and results as well as an individual longterm<br />
and short-term development plan.<br />
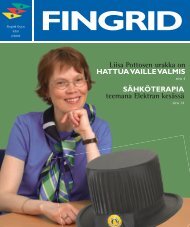
TOWARDS A BETTER WORKING COMMUNITY<br />
(PARTY) ® KEY INDICES<br />
The majority of <strong>Fingrid</strong>’s R&D was conducted in universities<br />
and research institutions.<br />
PERSONNEL IN VARIOUS OFFICES<br />
<strong>2012</strong> 2011<br />
Helsinki 218 209<br />
Hämeenlinna 26 26<br />
Oulunsalo 9 9<br />
Petäjävesi 11 12<br />
Rovaniemi 1 1<br />
Varkaus 10 9<br />
16<br />
15<br />
14<br />
13<br />
12<br />
11<br />
10<br />
9<br />
8<br />
7<br />
6<br />
5<br />
4<br />
3<br />
2<br />
1<br />
0<br />
15.1<br />
3.8<br />
3.9<br />
3.6<br />
3.7<br />
15.4 15.5<br />
4.0 4.1<br />
4.0 4.0<br />
3.7 3.7<br />
3.8 3.8<br />
14.2<br />
3.5<br />
3.5<br />
3.4<br />
3.7<br />
13.7<br />
3.3<br />
3.4<br />
3.4<br />
3.6<br />
15.5<br />
3.9<br />
3.9<br />
3.7<br />
4.1<br />
NUMBER OF OCCUPATIONAL ACCIDENTS<br />
AND ABSENCES ON ACCOUNT OF ILLNESS<br />
<strong>Fingrid</strong> 2010<br />
n=220<br />
<strong>Fingrid</strong> 2011<br />
n=228<br />
<strong>Fingrid</strong> <strong>2012</strong><br />
n=215<br />
Expert organisations<br />
2009 - 2010,<br />
n = 3,165<br />
Average in Finland<br />
2009 - 2010,<br />
n = 16,736<br />
Highest<br />
organisation-level<br />
result in Finland<br />
<strong>2012</strong> 2011<br />
Injuries resulting in<br />
absence from work 1 0<br />
Injuries not resulting in<br />
absence from work 9 8<br />
Number of injuries in proportion<br />
to million working hours 2.3 0<br />
Work-related fatalities 0 0<br />
Percentage of absences<br />
on account of illness<br />
2%<br />
(5.0 days<br />
per person)<br />
1.9%<br />
(4.8 days<br />
per person)<br />
Development conditions of<br />
the working community<br />
Development activity of unit<br />
Co-operation between units<br />
The actions of the supervisor<br />
The actions of management<br />
Functionality of the<br />
working community<br />
Functionality of unit<br />
Co-operation between units<br />
The actions of the supervisor<br />
The actions of management<br />
Preconditions of work<br />
Tasks and objectives<br />
Control over work: opportunities<br />
to develop and influence work<br />
Work load (reversed)<br />
Well-being of the staff<br />
Work stress (reversed)<br />
Job satisfaction<br />
Towards a Better Working<br />
Community ® Key Index<br />
Note: A potential difference of 0.1 between a Towards a Better Working Community key index and the sum<br />
total of individual key indices is due to rounding (the lowest and highest score of individual key indices are<br />
calculated separately, whereby the sum total can be different from the highest/lowest integer).<br />
<strong>Annual</strong> <strong>Report</strong> <strong>2012</strong> 43