

Market Economics | Interest Rate Strategy - BNP PARIBAS ...
Market Economics | Interest Rate Strategy - BNP PARIBAS ...
Market Economics | Interest Rate Strategy - BNP PARIBAS ...

You also want an ePaper? Increase the reach of your titles
YUMPU automatically turns print PDFs into web optimized ePapers that Google loves.
flattening in a rally and steepening in a sell-off. That<br />
is not so much the case for 5s10s, as this spread<br />
shows little directionality (Chart 1). This, combined<br />
with other factors, leads us to favor the 10y sector<br />
along the curve (see “Treasury Curve and Fly<br />
Opportunities” in this <strong>Market</strong> Mover for more details).<br />
We express this view through a 5s10s flattener. We<br />
started to scale into this position at 138.5bp.<br />
Next we turn to allocation among various products<br />
within rates.<br />
Mortgages look fair but are likely to continue to<br />
perform well<br />
With the majority of convexity selling done, we turned<br />
overweight on mortgages as convexity hedging in the<br />
sell-off left mortgages cheap. Since then, lower<br />
coupon mortgages have tightened especially on a<br />
nominal basis, while not as much on an OAS basis<br />
since the decline in volatility has kept OASs in check.<br />
While our regression shows mortgages are fair at this<br />
point (Chart 2), we continue to remain overweight as<br />
we expect new origination to be low as the majority<br />
of the refinanceable universe is now out-of-money.<br />
Despite an increase over the past two weeks, the<br />
refinancing index is still about 60% below the highs<br />
of 2010 and is at the lower end of the series over the<br />
past couple years (Chart 3). Lower refinancing<br />
signals slower prepayments, which was confirmed<br />
with December’s prepayment report, in which speeds<br />
were around 5% slower. Over the next couple of<br />
months, we expect speeds to decline by another<br />
50%. Refinancing accounted for around 80% of new<br />
origination in 2010, so lower refinancing activity<br />
should cause a drop in origination, which should in<br />
turn be supportive of the basis.<br />
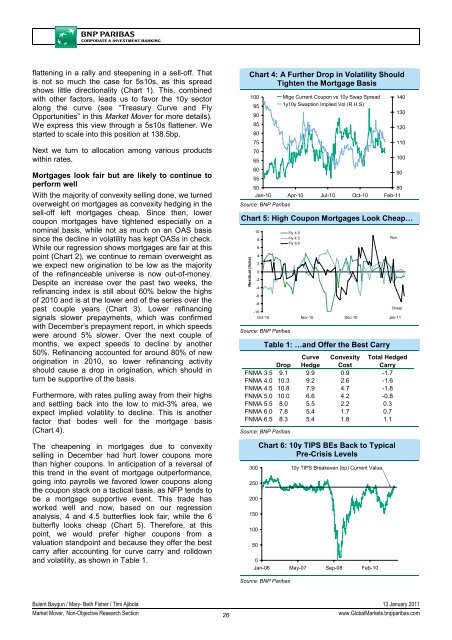
Furthermore, with rates pulling away from their highs<br />
and settling back into the low to mid-3% area, we<br />
expect implied volatility to decline. This is another<br />
factor that bodes well for the mortgage basis<br />
(Chart 4).<br />
The cheapening in mortgages due to convexity<br />
selling in December had hurt lower coupons more<br />
than higher coupons. In anticipation of a reversal of<br />
this trend in the event of mortgage outperformance,<br />
going into payrolls we favored lower coupons along<br />
the coupon stack on a tactical basis, as NFP tends to<br />
be a mortgage supportive event. This trade has<br />
worked well and now, based on our regression<br />
analysis, 4 and 4.5 butterflies look fair, while the 6<br />
butterfly looks cheap (Chart 5). Therefore, at this<br />
point, we would prefer higher coupons from a<br />
valuation standpoint and because they offer the best<br />
carry after accounting for curve carry and rolldown<br />
and volatility, as shown in Table 1.<br />
Chart 4: A Further Drop in Volatility Should<br />
Tighten the Mortgage Basis<br />
100<br />
95<br />
Mtge Current Coupon vs 10y Swap Spread<br />
1y10y Swaption Implied Vol (R.H.S)<br />
140<br />
90<br />
130<br />
85<br />
120<br />
80<br />
75<br />
110<br />
70<br />
65<br />
100<br />
60<br />
90<br />
55<br />
50<br />
80<br />
Jan-10 Apr-10 Jul-10 Oct-10 Feb-11<br />
Source: <strong>BNP</strong> Paribas<br />
Chart 5: High Coupon Mortgages Look Cheap…<br />
Residual (ticks)<br />
10<br />
8<br />
6<br />
4<br />
2<br />
0<br />
-2<br />
-4<br />
-6<br />
Fly 4.0<br />
Fly 4.5<br />
Fly 6.0<br />
-8<br />
Cheap<br />
-10<br />
Oct-10 Nov-10 Dec-10 Jan-11<br />
Source: <strong>BNP</strong> Paribas<br />
Table 1: …and Offer the Best Carry<br />
Drop<br />
Curve<br />
Hedge<br />
Convexity<br />
Cost<br />
Total Hedged<br />
Carry<br />
FNMA 3.5 9.1 9.9 0.9 -1.7<br />
FNMA 4.0 10.3 9.2 2.6 -1.6<br />
FNMA 4.5 10.8 7.9 4.7 -1.8<br />
FNMA 5.0 10.0 6.6 4.2 -0.8<br />
FNMA 5.5 8.0 5.5 2.2 0.3<br />
FNMA 6.0 7.8 5.4 1.7 0.7<br />
FNMA 6.5 8.3 5.4 1.8 1.1<br />
Source: <strong>BNP</strong> Paribas<br />
300<br />
250<br />
200<br />
150<br />
100<br />
50<br />
Chart 6: 10y TIPS BEs Back to Typical<br />
Pre-Crisis Levels<br />
10y TIPS Breakeven (bp) Current Value<br />
0<br />
Jan-06 May-07 Sep-08 Feb-10<br />
Rich<br />
Source: <strong>BNP</strong> Paribas<br />
Bulent Baygun / Mary- Beth Fisher / Timi Ajibola 13 January 2011<br />
<strong>Market</strong> Mover, Non-Objective Research Section<br />
26<br />
www.Global<strong>Market</strong>s.bnpparibas.com


