

Market Mover - BNP PARIBAS - Investment Services India
Market Mover - BNP PARIBAS - Investment Services India
Market Mover - BNP PARIBAS - Investment Services India

You also want an ePaper? Increase the reach of your titles
YUMPU automatically turns print PDFs into web optimized ePapers that Google loves.
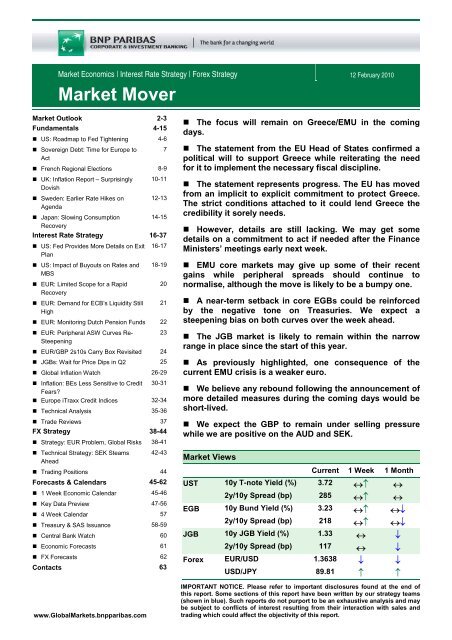
<strong>Market</strong> Economics | Interest Rate Strategy | Forex Strategy 12 February 2010<br />
<strong>Market</strong> <strong>Mover</strong><br />
<strong>Market</strong> Outlook 2-3<br />
Fundamentals 4-15<br />
• US: Roadmap to Fed Tightening 4-6<br />
• Sovereign Debt: Time for Europe to 7<br />
Act<br />
• French Regional Elections 8-9<br />
• UK: Inflation Report – Surprisingly 10-11<br />
Dovish<br />
• Sweden: Earlier Rate Hikes on 12-13<br />
Agenda<br />
• Japan: Slowing Consumption<br />
14-15<br />
Recovery<br />
Interest Rate Strategy 16-37<br />
• US: Fed Provides More Details on Exit 16-17<br />
Plan<br />
• US: Impact of Buyouts on Rates and 18-19<br />
MBS<br />
• EUR: Limited Scope for a Rapid<br />
20<br />
Recovery<br />
• EUR: Demand for ECB’s Liquidity Still 21<br />
High<br />
• EUR: Monitoring Dutch Pension Funds 22<br />
• EUR: Peripheral ASW Curves Re- 23<br />
Steepening<br />
• EUR/GBP 2s10s Carry Box Revisited 24<br />
• JGBs: Wait for Price Dips in Q2 25<br />
• Global Inflation Watch 26-29<br />
• Inflation: BEs Less Sensitive to Credit 30-31<br />
Fears?<br />
• Europe iTraxx Credit Indices 32-34<br />
• Technical Analysis 35-36<br />
• Trade Reviews 37<br />
FX Strategy 38-44<br />
• Strategy: EUR Problem, Global Risks 38-41<br />
• Technical Strategy: SEK Steams 42-43<br />
Ahead<br />
• Trading Positions 44<br />
Forecasts & Calendars 45-62<br />
• 1 Week Economic Calendar 45-46<br />
• Key Data Preview 47-56<br />
• 4 Week Calendar 57<br />
• Treasury & SAS Issuance 58-59<br />
• Central Bank Watch 60<br />
• Economic Forecasts 61<br />
• FX Forecasts 62<br />
Contacts 63<br />
www.Global<strong>Market</strong>s.bnpparibas.com<br />
• The focus will remain on Greece/EMU in the coming<br />
days.<br />
• The statement from the EU Head of States confirmed a<br />
political will to support Greece while reiterating the need<br />
for it to implement the necessary fiscal discipline.<br />
• The statement represents progress. The EU has moved<br />
from an implicit to explicit commitment to protect Greece.<br />
The strict conditions attached to it could lend Greece the<br />
credibility it sorely needs.<br />
• However, details are still lacking. We may get some<br />
details on a commitment to act if needed after the Finance<br />
Ministers’ meetings early next week.<br />
• EMU core markets may give up some of their recent<br />
gains while peripheral spreads should continue to<br />
normalise, although the move is likely to be a bumpy one.<br />
• A near-term setback in core EGBs could be reinforced<br />
by the negative tone on Treasuries. We expect a<br />
steepening bias on both curves over the week ahead.<br />
• The JGB market is likely to remain within the narrow<br />
range in place since the start of this year.<br />
• As previously highlighted, one consequence of the<br />
current EMU crisis is a weaker euro.<br />
• We believe any rebound following the announcement of<br />
more detailed measures during the coming days would be<br />
short-lived.<br />
• We expect the GBP to remain under selling pressure<br />
while we are positive on the AUD and SEK.<br />
<strong>Market</strong> Views<br />
Current 1 Week 1 Month<br />
UST 10y T-note Yield (%) 3.72 ↔↑ ↔<br />
2y/10y Spread (bp) 285 ↔↑ ↔<br />
EGB 10y Bund Yield (%) 3.23 ↔↑ ↔↓<br />
2y/10y Spread (bp) 218 ↔↑ ↔↓<br />
JGB 10y JGB Yield (%) 1.33 ↔ ↓<br />
2y/10y Spread (bp) 117 ↔ ↓<br />
Forex EUR/USD 1.3638 ↓ ↓<br />
USD/JPY 89.81 ↑ ↑<br />
IMPORTANT NOTICE. Please refer to important disclosures found at the end of<br />
this report. Some sections of this report have been written by our strategy teams<br />
(shown in blue). Such reports do not purport to be an exhaustive analysis and may<br />
be subject to conflicts of interest resulting from their interaction with sales and<br />
trading which could affect the objectivity of this report.
<strong>Market</strong> Outlook<br />
The market has already<br />
reacted positively to the<br />
EU statement on Greece -<br />
the conditions of any<br />
financial support will be<br />
key<br />
The Greek crisis has turned into a critical test of EMU, forcing EU officials to<br />
demonstrate greater coordination and solidarity. There is no alternative for<br />
Greece but to implement those fiscal measures already announced and<br />
probably more – pension reform will be discussed in the spring. But after<br />
pressuring Greece for several weeks to impose the necessary fiscal<br />
discipline, the outcome of the EU leaders’ summit on Thursday was a very<br />
clear message backing Greece.<br />
The statement represents progress. The EU has moved from an implicit to<br />
explicit commitment to protect Greece. Strict conditions attached could lend<br />
Greece the credibility it sorely needs. However, details are still lacking. We<br />
may get some details on a commitment to act if needed after the Finance<br />
Ministers’ meetings early next week.<br />
Details on potential financial assistance for Greece under strict conditions<br />
would further enhance market confidence – the 10y GGB/Bund spread has<br />
already compressed by roughly 90bp this week to close to 270bp, after<br />
peaking at 400bp at the end of January. Ultimately, the current debate is<br />
about EMU governments (Greece at this stage) giving up part of their<br />
independence in terms of fiscal policy; this has been the missing link within<br />
EMU since day one. The EMU framework may emerge strengthened from<br />
the current crisis although none of the governments will willingly cede fiscal<br />
autonomy.<br />
While the road is likely to remain bumpy, EMU political will is now strong<br />
enough to conclude that the highs on Greek spreads are behind us<br />
480<br />
430<br />
380<br />
10y GGB/Bund (ASW)<br />
GRE CDS 5y<br />
480<br />
430<br />
380<br />
240<br />
190<br />
10y PGB/Bund<br />
10y GGB/Bund (RHS)<br />
10y SPGB/Bund<br />
400<br />
300<br />
330<br />
280<br />
230<br />
Nov 16th: BoG triggers a<br />
sell-off in Greek Bonds<br />
with its warning on<br />
Greek banks<br />
330<br />
280<br />
230<br />
140<br />
90<br />
200<br />
180<br />
130<br />
180<br />
130<br />
40<br />
100<br />
80<br />
Nov-08 Jan-09 Mar-09 May-09 Jul-09 Sep-09 Nov-09 Jan-10<br />
80<br />
-10<br />
Nov-08 Feb-09 May-09 Aug-09 Nov-09<br />
0<br />
Source: Reuters EcoWin Pro<br />
Core EGBs to give up<br />
some of their recent<br />
gains…<br />
…a move which could be<br />
reinforced by a negative<br />
tone on Treasuries<br />
The commitment of European political and monetary authorities to address<br />
the situation in a credible and coordinated way is a pre-condition for a<br />
durable compression of intra-EMU spreads. Support for peripherals will<br />
reverse part of the recent move towards safety although any setback on core<br />
EGBs is likely to be limited as govvies remain supported by other factors<br />
such as concerns about growth, the risk of tighter monetary policy in China<br />
and more regulation ahead. In other words, the overall mix for risk appetite is<br />
not favourable overall – as illustrated by the performance of the main equity<br />
indices since the start of the year.<br />
A limited sell-off of core EGBs would lead the curve to re-steepen slightly,<br />
allowing the 2-5-10y fly to rebound. This, our favourite scenario near term, is<br />
based on the ability of the European authorities to deliver a credible<br />
message to the markets.<br />
In the US, Bernanke said the FOMC’s policy outlook (“extended period”,<br />
subdued inflation etc.) has not changed since the last meeting and then<br />
Cyril Beuzit 12 February 2010<br />
<strong>Market</strong> <strong>Mover</strong><br />
2<br />
www.Global<strong>Market</strong>s.bnpparibas.com
gave a few specific details on the Fed’s exit strategy. This was interpreted as<br />
stepping up the rhetoric on eventual tightening. The discount rate is likely to<br />
be raised at some point, although the discount window is barely used and<br />
had already failed the test of being a “cap on Libor” earlier in the crisis. The<br />
issue of paying interest on reserves is more relevant and could be bearish<br />
for Fed funds, which in turn will filter through to OIS, repo and Libor.<br />
All in all, Bernanke’s testimony could serve as the catalyst for even higher<br />
yields as the market’s attention shifts away from sovereign debt fears and<br />
back to the FOMC and major economic data. Recall that it only took a few<br />
positive data surprises for yields to jump. This asymmetric bias towards<br />
higher yields prompted us to be bearish at the start of the week; we remain<br />
in that camp.<br />
The technical picture looks fragile for Treasuries: when looking at a<br />
2007/2010 daily chart, we see that the market has drawn a wide bottom<br />
head-and-shoulders pattern with a neckline at 3.83% on the 10y T-note; this<br />
level was tested in early January.<br />
JGBs likely to stay rangebound<br />
Whatever the exit to the<br />
current EMU crisis, the<br />
medium-term outlook<br />
looks negative for the euro<br />
The JGB market has fluctuated within a narrow range since the start of 2010<br />
despite the global decline in stock prices. Intraday volatility has also fallen<br />
sharply, with the market showing very little reaction to factors that would<br />
ordinarily be considered buying or selling triggers. Next Tuesday's (16 Feb)<br />
5yr offering is likely to be readily digested, given that banks remain awash<br />
with surplus funds. We see no obvious ramifications for the yen bond market<br />
from upcoming decisions regarding the EMU crisis; JGB yields are unlikely<br />
to rise by more than the tiniest amount while the Nikkei 225 remains mired<br />
near the 10,000 mark.<br />
In the FX market, the euro remains at the top of the agenda. While a<br />
European rescue package for peripheral bond markets could allow the EUR<br />
to benefit from a short covering rally, the long-term prospects remain outright<br />
bearish for the single currency. Deflationary adjustment pressures will be<br />
unleashed for almost a fifth of the eurozone economy, suggesting inflation is<br />
likely to undershoot the ECB’s internal staff projections. Rate and yield<br />
differentials should continue working against the euro in the medium term.<br />
At the same time, when the EUR loses yield and rate attractiveness, central<br />
bank reserve managers are less inclined to shift USD reserves into euros.<br />
Last year, currency reserves rose by an impressive USD 768 bln, mainly<br />
driven by Asia. China has printed money and, by its quasi-fixed USDCNY<br />
6.82 exchange rate, has added to the supply of USDs. However, Asian<br />
monetary authorities generally and China’s in particular have started<br />
tightening monetary policy, imposing measures to curb hot money inflows<br />
even as net export growth is declining. As a result, currency reserve growth<br />
will ease, automatically reducing the supply of USDs added to the market<br />
and thus suggesting a lower EURUSD.<br />
Short GBP, long AUD &<br />
SEK<br />
A big currency investment theme is selling currencies where the credit<br />
multiplier is not working – as opposed to currencies benefiting from credit<br />
expansion. In the UK, the adjusted M4 has continued to decline, supporting<br />
our view that a high level of leverage is deflationary, especially if banks bear<br />
a substantial share of the leverage. The BoE’s revision of its two year<br />
inflation projection down to 1.2% will not bode well for the GBP as the<br />
sterling money market curve will have to flatten out. The performance of the<br />
GBP and 3x9 sterling FRA are tightly correlated. Hence, we expect sterling<br />
to remain under selling pressure.<br />
Australia and Sweden are two countries where there is a positive credit<br />
multiplier. The outperformance of the AUD and SEK has received additional<br />
support from the low sovereign debt levels reported in the countries.<br />
Cyril Beuzit 12 February 2010<br />
<strong>Market</strong> <strong>Mover</strong><br />
3<br />
www.Global<strong>Market</strong>s.bnpparibas.com
US: Roadmap to Fed Tightening<br />
• Chairman Bernanke carefully distinguished<br />
between policies aimed at providing emergency<br />
liquidity and more traditional monetary policy in<br />
his testimony on Wednesday.<br />
Chart 1: Effective Fed Funds Has Been Volatile<br />
• Emergency liquidity programmes have been<br />
almost completely phased out, with a hike in the<br />
discount rate and the end of the TAF and TALF<br />
programs the likely next steps.<br />
• The most likely sequence of monetary policy<br />
tightening will involve a draining of excess<br />
reserves well before the first rate hike, and the<br />
target policy rate shifting to the rate paid on<br />
reserves. Asset sales are a last step in an<br />
extremely frothy macroeconomic scenario.<br />
• There is little in the testimony to change<br />
expected timing of policy tightening, which will<br />
still be determined by the evolution of the<br />
economic recovery.<br />
Emergency liquidity policies are near an end as<br />
financial market conditions normalise<br />
On a day when Washington DC found itself<br />
snowbound, making it impossible for Chairman<br />
Bernanke to appear before the House Financial<br />
<strong>Services</strong> Committee as scheduled, the Federal<br />
Reserve nonetheless released his testimony. The<br />
testimony provided more details and specifics than<br />
we had seen previously about the likely sequence of<br />
actions the Fed will take as it transitions away from<br />
an extremely accommodative policy stance. That<br />
said, the speech did not change our expectations of<br />
the timing of eventual rate hikes and markets were<br />
little changed on balance after the release of the<br />
testimony.<br />
Chairman Bernanke clearly distinguished between<br />
emergency liquidity policies the Fed put in place “in<br />
its role as liquidity provider of last resort” and those<br />
that allowed the Fed to effectively push through the<br />
zero bound on interest rates in an effort to stimulate<br />
economic activity. Emergency liquidity policies<br />
included a number of programmes that provided<br />
short-term funding to distressed markets. In his<br />
testimony, Chairman Bernanke indicated that, “as<br />
was intended, use of many of the Federal Reserve's<br />
lending facilities has declined sharply as financial<br />
conditions have improved”. He signalled that the next<br />
step in ending this emergency lending role was a<br />
“modest increase in the spread between the discount<br />
rate and the target Federal funds rate” that will be<br />
considered “before long” as well as a reduction in the<br />
maximum maturity of discount window borrowing to<br />
Source: Reuters EcoWin Pro<br />
Chart 2: Banks And Credit Still Contracting<br />
Source: Reuters EcoWin Pro<br />
28 days from 90 days. Prior to the crisis, the spread<br />
between the discount rate and Fed funds was 100bp<br />
and loans that were generally overnight were<br />
lengthened to 90 days. Furthermore, he indicated<br />
that he anticipates that funding through the Term<br />
Auction Facility (TAF) and the Term Asset-Backed<br />
Securities Loan Facility (TALF) “will also be phased<br />
out soon”. He stressed that “These changes, like the<br />
closure of a number of lending facilities earlier this<br />
month, should be viewed as further normalization of<br />
the Federal Reserve's lending facilities, in light of the<br />
improving conditions in financial markets; they are<br />
not expected to lead to tighter financial conditions for<br />
households and businesses and should not be<br />
interpreted as signalling any change in the outlook<br />
for monetary policy, which remains about as it was at<br />
the time of the January meeting of the FOMC.”<br />
Julia Coronado 12 February 2010<br />
<strong>Market</strong> <strong>Mover</strong><br />
4<br />
www.Global<strong>Market</strong>s.bnpparibas.com
More clarity was given on the sequencing of<br />
monetary policy tightening<br />
The testimony provided a baseline scenario of the<br />
steps that would be taken to tighten monetary policy.<br />
He described the large-scale purchases on<br />
Treasuries, Agencies and MBS as a component of<br />
monetary policy put in place when the Fed reached<br />
the zero bound on interest rates and the economy<br />
was still under “severe stress”. These purchases<br />
were financed through the creation of a tremendous<br />
amount of excess reserves that led to loss of control<br />
over the effective Fed funds rate (Chart 1) even as<br />
they “helped improve conditions in private credit<br />
markets and put downward pressure on longer-term<br />
private borrowing rates and spreads.” However, the<br />
extreme liquidity in money markets has apparently<br />
led the Fed to decide two things: first, it will need to<br />
mop up some of the excess reserves before actually<br />
raising rates, and second, “during the transition to a<br />
more normal policy configuration”, the Fed is<br />
considering shifting its target policy rate to the rate<br />
paid on reserves rather than a target Fed funds rate.<br />
The reason that the policy to pay interest on bank<br />
reserves did not effectively put a floor under Fed<br />
funds is that the mortgage agencies are suppliers of<br />
funds to the overnight lending market and yet cannot<br />
place deposits at the Fed; therefore, the Fed funds<br />
has traded below the rate paid on reserves since the<br />
policy to pay interest on reserves was implemented<br />
in October 2008. A Congressional act would be<br />
required to allow the mortgage agencies to deposit<br />
money at the Fed, and it is not clear why the Fed<br />
does not pursue this as a way to gain more control<br />
over short-term rates. In any case, the Fed has<br />
concluded that “the Federal funds rate could for a<br />
time become a less reliable indicator than usual of<br />
conditions in short-term money markets” and is<br />
considering shifting to a target rate over which it<br />
would have absolute control. Presumably, this would<br />
come along with an expected range for Fed funds<br />
and Chairman Bernanke also suggested it could<br />
involve targets for reserve quantities.<br />
The tools for draining excess reserves, as previously<br />
announced, include mainly reverse repos and a term<br />
deposit facility at the Fed. He said “The capability to<br />
carry out [reverse repos] with primary dealers, using<br />
our holdings of Treasury and agency debt securities,<br />
has already been tested and is currently available.<br />
To further increase its capacity to drain reserves<br />
through reverse repos, the Federal Reserve is also in<br />
the process of expanding the set of counterparties<br />
with which it can transact and developing the<br />
infrastructure necessary to use its MBS holdings as<br />
collateral in these transactions.” Presumably, the<br />
counterparties beyond primary dealers could include<br />
money markets and possibly even the mortgage<br />
agencies. The Fed has had some concerns about<br />
Chart 3: Consumer Spending Subdued<br />
Reflecting Deleveraging<br />
Source: Reuters EcoWin Pro<br />
Chart 4: Credit Supply and Demand are Weak<br />
Source: Reuters EcoWin Pro<br />
possible market distortions from going outside the<br />
primary dealer community for these transactions,<br />
although it is clear that balance sheet constraints<br />
limit the amount of liquidity that dealers can absorb.<br />
The Fed has apparently decided that capacity is the<br />
bigger concern.<br />
The Fed has already put forward a blueprint for the<br />
term deposit facility and is “currently analyzing public<br />
comments”. It expects to conduct test transactions<br />
this spring and to have the facility available if<br />
necessary “shortly thereafter”. This facility would<br />
involve the auctioning of large blocks of term<br />
deposits to depository institutions that would reduce<br />
overnight cash in the market and tighten liquidity<br />
conditions.<br />
Asset sales are a last choice for policy and an<br />
unlikely outcome<br />
Chairman Bernanke clearly stated that he “currently<br />
[does] not anticipate that the Federal Reserve will<br />
sell any of its security holdings in the near term, at<br />
least until after policy tightening has gotten under<br />
way and the economy is clearly in a sustainable<br />
recovery”. He said the Fed will let MBS holdings run<br />
off over time through prepayments and maturities<br />
Julia Coronado 12 February 2010<br />
<strong>Market</strong> <strong>Mover</strong><br />
5<br />
www.Global<strong>Market</strong>s.bnpparibas.com
and that “in the long run, the Federal Reserve<br />
anticipates that its balance sheet will shrink toward<br />
more historically normal levels and that most or all of<br />
its security holdings will be Treasury securities”. The<br />
Fed would consider selling securities only in a robust<br />
macroeconomic scenario, and “any such sales would<br />
be at a gradual pace, would be clearly communicated<br />
to market participants, and would entail appropriate<br />
consideration of economic conditions”. The clear<br />
signal is that the Fed is comfortable living with an<br />
expanded balance sheet for some time.<br />
The testimony provides more detail about<br />
sequencing and execution but does not change<br />
our view of the likely timing of policy tightening<br />
While some market participants view this clarity from<br />
the Fed as a signal that such operations are on the<br />
near-term horizon, we would stress that Chairman<br />
Bernanke reiterated that the current stance of policy<br />
has not changed and will be determined by economic<br />
and financial market developments.<br />
Indeed, it is difficult to see the Fed moving to raise<br />
rates when bank lending is still contracting (Chart 2).<br />
Small and mid-size banks continue to fail; the FDIC<br />
took over 148 institutions in 2009 and has already<br />
taken on 16 in 2010. This suggests an ongoing<br />
consolidation process from the financial crisis that is<br />
limiting credit supply.<br />
However, there is also a significant demand element;<br />
the broad economy is still deleveraging and this has<br />
been manifested in a subdued recovery in final sales<br />
to date (Chart 3 and 4). It would seem that some<br />
recovery in private credit creation would likely come<br />
before the Fed decided that the economy was<br />
building up too much steam and needed to be<br />
restrained. Rather, we view this as an indication of<br />
the extraordinary complexity and uncertainty in<br />
orchestrating policy tightening in these unusual<br />
circumstances and a desire by the Fed to develop<br />
and communicate a robust toolkit well in advance.<br />
Julia Coronado 12 February 2010<br />
<strong>Market</strong> <strong>Mover</strong><br />
6<br />
www.Global<strong>Market</strong>s.bnpparibas.com
Sovereign Debt: Time for Europe to Act<br />
The sovereign debt crisis in the eurozone is about a<br />
lot more than Greece, Spain, Portugal and Ireland or<br />
any other country. It is about the collective political<br />
will of eurozone countries to set in stone the firm<br />
fiscal foundations that are necessary to underpin<br />
EMU. Remember that EMU stand for Economic and<br />
Monetary Union and not just Monetary Union. In<br />
short, the credibility of the project is at a testing point.<br />
At the end of this period, EMU will emerge stronger<br />
or significantly weaker.<br />
If one or more countries have sufficiently poor fiscal<br />
deficit and debt dynamics, then they risk undermining<br />
EMU in several ways. Speculation about credit risks<br />
for a sovereign can have knock-on effects on its<br />
partners in the union. There may be upward<br />
pressures on rates and dislocation in money<br />
markets. Risk premia and uncertainty may rise,<br />
undermining growth, or the currency and other asset<br />
markets may become volatile. Monetary policy may<br />
end up compromised or overburdened. For example,<br />
potentially the ECB could end up in the invidious<br />
position of having to choose between tightening<br />
monetary conditions to reflect economic<br />
developments when that would intensify a debt crisis<br />
or setting rates too low to avoid a debt crisis.<br />
As with any club, if one member imposes negative<br />
externalities on the other members of EMU, then the<br />
other members can reasonably expect to have an<br />
important say on the future behaviour of that<br />
member.<br />
The mechanism that is supposed to achieve this in<br />
the eurozone is of course the Stability and Growth<br />
Pact (SGP). Now, it is not delivering much stability<br />
and precious little growth. Unfortunately, despite the<br />
Commission having endorsed the Greek stability<br />
programme, the market has not put a lot of credibility<br />
in the plan.<br />
Greece could eventually manufacture its own<br />
credibility by delivering on its promises. But the<br />
market is unlikely to give them that amount of time. If<br />
a country cannot establish quickly its own credibility<br />
in the eyes of the market, what may be needed is an<br />
effective reduction of that state’s sovereignty over its<br />
own economic and to some extent social policies. It<br />
can borrow the credibility of its stronger peers.<br />
This is the rational behind the decision on Thursday<br />
to offer potential financial support if needed, and to<br />
bring in ECB and IMF expertise in the design and<br />
monitoring of Greece’s adjustment programme. The<br />
Commission will liase with the ECB to “closely<br />
monitor the implementation of the [stability<br />
programme’s] recommendations” and will draw on<br />
the expertise of the IMF to “propose additional<br />
measures”. These measures are designed to buy<br />
breathing space for Greece to implement its plans<br />
and for those plans to start paying dividends, while in<br />
the short term alleviating potential funding problems<br />
and market disruption.<br />
If this sounds like an IMF-style programme to you,<br />
then you are right. Note that we say an “IMF-style”<br />
programme. Crucially, the EU are limiting its use of<br />
the IMF to its expertise - a Fund programme might<br />
help to fix the current crisis, but as we said above,<br />
there is a longer-term game playing out here, which<br />
is for the fiscal soul of EMU. If the Fund were to bring<br />
a full programme to the eurozone, it will be an<br />
admission of failure by the Commission and the<br />
Council. It would be a public acknowledgement that<br />
the Europeans cannot put their own house in order. It<br />
would undermine the credibility of the institutions<br />
supporting EMU and will set a terrible precedent for<br />
the future.<br />
The monitoring of Greece’s adjustment programme<br />
in conjunction with the ECB and use of IMF expertise<br />
to propose additional measures is a crucial feature of<br />
the EU’s statement. If the EU had offered support to<br />
Greece without monitoring or conditions then some<br />
of the same problems would arise – EU institutions<br />
and the fiscal underpinning for the euro would be<br />
seen to be weak and deficient. We’ve learned a lot<br />
about moral hazard over recent months and years<br />
and the involvement of IMF expertise suggests the<br />
Council and Commission understand the risks. If its<br />
support were seen to be a pure “bailout”, then it<br />
would have created a terrible moral hazard,<br />
encouraging poor fiscal performance in the future by<br />
current and future members of the EMU.<br />
We could argue that infringing on the sovereignty of<br />
a member state is not enshrined in any treaty.<br />
Maybe, but it seems to us that the EU’s support for<br />
an adjustment programme under strict conditionality<br />
is precisely what was required. If this path is adhered<br />
to, then EMU can emerge from this episode<br />
strengthened and steeled. It will have come of age.<br />
Anything less will leave it much weaker than before.<br />
Paul Mortimer-Lee 12 February 2010<br />
<strong>Market</strong> <strong>Mover</strong><br />
7<br />
www.Global<strong>Market</strong>s.bnpparibas.com
French Regional Elections<br />
• The direct impact of regional elections is<br />
limited, as is the economic power of local<br />
authorities.<br />
• However, these elections will most likely be<br />
followed by a modest cabinet reshuffle. Further,<br />
the vote will set the political tone for the<br />
pension reform due later this year and for the<br />
implementation of fiscal tightening in 2011.<br />
The French regional elections are due on 14 and 21<br />
March (see Box 1). At first sight, the stakes are not<br />
huge. One would expect that, right after the worst<br />
recession of the last 50 years (with GDP falling 2.2%<br />
in 2009), the ruling government is likely to experience<br />
what is called on the French side of the channel a<br />
"Waterloo". These two ideas may be too simplistic.<br />
Political reading<br />
The regions have limited economic power, although it<br />
has been increasing in recent years. Their budgets<br />
are controlled and their leeway to vote a budget with<br />
a deficit is limited. Moreover, the government aims to<br />
reduce the scope for regions to increase spending,<br />
and the mandate of the councils will be reduced from<br />
six to four years ahead of an overhaul of how local<br />
authorities are organised. The real economic<br />
influence of the regional elections is indirect, via<br />
future government policy and possibly the upper<br />
house.<br />
In the last regional elections, the left-wing parties<br />
won the council presidency in 20 of the 22<br />
metropolitan regions 1 . Martine Aubry, the leader of<br />
the Socialist Party (PS) has said she is targeting the<br />
grand slam. Obviously, that is highly ambitious.<br />
Conversely, it will be much easier for the right-wing<br />
coalition to win more than the only two regions<br />
(Alsace and Corsica) that they currently run.<br />
In particular, part of the 2004 disaster for the<br />
government was due to the strength of the extremeright<br />
party 2 , the National Front (FN), which has<br />
1 There are four overseas regions, where local branches of<br />
the national parties are taking part together with local<br />
parties. As a consequence, the results are not fully<br />
comparable and people always focus on the 22 mainland<br />
regions.<br />
2 The National Front was then surfing on its relative 2002<br />
success when it managed to oust the Socialist candidate<br />
from the second round of the presidential elections.<br />
Conversely, PS supporters voted massively in 2004 to<br />
avoid a repeat of the 2002 disaster.<br />
Deadline to present lists<br />
Box 1: Election Calendar<br />
Event Date <strong>Market</strong><br />
relevance<br />
15 February<br />
Outcome of the first round 14 March<br />
8pm* **<br />
Outcome of the second round 21 March<br />
8pm* *<br />
Possible Cabinet reshuffle 24 – 31<br />
March ***<br />
Elections of presidents of late March<br />
regional councils<br />
early April -<br />
Source: <strong>BNP</strong> Paribas<br />
* The first estimate (normally quite reliable) of the vote outcome is<br />
announced by the press at 8pm local time; the final results are usually<br />
known during the night.<br />
Box 2: Electoral Process<br />
The regional elections are held on a two-round basis.<br />
Parties or coalitions present one list per region (the<br />
number of seats averages 85 but depends on the size of<br />
the region).<br />
After the first round, if one list has an absolute majority, it<br />
gets 25% of the seats* with the remaining seats distributed<br />
among the other lists that obtained at least 5% of the<br />
votes. If no list has an absolute majority, there is a second<br />
round.<br />
The lists that obtained less than 5% of votes are out; the<br />
lists that gained over 10% may either remain or merge<br />
with others, and these with 5-10% can only merge with<br />
lists that have obtained more than 10%. The rule is<br />
different for overseas territories and Corsica.<br />
After the second round, the list that has obtained most<br />
votes gets 25% of the seats*. The other seats are<br />
distributed according to the vote outcome.<br />
At the next council meeting, the president of each region is<br />
elected by the council members (by absolute majority, in a<br />
secret ballot).<br />
Source: <strong>BNP</strong> Paribas<br />
* the attribution of 25% of the seats to a list that arrived first guarantees an<br />
absolute majority in the council to this list as long as it gathers more than<br />
on third of total votes.<br />
subsequently lost a large part of its support.<br />
Consequently, the FN is less likely this year than in<br />
2004 to take part in the second round (when they ran<br />
in 18 regions, see Box 2). We may see more run-offs<br />
than in 2004, which should favour the centre-right<br />
coalition.<br />
-<br />
Dominique Barbet 12 February 2010<br />
<strong>Market</strong> <strong>Mover</strong><br />
8<br />
www.Global<strong>Market</strong>s.bnpparibas.com
The PS is more likely to face in the second round<br />
either a dissident list (e.g. in Languedoc, where the<br />
outgoing region's president has been banned from<br />
the party for making racist comments) or more<br />
radical left-wing lists (there are numerous extremeleft<br />
parties which have made partial coalitions,<br />
though they are struggling to come up with unified<br />
lists).<br />
Compared with 2004, the centre-right coalition has<br />
gained an ally (CPNT) and the PS has lost one as<br />
the communists have joined forces with some of the<br />
other extreme-left parties.<br />
As a result, the different left-wing and green lists may<br />
get more votes in the first round than in 2004<br />
(Chart 1); this would send a serious warning signal to<br />
the government. According to the most recent<br />
opinion polls, conducted at the national level, the<br />
centre-right coalition may get some 30% of the vote,<br />
vs. 27% for PS-led lists and 10% for the greens 3 .<br />
Nevertheless, the centre-right coalition is still likely to<br />
gain more regional presidencies in 2010 than in<br />
2004.<br />
The true economic stakes<br />
What matters most for financial markets is the<br />
distribution of votes in the first round, and whether or<br />
not this can be depicted as a "no confidence vote" in<br />
the government. The number of regions possibly won<br />
or lost by the centre-right coalition or the PS-green<br />
one (see Box 1) is less crucial.<br />
After the elections, a cabinet reshuffle can be<br />
expected. The President will argue he has heard the<br />
message from the popular vote and will shake up the<br />
cabinet to demonstrate this. He will use the<br />
opportunity to replace a few ministers who have been<br />
less successful (such as the minister of health).<br />
François Fillon is likely to stay as Prime Minister; he<br />
is currently more popular than the President and in a<br />
good position to lead on the pension reform, which is<br />
due to be discussed right after the regional elections.<br />
The identity of the new minister of social affairs (if a<br />
new appointment is made), in charge of this<br />
structural reform, and moreover the first speech he or<br />
she delivers will provide some indication as to how<br />
ambitious the reform could be. The markets are also<br />
keen to know whether the ministers in charge of the<br />
economy (Christine Lagarde) and budget (Eric<br />
Woerth) will retain their present positions. If they do,<br />
the credibility of the fiscal tightening policy would<br />
probably increase.<br />
70<br />
60<br />
50<br />
40<br />
Chart 1: Sarkozy’s Popularity Rating<br />
30<br />
Jun-07 Dec-07 Jun-08 Dec-08 Jun-09 Dec-09<br />
Source:<br />
No confidence<br />
Confidence<br />
Table 1: Outcome of the 2004 Regional<br />
Elections<br />
Coalitions Parties Votes Seats Presid.<br />
Extreme Left 4.95%<br />
Left wing 40.16% 20<br />
Mainstream Coalition 39.11% 1126<br />
Others 1.04% 36<br />
Right Wing 34.47% 2<br />
Mainstream Coalition 33.73% 522<br />
Others 0.74% 4<br />
Extreme Right 16.14%<br />
FN 14.70% 156<br />
Others 1.44%<br />
Miscellaneous 4.29% 4<br />
Fishers/Hunters 1.64%<br />
Other Ecologists 1.59%<br />
Others (incl. regionalists)* 1.07% 36<br />
Source: <strong>BNP</strong> Paribas<br />
Looking further down the road, the newly elected<br />
regional council members will take part in the upper<br />
house elections 4 . Presently the centre-right coalition<br />
only has a slim 52.5% majority in the upper house,<br />
and it could lose this next year.<br />
Our view<br />
We expect the participation rate to be lower in 2010<br />
than in 2004. According to opinion polls, the votes for<br />
the left-wing parties should significantly exceed those<br />
for the centre-right coalition, but probably not as<br />
much as in 2004. Consequently we expect that,<br />
though the PS will retain, by far, the largest number<br />
of regions, it may lose one or two vs. 2004. This<br />
would allow the government to push ahead with the<br />
planned reforms, in particular that of the pension<br />
system, and fiscal tightening, which is due to start in<br />
2011.<br />
3 The extreme right may get 9%, the Modem (which did not<br />
exist in 2004) 6% and the extreme left 11%, but in most<br />
regions these will be split between two or more lists.<br />
4 Half the upper house members will be elected in<br />
September 2011 by about 75k already-elected people,<br />
including the regional council members.<br />
Dominique Barbet 12 February 2010<br />
<strong>Market</strong> <strong>Mover</strong><br />
9<br />
www.Global<strong>Market</strong>s.bnpparibas.com
UK: Inflation Report – Surprisingly Dovish<br />
• The February Inflation Report was far more<br />
dovish than expected.<br />
Chart 1: BoE Inflation Projection (<strong>Market</strong> Rate<br />
Expectations)<br />
• Based on market interest rate expectations,<br />
the Bank’s CPI inflation projection is<br />
substantially below target two years ahead and<br />
still below target after three years.<br />
• The Inflation Report reinforced our<br />
conviction that the first Bank Rate hike is a very<br />
long way off.<br />
Surprisingly dovish<br />
The February Inflation Report was far more dovish<br />
than expected. Most forecasters, including ourselves,<br />
judged that – given the incremental news since the<br />
November Inflation Report – an upward revision to<br />
the inflation projection at the two year ahead horizon<br />
looked likely. What actually happened was the<br />
inflation projection was revised down, sharply.<br />
Source: Reuters EcoWin Pro<br />
Chart 2: BoE Inflation Projection (Unchanged<br />
Bank Rate)<br />
More specifically, the inflation projection based on<br />
market rate expectations was around 1.2% y/y at the<br />
two year ahead horizon. That compares to around<br />
1.8% at that horizon last time around and there were<br />
grounds for an upward revision.<br />
Similarly, the inflation projection based on<br />
unchanged Bank Rate was also revised down. Last<br />
time, the projection was 2¼-2½% y/y and rising<br />
sharply at that point. Now, that projection is around<br />
1.8% y/y. To be clear, the committee stresses time<br />
and again that the projection is about more than just<br />
the central ‘modal’ projection. What has changed<br />
here is the upside risks to the projection are<br />
somewhat greater than the downside risks to the<br />
projection. One might infer from this that the Bank<br />
expects a subdued inflation profile, but is<br />
acknowledging in the risk distribution the tendency<br />
for these data to surprise on the upside.<br />
Similarly, the profile is more than just a two year<br />
ahead projection. Apart from the near 1-2 quarters,<br />
the central inflation projection is persistently below<br />
target thereafter.<br />
Fiscal fudge<br />
The key message is that both inflation projections<br />
have undergone a huge downward revision. The<br />
rationale for that appears to have been influenced by<br />
the fiscal tightening included in the Pre-Budget<br />
Report. Specifically, the new report noted that:<br />
Source: Reuters EcoWin Pro<br />
“A significant fiscal consolidation is in prospect. The<br />
precise nature and pace of that correction are<br />
uncertain. The Committee’s projections are<br />
conditioned on the plans set out in the December<br />
2009 Pre-Budget Report. That consolidation is likely<br />
to put downward pressure on spending and inflation<br />
over the forecast period.”<br />
That compared to the following in the November<br />
Inflation Report:<br />
“The Committee’s projections are conditioned on the<br />
fiscal plans set out in the 2009 Budget. Those plans<br />
implied a marked rise in the ratio of public sector<br />
debt to GDP. Stabilising that ratio will require some<br />
combination of a reduction in government spending<br />
and a rise in taxation as a share of GDP”.<br />
Hence, there has been an evolution in the Bank’s<br />
thinking with regard to how fiscal policy will affect the<br />
Alan Clarke 12 February 2010<br />
<strong>Market</strong> <strong>Mover</strong><br />
10<br />
www.Global<strong>Market</strong>s.bnpparibas.com
outlook for GDP and inflation. So have forecasters<br />
been asleep at the wheel and should we have seen<br />
this revision to the Bank’s forecasts coming? Given<br />
what the MPC said in the January minutes, one can<br />
feel excused for being a little surprised by the extent<br />
of the revisions in the February Inflation Report:<br />
Chart 3: <strong>BNP</strong> Paribas vs BoE Inflation<br />
Projection (%, y/y)<br />
“A fuller analysis of the Government’s Pre-Budget<br />
Report than had been possible when the Committee<br />
had met in December implied that the published<br />
plans did not contain significant news for the outlook<br />
relative to the assumptions underlying the November<br />
Inflation Report”.<br />
We would say that a near 0.5 percentage point<br />
slashing of the two year ahead inflation projection is<br />
pretty significant news! Reading between the lines,<br />
the Bank got such a kicking at the November Inflation<br />
Report press conference for having such an upbeat<br />
growth projection and taking no account of the<br />
inevitable fiscal tightening that it wanted to avoid a<br />
repeat. We completely agree with the thrust of the<br />
revisions. After all, our own CPI inflation projection is<br />
even lower than the Bank’s during 2011.<br />
Rate hikes are a long way off<br />
The interpretation is crystal-clear. The fact that the<br />
inflation projection based on market rate<br />
expectations is well below target two years ahead<br />
shows the market is well ahead of itself in pricing in<br />
rate hikes. That projection is still below the 2%<br />
inflation target even after three years. Furthermore,<br />
with even more fiscal tightening likely to be<br />
announced in the aftermath of the election, that<br />
projection could be revised down yet further.<br />
The latest Inflation Report supports our long-held<br />
forecast that Bank Rate is likely to remain on hold for<br />
a very long time. We are at the very aggressive end<br />
of the consensus range. While most expect a rate<br />
hike before the end of this year, we expect no rate<br />
Source: Reuters EcoWin Pro<br />
hikes for the whole of 2010, and probably the whole<br />
of next year. The new Inflation Report has reinforced<br />
our conviction. King stated that it is far too soon to<br />
conclude that no further bond buying is needed.<br />
Clearly the door is open to more QE, though the<br />
likely improving data flow will make that a much<br />
harder call.<br />
The next key event on the UK monetary policy<br />
horizon is next week’s MPC minutes. In November,<br />
the inflation projections provoked one member to<br />
dissent in favour of more QE than the GBP 25bn<br />
expansion that was delivered. Since then, the<br />
inflation projection has been shifted lower. Hence if<br />
one member saw the case for more QE back in<br />
November, these projections would clearly support<br />
the case for dissenting now. Hence we expect a split<br />
vote. Clearly the majority on the committee opted for<br />
a pause in QE. King noted that it was not the Bank’s<br />
job to fine-tune by using QE.<br />
Alan Clarke 12 February 2010<br />
<strong>Market</strong> <strong>Mover</strong><br />
11<br />
www.Global<strong>Market</strong>s.bnpparibas.com
Sweden: Earlier Rate Hikes on Agenda<br />
• The Riksbank kept the repo rate at the<br />
historical low of 0.25% at its February meeting,<br />
as generally expected.<br />
• The further improvement in economic<br />
conditions was acknowledged, and overall the<br />
statement was hawkish compared to<br />
December’s.<br />
• The Riksbank thus brought forward its<br />
projection for the first rate hike, from autumn to<br />
summer or early autumn.<br />
• We agree with this assessment and expect<br />
the first rate hike to be delivered in July.<br />
However, if stress in financial markets<br />
intensifies and uncertainty increases, there is a<br />
risk that the Riksbank will wait until September.<br />
CPI<br />
CPIF<br />
GDP<br />
Repo rate<br />
(%)<br />
Table 1: Riksbank’s Forecasts (% y/y)<br />
2009 2010 2011 2012<br />
-0.3<br />
(-0.3)<br />
1.9<br />
(1.9)<br />
-4.5<br />
(-4.5)<br />
0.7<br />
(0.7)<br />
1.6<br />
(0.8)<br />
1.9<br />
(1.2)<br />
2.5<br />
(2.7)<br />
0.4<br />
(0.3)<br />
2.9<br />
(3.0)<br />
1.4<br />
(1.5)<br />
3.4<br />
(3.4)<br />
1.8<br />
(1.6)<br />
3.1<br />
(3.6)<br />
1.8<br />
(1.9)<br />
3.1*<br />
(3.5)<br />
3.3<br />
(3.6)<br />
Source: The Riksbank. December 2009 forecasts in brackets<br />
Note: * The downward revision is because, in the previous forecast for<br />
2012, the Riksbank used an incorrect calculation factor to take into<br />
account the difference in the number of working days in 2011 and 2012.<br />
Chart 1: Policy Rate (%)<br />
Further improvement in economic conditions<br />
The Riksbank left the policy rate unchanged at<br />
0.25% at its February meeting, in line with market<br />
expectations. The opening paragraph of the policy<br />
statement noted that “the assessment now is that the<br />
upturn in economy activity rests on more solid<br />
ground”. Therefore the Executive Board stated this<br />
time round that it has reasons for increasing the repo<br />
rate somewhat sooner than was assessed in<br />
December, when the Riksbank reiterated its<br />
projection that the repo rate should be kept at its low<br />
until the autumn. The Executive Board now expects<br />
that “it will begin to raise the repo rate in the summer<br />
or early autumn”. The statement also mentioned that<br />
“it will be possible to make the increases in the<br />
slightly longer term more gradually and the forecast<br />
for the repo rate in the longer term has therefore<br />
been adjusted downwards somewhat”.<br />
Hawkish tone<br />
The Riksbank mentioned the steady improvement in<br />
financial markets and slight increase in global growth<br />
since its last meeting in December. Compared with<br />
the previous statement, there was a change in<br />
language regarding the recovery. The Riksbank<br />
again stated the recovery in household consumption,<br />
but noted that “the development of the manufacturing<br />
industry is still lagging behind”. This is a more<br />
positive statement compared with the previous one,<br />
where industrial production was described as ”still<br />
weak”. Clearly, given the increase in surveys such as<br />
the manufacturing PMI, which at its current level is<br />
the highest among the main advanced economies,<br />
the Riksbank acknowledges that leading indicators<br />
Source: Reuters EcoWin Pro<br />
Chart 2: Exports & Manufacturing PMI New<br />
Export Orders<br />
Source: Reuters EcoWin Pro<br />
suggest an improvement in production in the coming<br />
period. The Riksbank also seemed to be more<br />
confident on the global economic outlook. The<br />
assessment was that ”demand for Swedish products<br />
will increase and exports will rise”.<br />
Gizem Kara 12 February 2010<br />
<strong>Market</strong> <strong>Mover</strong><br />
12<br />
www.Global<strong>Market</strong>s.bnpparibas.com
On inflation, Riksbank’s language was hawkish<br />
compared with the December statement. The<br />
increase in inflation in recent months was noted.<br />
Also, the expectation of weak wage increases was<br />
perceived to “help reduce inflationary pressures in<br />
the period ahead”. This is a marked change from the<br />
emphasis on the “downside risks to inflation” in the<br />
December statement.<br />
Revisions to Riksbank’s forecasts<br />
In terms of revisions to growth and inflation<br />
projections, the GDP growth forecast for this year<br />
has been revised down from 2.7% to 2.5%. Inflation<br />
forecasts for 2010, on the other hand, were revised<br />
upwards in light of the surprises on inflation. CPI was<br />
revised up from 0.8% to 1.6%, hence why the<br />
Riksbank now expects to deliver its first rate hike<br />
earlier, and CPIF from 1.2% to 1.9%. 2011 forecasts<br />
were revised down only by 0.1pp for both CPI and<br />
CPIF (to 2.9% and 1.4% respectively).<br />
Chart 3: GDP and Unemployment<br />
Source: Reuters EcoWin Pro<br />
Chart 4: Riksbank’s Policy Projections in<br />
December 2009 & February 2010<br />
Dissenter to the decision<br />
This time around, there was only one dissenter to the<br />
decision. Deputy Governor Lars E.O. Svensson once<br />
more entered a reservation against the decision and<br />
advocated cutting the repo rate to 0%. Deputy<br />
Governors Lars Nyberg and Barbro Wickman-Parak<br />
clearly did not dissent to today’s decision as the<br />
outcome was in line with their long-held view that ”it<br />
would be necessary to raise the interest rate sooner<br />
than indicated by the proposed interest rate path, but<br />
that the path would then not need to be so steep<br />
during the remaining forecast period”.<br />
4.5<br />
4.0<br />
3.5<br />
3.0<br />
2.5<br />
2.0<br />
1.5<br />
1.0<br />
0.5<br />
0.0<br />
Repo Rate (%, quarterly averages)<br />
Dec-09<br />
Feb-10<br />
Q110 Q210 Q310 Q410 Q111 Q211 Q311 Q411 Q112 Q212 Q312 Q412<br />
Our policy expectations<br />
Last week we highlighted that the further<br />
improvement in domestic economic conditions does<br />
provide a reason (see <strong>Market</strong> <strong>Mover</strong>, 5 February<br />
2010) for the Riksbank to bring forward its projection<br />
for the first rate hike from the autumn to the summer,<br />
i.e. from September to July. We also noted that there<br />
is already disagreement among the deputy governors<br />
regarding growth prospects, with deputy governors<br />
Nyberg and Wickman-Parak having a more positive<br />
view on the growth outlook, which would necessitate<br />
earlier rate hikes than forecast by the Riksbank.<br />
But, given the tensions in financial markets and<br />
increased uncertainty due to concerns over the fiscal<br />
situation in high-debt countries, we expected the<br />
Riksbank to adopt a cautious approach this time<br />
around and keep its repo rate path unchanged for the<br />
time being.<br />
Source: The Riksbank<br />
The Riksbank, however, seems to be more certain of<br />
the growth outlook, given the further improvement in<br />
economic conditions since the December meeting.<br />
Therefore, we believe the first rate hike will come in<br />
July, as economic conditions should continue to<br />
improve and the increase in unemployment is likely<br />
to be less than generally expected by the Riksbank<br />
previously.<br />
However, if stress in financial markets intensifies on<br />
the back of concerns over the sustainability of fiscal<br />
balances in some countries and uncertainty<br />
increases, there is a risk that the Riksbank will wait<br />
until September to start its hiking cycle.<br />
Gizem Kara 12 February 2010<br />
<strong>Market</strong> <strong>Mover</strong><br />
13<br />
www.Global<strong>Market</strong>s.bnpparibas.com
Japan: Slowing Consumption Recovery<br />
• Thanks largely to the effects of fiscal<br />
stimulus, household spending has been<br />
recovering since Q2 2009. However, there are<br />
signs that the tempo slowed significantly in Q4.<br />
• This is because the driver of the<br />
consumption recovery, stimulus-fuelled outlays<br />
for durable goods, is starting to lose steam, as<br />
evidenced by the plateauing of passenger car<br />
sales.<br />
• Owing to the severe state of household<br />
incomes, spending on areas unaffected by<br />
stimulus has remained weak, making it likely<br />
that the consumption recovery will falter in<br />
coming quarters.<br />
• Because the worst is over for<br />
employment/income conditions, an outright<br />
collapse in consumption is unlikely even after<br />
the support from fiscal stimulus ends.<br />
Chart 1: Sales of New Motor Vehicles including<br />
Mini Vehicles (annualised, sa, 10k)<br />
650<br />
600<br />
550<br />
500<br />
450<br />
400<br />
350<br />
02 03 04 05 06 07 08 09 10<br />
Source: Japan Automobile Dealers Association, <strong>BNP</strong> Paribas<br />
Chart 2: Department Store Sales (sa, JPY bn)<br />
690<br />
670<br />
650<br />
630<br />
610<br />
Consumption has been recovering since Q2 2009,<br />
thanks largely to the effects of fiscal stimulus. But<br />
areas not directly benefiting from that stimulus have<br />
remained lacklustre. With signs emerging that<br />
stimulus is losing its impact, we analyse the outlook<br />
for consumer spending.<br />
Recovery tempo slowed in Q4<br />
On a GDP basis, real consumer spending crested in<br />
Q1 2008 and over the following year plunged 3.8%<br />
before touching bottom in Q1 2009. Spending<br />
revived in Q2 2009 with a solid 1.2% q/q gain and<br />
advanced a further 0.9% in Q3. While monthly<br />
statistics suggest positive growth continued into Q4,<br />
we estimate that the tempo slowed to just 0.2% q/q.<br />
Effects of fiscal stimulus are waning<br />
The driver of Q4 consumption is again durable goods<br />
spending, the area benefiting most directly from the<br />
government’s various stimulative policies. But even<br />
here the tempo is waning. For example, car sales,<br />
the beneficiary of subsidies/tax breaks for the<br />
purchase of eco-friendly models, grew 3.0% q/q in<br />
Q4 according to our seasonally adjusted estimates,<br />
but that is well off the robust 17.4% q/q pace evident<br />
in Q3. (While commercial sales figures released by<br />
the METI show little difference between sales growth<br />
in Q3 and Q4 – 6.0% q/q and 6.8% q/q, respectively –<br />
the METI uses different seasonal adjustment and the<br />
reading for December is a sharp drop of 4.2% m/m,<br />
also suggesting slowing momentum.)<br />
590<br />
570<br />
550<br />
530<br />
510<br />
04 05 06 07 08 09<br />
Source: Japan Department Stores Association, <strong>BNP</strong> Paribas<br />
In terms of new cars sales (our seasonally adjusted<br />
estimates), the total bottomed out in March 2009 and<br />
by the summer had shifted substantially higher.<br />
Since October, however, this total has generally<br />
moved sideways. In January 2010, new cars sales<br />
were up a brisk 36.8% y/y but just 0.7% m/m. While<br />
this plateauing can partially be attributed to supply<br />
constraints for the hot-selling hybrid models, there<br />
are no such impediments for other models and their<br />
formerly robust sales have still stalled.<br />
Meanwhile, as for the stimulus benefiting household<br />
appliances, the eco-point system (whereby<br />
purchases of eco-friendly appliances earn points that<br />
can be redeemed for gift certificates and other items),<br />
sales of flat-panel TVs remain as solid as ever, due<br />
in part to the switchover to terrestrial digital<br />
broadcasting from July 2011. However, the METI’s<br />
Indices of Tertiary Industry Activity show a marked<br />
weakness for the retailers of household appliances,<br />
with real sales falling in both November and<br />
December.<br />
Ryutaro Kono/ Hiroshi Shiraishi 12 February 2010<br />
<strong>Market</strong> <strong>Mover</strong><br />
14<br />
www.Global<strong>Market</strong>s.bnpparibas.com
Spending on other areas never did improve<br />
Turning to areas of consumption unaffected by the<br />
stimulus, the tone remains weak. The situation is<br />
especially dire for department stores, which primarily<br />
market big-ticket items that today’s frugal consumers<br />
shun. According to our seasonally adjusted estimates,<br />
department store sales plummeted 4.8% q/q in Q4,<br />
far worse than Q3’s 0.3% drop. While sales on a<br />
monthly basis revived in December on the back of<br />
earlier-than-usual sales campaigns, the level remains<br />
below that of September owing to the steep sales<br />
declines posted in October and November.<br />
Preliminary figures for individual department stores in<br />
January show y/y declines ranging from 0.5% to<br />
roughly 7%. While that might be an improvement<br />
from December, month-on-month sales are generally<br />
flat.<br />
According to METI’s commercial sales statistics,<br />
business also remains sluggish for the retailers of<br />
food and beverages, with nominal sales in Q4 falling<br />
2.0% q/q. While falling prices act to deflate nominal<br />
sales, this sector’s real sales in Q4 were still down<br />
0.6% q/q. Although supermarkets and convenience<br />
stores are desperately trying to shore up sales of<br />
food/beverages by slashing prices and introducing<br />
cheaper private-brand goods, such strategies have<br />
not sparked demand.<br />
Meanwhile, the index of service consumption (a subindex<br />
of the Indices of All Industries) remains weak,<br />
with the reading for October being 0.2% m/m<br />
followed by -0.3% m/m in November, which, when<br />
averaged out, yields a flat trajectory from Q3. As for<br />
service spending moving forward, the December’s<br />
Consumer Confidence Survey’s section on<br />
expenditure plans for services in the coming quarter<br />
shows weakness in all six survey categories (sports,<br />
concerts, amusement parks, household services,<br />
restaurants, self-enlightenment).<br />
Consumption recovery will momentarily falter<br />
The fundamental reason for consumption being weak<br />
is the severe state of households’ income conditions<br />
(inadequate social welfare systems also play a big<br />
part in explaining the structural weakness of<br />
consumption). Most households realise that the drop<br />
in income from 2008 is permanent, and not just the<br />
result of a cyclical shock; households have lowered<br />
their spending levels to reflect this. That winter<br />
bonuses again fell sharply this year only reinforces<br />
the conviction that income has permanently shifted<br />
lower.<br />
Although many companies have returned to<br />
profitability on the back of booming exports, they will<br />
likely maintain a restrictive stance towards payroll<br />
costs as the return rate on capital remains low.<br />
Accordingly, any appreciable improvement in<br />
103<br />
102<br />
101<br />
100<br />
99<br />
98<br />
97<br />
96<br />
95<br />
94<br />
Chart 3: Indices of All Industries Activity,<br />
<strong>Services</strong> Consumption (CY2005=100)<br />
03 04 05 06 07 08 09<br />
Source: METI, <strong>BNP</strong> Paribas<br />
4<br />
2<br />
0<br />
-2<br />
-4<br />
-6<br />
-8<br />
Chart 4: Total Cash Earnings (% y/y)<br />
04 05 06 07 08 09<br />
Source: MHLW, <strong>BNP</strong> Paribas<br />
Special Cash Earnings<br />
Non-scheduled<br />
Total Cash Earnings<br />
Scheduled<br />
employment/income conditions is unlikely anytime<br />
soon or, as we have stated in previous reports, it will<br />
be a while before a positive feedback loop between<br />
income and expenditure starts to function. Given this<br />
situation, the recovery in consumption will likely falter<br />
in coming quarters as the effects of fiscal stimulus<br />
fade.<br />
That said, all is not completely grim with respect to<br />
household income conditions, as overtime earnings<br />
are rising alongside revived factory activity and the<br />
downturn in scheduled earnings is also easing<br />
thanks to increased working hours (something that<br />
previously had been sharply cut).<br />
With respect to employment, the picture is also<br />
stabilising, with the forward indicator of the job-offer<br />
ratio posting improvement for four straight months.<br />
Thus, the worst seems to be over for<br />
employment/income conditions. While those<br />
conditions might not significantly improve anytime<br />
soon, consumption is unlikely to collapse after the<br />
fiscal stimulus ends.<br />
Ryutaro Kono/ Hiroshi Shiraishi 12 February 2010<br />
<strong>Market</strong> <strong>Mover</strong><br />
15<br />
www.Global<strong>Market</strong>s.bnpparibas.com
US: Fed Provides More Details on Exit Plan<br />
• Bernanke outlined several steps and<br />
programmes that will help facilitate the Fed’s<br />
exit strategy in his speech on Wednesday.<br />
• The Fed is to conduct reverse repos with<br />
not only dealers, but also money market funds<br />
and other counterparties. We would argue that<br />
GSEs are a possibility as well.<br />
3<br />
2<br />
Chart 1: Fed Funds Target vs Effective<br />
Fed Target Rate<br />
Fed Effective Rate<br />
• By switching its policy target rate to the<br />
rate paid on excess reserves instead of<br />
effective fed funds, this should be mildly<br />
bearish for short-term rates. Again, GSEs are<br />
an obstacle to fully benefiting from this plan.<br />
• The Fed will offer term deposits and could<br />
now have greater control over 3m or longer<br />
rates by adjusting the supply of its offerings.<br />
• STRATEGY: We do expect some bearish<br />
impact on the 2-5y sector of the Tsy market. To<br />
be sure, Bernanke made it clear that there has<br />
been no policy shift (inflation subdued, rates to<br />
be held low for an extended period etc).<br />
However, the psychological effect of these<br />
measures will still be a factor as investors<br />
think twice about front-end carry/roll trades.<br />
1<br />
0<br />
May-08 Aug-08 Nov-08 Feb-09 Jun-09 Sep-09 Dec-09<br />
Source: <strong>BNP</strong> Paribas<br />
Chart 2: Commercial Paper to Remain Tight?<br />
400<br />
3m OIS vs ABCP Rate Spread 6<br />
350<br />
Fed Target Rate (R.H.S)<br />
5<br />
300<br />
250<br />
4<br />
200<br />
3<br />
150<br />
100<br />
2<br />
Bernanke outlined several steps that will help the<br />
Fed facilitate the unwinding of accommodative<br />
monetary policy. Some of these steps are not<br />
expected to have a noticeable impact, while the<br />
impact of a few programmes is unclear and warrants<br />
attention. However, there is no policy shift so one<br />
shouldn’t expect eventual Fed tightening to come any<br />
sooner than previously expected, although the<br />
impact on markets could nevertheless be bearish<br />
due to the symbolic nature of this detailed update on<br />
the Fed’s exit plan.<br />
Reverse repos with a twist<br />
Reverse repo operations by the Fed are nothing new.<br />
In fact, the Fed used reverse repos quite a bit in the<br />
beginning of the crisis to manage liquidity. By<br />
performing these transactions, the Fed drains cash<br />
out of the system. It is yet another tool for controlling<br />
overnight effective rates and keeping them closer to<br />
the target (Chart 1).<br />
What's new is that the Fed plans to perform these<br />
transactions with other counterparties besides<br />
primary dealers, albeit stopping short of identifying<br />
who those counterparties may be. Money market<br />
50<br />
0<br />
-50<br />
0<br />
Jan-08 Jul-08 Feb-09 Aug-09 Mar-10<br />
Source: <strong>BNP</strong> Paribas<br />
funds seem like good candidates, although they are<br />
already affected by the SEC’s recent ruling about<br />
shortening the maximum weighted-average maturity<br />
of a fund’s holdings from 90 to 60 days, which would<br />
weigh on demand in the longer end of the money<br />
market sector. Much of the assets bought in this<br />
sector are CDs and commercial paper. Chart 2<br />
shows that the CP spread is very tight due to the<br />
Fed’s liquidity programmes although it may now start<br />
to widen.<br />
Paying interest on excess reserves…but at the<br />
target rate<br />
The Fed is currently already paying 25bp on excess<br />
reserves, although the effectiveness of this is<br />
hampered by the fact that GSEs still don’t get paid on<br />
reserves. GSEs are big players in the Fed Funds<br />
market and they are a major reason why the Fed lost<br />
control of the effective fed funds rate (Chart 1). We<br />
1<br />
Sergey Bondarchuk / Suvrat Prakash / Bulent Baygun 12 February 2010<br />
<strong>Market</strong> <strong>Mover</strong>, Non-Objective Research Section<br />
16<br />
www.Global<strong>Market</strong>s.bnpparibas.com
would argue that resolving this issue would help the<br />
Fed regain better control of overnight rates. In fact,<br />
the Fed might also be already considering reverse<br />
repos with GSEs, as it has not yet specified which<br />
counterparties are under consideration.<br />
Bernanke outlined a key change in the Fed’s<br />
approach which could help it gain stronger control of<br />
short-term rates. The Fed will shift its policy target to<br />
the rate paid on reserves instead of the fed effective<br />
rate during the early stages of tightening. Effective<br />
fed funds has occasionally been driven much lower<br />
than expected as the banking system dumps<br />
reserves in that market on days of excessive liquidity.<br />
This makes it difficult for the Fed to control effective<br />
rates during the early stages of rate increases. By<br />
protecting against unexpected plunges in the Fed<br />
effective rate, this should force an upward<br />
adjustment to OIS, GC and even Libor, although<br />
perhaps only slightly since most of the time there is<br />
not a dramatic drop in effective rates.<br />
Offering term deposits<br />
This isn't the first time a potential Term Deposit<br />
Facility has been mentioned by the Fed. The<br />
implication of introducing such a facility, especially<br />
ahead of rate hikes, is that it could give the Fed<br />
effective control of rates longer than 1m or even 3m.<br />
As another tool for draining liquidity, the Fed "plans<br />
to offer to depository institutions term deposits, which<br />
are roughly analogous to certificates of deposit that<br />
the institutions offer to their customers".<br />
By offering deposit out to (say) 3m, the Fed could<br />
arguably directly control the 3m rate, besides the<br />
traditional overnight fed funds rate. Although an<br />
argument can be made that investors will set the<br />
rate, the Fed could nevertheless influence it by<br />
adjusting the supply of its offerings. Therefore, if the<br />
Fed starts to use this facility before official rate hikes,<br />
it could at the very least increase volatility and quiet<br />
possibly push up short rates. Testing of the TDF is<br />
scheduled to start in the spring on a small scale,<br />
implying that the use of this facility will scale up as<br />
the economy improves.<br />
Therefore, considering that the Fed has hinted that<br />
liquidity draining exercises will ramp up before official<br />
rate hikes, we could see the potential impact on rates<br />
as early as mid-to-late spring. As such,<br />
carry/rolldown plays should be considered with this in<br />
mind.<br />
On discount window, TAF and TALF wind-down<br />
The Fed’s current outstanding discount window<br />
borrowing is down to USD 89bn from a crisis peak of<br />
USD 438bn. Therefore, the discount window is barely<br />
used despite the Fed’s intense promotion of the<br />
facility at the start of the crisis. The idea was that<br />
banks would be willing to borrow from the Fed in<br />
case Libor rates were higher, thus making the<br />
discount window a “cap in Libor”. This failed the test<br />
and so other liquidity programmes were needed.<br />
Thus, a raise in the discount rate is unlikely to<br />
increase Libor (or other short-term rates) although<br />
some investors will surely still regard this as a<br />
hawkish message.<br />
Likewise, we expect no noticeable impact from the<br />
wind-down of other facilities, such as TAF on 8<br />
March and TALF on 31 March (30 June for CMBS<br />
collateral) as utilisation of these programmes has<br />
dwindled recently.<br />
Asset sales<br />
Lastly, security sales shouldn’t be a concern in the<br />
short/medium term, as the Fed doesn’t anticipate<br />
selling security holdings “at least until after policy<br />
tightening has gotten under way and the economy is<br />
clearly in a sustainable recovery”.<br />
Bernanke has used very careful and measured<br />
language in providing a detailed update on the Fed’s<br />
exit plan. By filling in the holes in the plan, investors<br />
are now able to envision the exit path more clearly<br />
and some may even be bracing for hawkish<br />
messages at upcoming FOMC meetings/speeches.<br />
Thus, while Bernanke may insist there has been no<br />
policy shift, the market reaction in the coming weeks<br />
may prove otherwise. We stick with the bearish call<br />
we made at the start of the week.<br />
Sergey Bondarchuk / Suvrat Prakash / Bulent Baygun 12 February 2010<br />
<strong>Market</strong> <strong>Mover</strong>, Non-Objective Research Section<br />
17<br />
www.Global<strong>Market</strong>s.bnpparibas.com
US: Impact of Buyouts on Rates and MBS<br />
• The GSE buyout announcements are<br />
bearish for mortgages, as they could shrink the<br />
potential base of investors post MBSPP end,<br />
erode carry in the interim and potentially<br />
remove GSEs as a backstop bid.<br />
• We like being long the 5Y swap spread on<br />
concerns around mortgage selling and a<br />
possible flight to quality into Treasuries.<br />
• The added uncertainty around the<br />
conclusion of MBSPP is likely to provide a bid<br />
to vol. We like being long gamma vol on 5y and<br />
10y tails.<br />
With GSE portfolios dedicated to buyouts, the<br />
possibility of them being a backstop bid after the Fed<br />
stops buying has diminished considerably. Money<br />
managers are likely to be the only major buyer of<br />
MBS, but would be hurt by the diminished liquidity in<br />
the mortgage market and unable to stem an overall<br />
increase in risk premia. As we have discussed<br />
previously, banks are unlikely to support mortgages<br />
in size. Overseas investors, already hurt by<br />
capricious GN prepayments (only 16% of the market)<br />
would be unlikely to support mortgages. We now look<br />
for a 30+bp widening in mortgages, and with the<br />
carry (in FGs) until Fed exit essentially lost, we've<br />
turned negative on mortgages. Also, with the Fed<br />
mostly in lower coupon fixed and other investors in<br />
higher coupons and ARMs, the private market is<br />
primarily taking the losses – and those too, quite<br />
suddenly.<br />
For FGs, with 30Y pools trading on the basis of Feb<br />
prepays, with large negative carry and TBAs for<br />
March settle, the market is likely to trade with<br />
difficulty. With the ratio of ARM to Fixed<br />
delinquencies at 5 times (12.54% vs 2.46%), the<br />
price depreciation is likely to impact this market<br />
particularly negatively. The CMO market also faces<br />
difficulty given the price depreciation in Inverse IOs<br />
due both to the type of collateral and leverage to<br />
prepays.<br />
For FNs, it is difficult to price TBAs, given the<br />
variable term of buyouts and also since the<br />
deliverability option is considerable. For example, at<br />
80 CPR, the carry on FN 6s is -13 ticks, at 90 CPR<br />
-27 ticks, at 99 CPR -79 ticks. Furthermore, very little<br />
information is available on products other than 30Ys.<br />
Since FN delinquencies for credit enhanced collateral<br />
are about 70% higher than FGs, market such as<br />
Chart 1: Mortgage Current Coupon LIBOR OAS<br />
vs the 5Y Swap Spread<br />
100<br />
80<br />
60<br />
40<br />
20<br />
0<br />
-20<br />
-40<br />
Mortgage Current Coupon LIBOR OAS<br />
5y Swap Spread (RHS)<br />
-60<br />
0<br />
Feb-05 Feb-06 Feb-07 Feb-08 Feb-09 Feb-10<br />
Source: <strong>BNP</strong> Paribas, Yield Book<br />
230<br />
210<br />
190<br />
170<br />
150<br />
130<br />
110<br />
90<br />
Chart 2: Gamma Over Time<br />
70<br />
Jan-09 Apr-09 Jul-09 Oct-09 Jan-10<br />
Source: <strong>BNP</strong> Paribas<br />
3m10y ATM vol<br />
10 yr swap (RHS)<br />
140<br />
120<br />
100<br />
ARMs could be even more hurt in FNs, given their<br />
relatively higher delinquencies. Dealers, who are in<br />
the business of carrying inventories in mortgage<br />
products, are likely to be hurt considerably at the<br />
beginning of the year. This bodes poorly for liquidity,<br />
especially with the Fed exit around the corner.<br />
As we have argued previously, it has always been<br />
economical to buy out loans in the beginning, rather<br />
than waiting until 24 month dlq for higher coupons<br />
(5.5% and above). While FAS 166/167 improves the<br />
economics for such loans, the principle of it being<br />
economical for such bonds remains. The economics<br />
argument offered by the agencies in yesterday's<br />
announcements could be challenged.<br />
Given the potential negative impact, we place a<br />
decent probability of such factors being considered in<br />
the actual implementation of the buyout<br />
announcement, and amendments more favourable to<br />
investors or a rolling back of these policies cannot be<br />
ruled out. Regardless, the absence of the role of the<br />
GSEs being a backstop bid from the<br />
administration/regulator/government's point of view<br />
bodes poorly for the basis.<br />
80<br />
60<br />
40<br />
20<br />
4.5<br />
4<br />
3.5<br />
3<br />
2.5<br />
2<br />
Anish Lohokare / Bulent Baygun 12 February 2010<br />
<strong>Market</strong> <strong>Mover</strong>, Non-Objective Research Section<br />
18<br />
www.Global<strong>Market</strong>s.bnpparibas.com
Ramifications for Rates, Swap Spreads and Vol<br />
The magnitude of losses implies that this could turn<br />
into a mini crisis. Depending on the interaction of the<br />
bearish effect of mortgages and some flight-to-quality<br />
flows, the net effect could be neutral to mildly bearish<br />
for duration. However, due to mortgage selling as<br />
well as a crisis-like situation, swap spreads should<br />
widen. In the event of a flight to quality, Treasuries<br />
should be the primary beneficiary with 2-5y swap<br />
spreads leading spread widening in the process. On<br />
the other hand, if the selling of mortgages brings with<br />
it selling/paying in Tsys and swaps, that could turn<br />
into a self-feeding cycle with most of the flows<br />
happening in the 5-10y part of the swap curve,<br />
thereby widening spreads in that sector. Historically<br />
episodes of MBS OAS widening have coincided with<br />
5y swap spread widening, supporting our intuition<br />
(Chart 1). In short, we advocate being long 5y swap<br />
spreads.<br />
In the immediate aftermath of the FNM/FRE<br />
announcements, vol and payer skew were slightly<br />
better bid but the impact has been very mild, and not<br />
out of line with what one would expect in a sell-off<br />
(recall that the rise in rates on Wednesday was<br />
triggered by a strong performance in equities in<br />
response to the Greek rescue discussions, as well as<br />
the tail in the 10y Treasury auction). In contrast, with<br />
rates virtually unchanged on the day after, vol has<br />
been easing off. However, given its already low<br />
levels relative to the range during the crisis (Chart 2),<br />
we expect any slide in vol to be rather muted,<br />
whereas any uptick should be more pronounced if/as<br />
mortgage selling gives rise to a self-feeding backup<br />
in rates, steepening the curve and widening swap<br />
spreads. In view of this expected asymmetric<br />
behaviour, we like being long gamma vol on 5y and<br />
10y tails.<br />
Anish Lohokare / Bulent Baygun 12 February 2010<br />
<strong>Market</strong> <strong>Mover</strong>, Non-Objective Research Section<br />
19<br />
www.Global<strong>Market</strong>s.bnpparibas.com
EUR: Limited Scope for a Rapid Recovery<br />
• The recent strong deterioration in the<br />
peripheral world was clearly linked to concerns<br />
on sovereign debt as well as speculative selling.<br />
Chart 1: Peripherals Helped Portfolios in 2009<br />
• But the deterioration also has to do with the<br />
lack of decent demand from real accounts,<br />
which are already full to capacity (and maybe<br />
beyond) on peripherals.<br />
• STRATEGY: Play intra-peripheral spread<br />
compression.<br />
Performance in 2009 driven by peripherals<br />
The performance of bond portfolios in the euro area<br />
in 2009 was significantly positive for most of the year,<br />
and well above the performance of core EMU<br />
markets. The performance of euro sovereigns last<br />
year was around 3.5%, and the performance of AAAs<br />
even lower (2.9%). The performance of peripherals<br />
was far stronger until the attacks started in<br />
December. It is worth noting that the market value of<br />
bond portfolios increased roughly in line with the<br />
performance of peripheral markets. While the<br />
available data end before the fourth quarter, it seems<br />
likely that the performance over the last few months<br />
has deteriorated significantly. This means that, other<br />
things being equal, bond portfolios were probably<br />
overweight in peripheral markets against cores.<br />
Bond portfolio managers benefited from the prospect<br />
of tighter spreads as the situation in financial markets<br />
and liquidity conditions improved. Global spread<br />
compression was favoured by such behaviour. All<br />
peripherals, above all those that suffered heavily in<br />
late 2008 and early 2009, benefited from this trend.<br />
Going into December 2009, it seems clear that a<br />
significant part of bond portfolios were overweight<br />
peripherals in general – Greece, Ireland, Italy and<br />
Portugal in particular. Then attacks on Greece<br />
started, spreading to Portugal and Spain.<br />
No capacity to absorb<br />
Portfolios were therefore exposed to counter<br />
performance from peripherals when the crisis started,<br />
and this explains the lack of demand in the face of<br />
speculative selling. The rapidity of movements in<br />
yields as well as the rise in volatility put portfolios<br />
under pressure. While most are valued by using a<br />
mark-to-market approach, their time horizon is longer<br />
than for trading books and therefore this did not<br />
trigger massive selling from real accounts. However,<br />
it did stop them benefiting from buying opportunities<br />
Source: <strong>BNP</strong> Paribas<br />
Chart 2: Strong Spread Compression Last Year<br />
Source: <strong>BNP</strong> Paribas<br />
when yields reached irrelevant levels recently. This<br />
situation is unlikely to change rapidly. In other words,<br />
beyond the strong decline in yields, CDS and<br />
spreads that could follow positive readings of<br />
coordinated European decisions, a return to levels<br />
prevailing before the crisis started in December is<br />
unlikely for a while. In addition, beyond the positive<br />
reaction near term, markets will wait for hard figures<br />
pointing to signs of improvement before confidence is<br />
fully restored.<br />
Strategy: Beyond the near-term compression, play<br />
intra-peripheral spread compression rather than<br />
peripheral-core spread compression.<br />
Patrick Jacq 12 February 2010<br />
<strong>Market</strong> <strong>Mover</strong>, Non-Objective Research Section<br />
20<br />
www.Global<strong>Market</strong>s.bnpparibas.com
EUR: Demand for ECB’s Liquidity Still High<br />
• Demand at this week’s MRO was significant<br />
given the existing level of excess liquidity.<br />
Recent limited tensions on OIS/BOR spreads<br />
could partly explain such behaviour.<br />
• As concerns over sovereign debt and<br />
liquidity should moderate in the coming weeks,<br />
we expect OIS/BOR spreads to tighten back<br />
slightly, preventing demand for safety from<br />
gaining momentum.<br />
• STRATEGY: Play a tactical compression of<br />
OIS/BOR spreads. Receive the 3mth OIS/BOR<br />
spread (first ER contract).<br />
Chart 1: Higher Demand Leads to Lower Eonias<br />
Demand for 1-week liquidity has increased<br />
Demand for liquidity at recent ECB MROs has<br />
increased significantly. The amount allotted this week<br />
was EUR 76.1bn, up 20.3bn from last week and the<br />
second-highest level of demand since September<br />
2009 (before the last two 1y tenders). The number of<br />
bidders increased only slightly, implying a reasonable<br />
rise in average demand from each bidder. Such an<br />
increase in demand could, at first sight, appear<br />
surprising given the existing level of excess liquidity<br />
in the eurosystem. The ECB is providing the<br />
eurosystem with EUR 745bn, thanks to EUR 712bn<br />
via open market operations and EUR 33bn of<br />
covered bond purchases. There is therefore no need<br />
to rush for ECB liquidity. Note that two tenders (3mth<br />
and 6mth) were expiring this week for a total amount<br />
of EUR 22.5bn. So, on balance, liquidity stands at<br />
the same level after this week’s operations. A<br />
stabilisation of demand at the MRO, implying a<br />
moderate decrease of excess liquidity after the two<br />
tenders’ expiry, could have been expected. The fact<br />
that banks increased demand at the MRO, ahead of<br />
the expiry of both the 3 and 6mth tenders, means<br />
that the need for ECB liquidity remains elevated at<br />
some banks, which remain unable to gain access to<br />
the liquidity in the market.<br />
Such robust demand at ECB operations, as well as<br />
concerns over liquidity conditions in the current<br />
environment of a deterioration of some sovereign<br />
debts, fuelled a slight decline in OIS rates while<br />
Euribors stopped declining. As a result, OIS/BOR<br />
spreads were paid further recently, adding a rise of<br />
Euribor rates to the decline in Eonias. While the<br />
OIS/BOR spread extension was not a matter of<br />
concern as long as it was driven by lower Eonias, it<br />
could be a concern when it is spurred by climbing<br />
Euribors.<br />
Source: <strong>BNP</strong> Paribas<br />
Chart 2: OIS/BOR Spreads to Tighten<br />
Source: <strong>BNP</strong> Paribas<br />
Things should calm down<br />
We do not expect an extension of the recent moves<br />
on Euribor rates. As concerns over sovereign debt<br />
gradually moderate, we see room for a modest<br />
decline in rates. At the same time, we doubt demand<br />
at upcoming ECB MROs will continue to climb. Only<br />
one LTRO will mature in coming weeks and the<br />
amount maturing is very small (EUR 2.1bn).<br />
Moreover, there will be a 3mth tender providing<br />
liquidity by the end of the month, which will allow<br />
banks to roll their position. A return of demand closer<br />
to EUR 55-60bn at upcoming MROs can be<br />
expected, leading to a slight decline in excess<br />
liquidity. This is likely to favour some compression in<br />
OIS/BOR spreads in coming weeks. A return closer<br />
to 25bp on the OIS/BOR IMM1 can be expected.<br />
Strategy: Receive the 3mth OIS/BOR spread (IMM1)<br />
with a target at 25bp.<br />
Patrick Jacq 12 February 2010<br />
<strong>Market</strong> <strong>Mover</strong>, Non-Objective Research Section<br />
21<br />
www.Global<strong>Market</strong>s.bnpparibas.com
EUR: Monitoring Dutch Pension Funds<br />
• Asset allocation and duration risk analysis<br />
suggest that pension funds remain very<br />
sensitive to swap curve and equity gyrations.<br />
According to official DNB data and given swap and<br />
equity markets’ evolution over the past four months,<br />
we estimate the industry-wide cover ratio for Dutch<br />
pension funds to be around 106%. This is a minor<br />
deterioration from the 109% reported in Q3 2009.<br />
However, the interesting issue is more related to<br />
duration risks and less to solvency risks. In Chart 1,<br />
we show the evolution of assets, liabilities and cover<br />
ratios for Dutch pension funds. Also, we show a<br />
variable called “duration gap”, a measure of the<br />
sensitivity of pension fund portfolios to asset and<br />
liability dynamics. Notably, the duration gap has not<br />
improved in line with cover ratios and remains at very<br />
high levels (EUR 325bn 30Y risk). This is an<br />
indication that aggregate Dutch pension funds did not<br />
make significant changes to their asset allocation in<br />
2009, i.e. they have not used the proceeds from the<br />
rally in risky assets to hedge some of their asset vs<br />
liability mismatch. We validate this assumption by<br />
looking at the evolution of simplified asset allocations<br />
in recent years. In Chart 2, we can see that the<br />
estimated 2009 bond/equity allocation has not<br />
changed significantly from reported 2008 levels.<br />
Conclusion: We think Dutch pension funds are more<br />
sensitive to equity and swap curve volatility than<br />
previously thought on the basis of 2009’s rally in risky<br />
assets. As such, an equity sell-off coupled with bull<br />
flattening of 10/30s remains the pain trade.<br />
750<br />
700<br />
650<br />
600<br />
550<br />
500<br />
450<br />
400<br />
-100<br />
-150<br />
-200<br />
-250<br />
-300<br />
-350<br />
-400<br />
Chart 1: Cover Ratio vs Duration Gap<br />
EUR bn<br />
Mar-07 Sep-07 Mar-08 Sep-08 Mar-09 Sep-09<br />
EUR bn<br />
Assets<br />
Technical provision<br />
Funding ratio<br />
LIVE<br />
1997 1999 2001 2003 2005 2007 Q3/09<br />
Source: <strong>BNP</strong> Paribas, DNB<br />
55%<br />
50%<br />
45%<br />
40%<br />
35%<br />
30%<br />
25%<br />
Chart 2: Asset Allocation<br />
Equities<br />
Duration gap (30Y risk)<br />
1997 1999 2001 2003 2005 2007<br />
Source: <strong>BNP</strong> Paribas, DNB<br />
Fixed income<br />
2009 (Est.)<br />
160%<br />
140%<br />
120%<br />
100%<br />
80%<br />
60%<br />
Live<br />
COVER RATIO PROJECTION - RISK SCENARIO: BULL FLATTENING<br />
SWAP CURVE<br />
EQUITY<br />
10Y -100 -90 -80 -70 -60 -50 -40 -30 -20 -10 0 10 20 30 40 50 60 70 80 90 100<br />
30Y -110 -99 -88 -77 -66 -55 -44 -33 -22 -11 0 11 22 33 44 55 66 77 88 99 110<br />
CURVE 0.25 0.26 0.27 0.28 0.29 0.30 0.31 0.32 0.33 0.34 0.35 0.36 0.37 0.38 0.39 0.40 0.41 0.42 0.43 0.44 0.45<br />
-50 73% 74% 75% 76% 77% 79% 80% 81% 82% 83% 85% 86% 87% 89% 90% 91% 92% 94% 95% 96% 97%<br />
-45 75% 76% 77% 78% 79% 81% 82% 83% 84% 86% 87% 88% 89% 91% 92% 93% 95% 96% 97% 99% 100%<br />
-40 76% 77% 79% 80% 81% 82% 84% 85% 86% 88% 89% 90% 92% 93% 94% 96% 97% 99% 100% 101% 103%<br />
-35 78% 79% 80% 82% 83% 84% 86% 87% 88% 90% 91% 93% 94% 95% 97% 98% 100% 101% 102% 104% 105%<br />
-30 80% 81% 82% 84% 85% 86% 88% 89% 90% 92% 93% 95% 96% 98% 99% 100% 102% 103% 105% 106% 108%<br />
-25 81% 83% 84% 85% 87% 88% 90% 91% 92% 94% 95% 97% 98% 100% 101% 103% 104% 106% 107% 109% 110%<br />
-20 83% 84% 86% 87% 89% 90% 92% 93% 94% 96% 97% 99% 101% 102% 104% 105% 107% 108% 110% 111% 113%<br />
-15 85% 86% 88% 89% 91% 92% 93% 95% 97% 98% 100% 101% 103% 104% 106% 107% 109% 111% 112% 114% 115%<br />
-10 87% 88% 89% 91% 92% 94% 95% 97% 99% 100% 102% 103% 105% 107% 108% 110% 111% 113% 115% 116% 118%<br />
-5 88% 90% 91% 93% 94% 96% 97% 99% 101% 102% 104% 105% 107% 109% 110% 112% 114% 115% 117% 119% 120%<br />
0 90% 92% 93% 95% 96% 98% 99% 101% 103% 104% 106% 108% 109% 111% 113% 114% 116% 118% 120% 121% 123%<br />
5 92% 93% 95% 96% 98% 100% 101% 103% 105% 106% 108% 110% 112% 113% 115% 117% 119% 120% 122% 124% 126%<br />
10 94% 95% 97% 98% 100% 102% 103% 105% 107% 108% 110% 112% 114% 116% 117% 119% 121% 123% 125% 126% 128%<br />
15 95% 97% 98% 100% 102% 103% 105% 107% 109% 110% 112% 114% 116% 118% 120% 121% 123% 125% 127% 129% 131%<br />
20 97% 99% 100% 102% 104% 105% 107% 109% 111% 113% 114% 116% 118% 120% 122% 124% 126% 128% 130% 131% 133%<br />
25 99% 100% 102% 104% 106% 107% 109% 111% 113% 115% 117% 118% 120% 122% 124% 126% 128% 130% 132% 134% 136%<br />
30 100% 102% 104% 106% 107% 109% 111% 113% 115% 117% 119% 121% 123% 125% 127% 128% 130% 132% 134% 136% 138%<br />
35 102% 104% 106% 107% 109% 111% 113% 115% 117% 119% 121% 123% 125% 127% 129% 131% 133% 135% 137% 139% 141%<br />
40 104% 106% 107% 109% 111% 113% 115% 117% 119% 121% 123% 125% 127% 129% 131% 133% 135% 137% 139% 141% 143%<br />
45 106% 107% 109% 111% 113% 115% 117% 119% 121% 123% 125% 127% 129% 131% 133% 135% 138% 140% 142% 144% 146%<br />
50 107% 109% 111% 113% 115% 117% 119% 121% 123% 125% 127% 129% 131% 134% 136% 138% 140% 142% 144% 146% 149%<br />
Alessandro Tentori 12 February 2010<br />
<strong>Market</strong> <strong>Mover</strong>, Non-Objective Research Section<br />
22<br />
www.Global<strong>Market</strong>s.bnpparibas.com
EUR: Peripheral ASW Curves Re-Steepening<br />
• As the contagion from Greece to other<br />
peripherals has been mainly taking place<br />
through a flattening of their ASW curves…<br />
• …we expect this to correct once the EU<br />
support package for Greece is announced. The<br />
correction has already started for Portugal but<br />
Spain has lagged relative to other peripherals.<br />
• STRATEGY: Expect the Spanish 2/10s to resteepen<br />
in the coming days. This could also be<br />
expressed via a 2/10s BOX of Spain vs Italy.<br />
In the past few weeks, we have been analysing the<br />
contagion from Greece to other peripheral countries<br />
through the development of flattening forces on their<br />
ASW curves. The Greek curve has been inverted<br />
since mid-January (maximum inversion of -146bp)<br />
while the Portuguese 2/10s also inverted slightly<br />
(max of -8bp) at the beginning of February.<br />
Moreover, even the Spanish and Italian curves<br />
started flattening aggressively although their 10y<br />
spread to Bund level was more resilient to the recent<br />
widening episode. This week’s headlines on EU<br />
support for Greece led to a reversion of these latest<br />
trends, with non-core spreads tightening massively<br />
and peripheral ASW curves re-steepening. Chart 1<br />
shows the change in the periphery’s ASW levels<br />
since Tuesday 9 February, the day when rumours of<br />
a Greek bailout started. Greek and Portuguese 2/10s<br />
steepened by a massive 61bp (as of Thursday 1pm<br />
GMT), while Italian & Spanish 2/10s steepened by<br />
15bp & 23bp respectively, thereby paring back most<br />
of their previous flattening (more details on the table<br />
in Chart 1).<br />
Chart 2 shows the accumulated change in 2/10s of<br />
peripheral ASW curves since 19 November, the start<br />
of the Greek crisis. While the Portuguese curve resteepened<br />
to such an extent that it is now trading at<br />
a higher level in 2/10s than on 19 Nov, the Greek<br />
and Spanish 2/10s have further steepening ahead in<br />
order to reach November’s levels. This translates to<br />
around 18bp for SPGBs 2/10s and 172bp for GGBs.<br />
Of course, in the case of Greece, part of the credit<br />
risk premium may remain in the front end so we<br />
could see the curve not reaching pre-crisis levels, but<br />
in the case of Spain we expect a similar outcome to<br />
Portugal, where the curve totally pared back the<br />
previous flattening in only three days. A more<br />
defensive way to express this view would be to play<br />
the BOX of SPGB 2/10s steepening versus BTPs<br />
flattening (Short SPGB 10y vs Long BTP 10y &<br />
opposite in 2y maturity). Spain’s higher credit rating<br />
Chart 1: Past 3 Days Change in Peripheral ASW<br />
Curves. Massive Re-Steepening Taking Place<br />
10<br />
-10<br />
-30<br />
-50<br />
-70<br />
-90<br />
-110<br />
-130<br />
-150<br />
-170<br />
2012 2014 2017 2020 2022 2025<br />
should at least be visible in the front end of the curve,<br />
where 2y SPGBs should trade tighter than 2y BTPs.<br />
This is not the case at the moment, as is shown in<br />
Chart 3: BTP and SPGB curves have almost identical<br />
curves.<br />
SPA<br />
GRE<br />
IRE<br />
ITA<br />
POR<br />
ASW 2/10s GER FRA ITA SPA IRE POR GRE<br />
Change since Nov 19th: 11.10 8.96 -0.05 -17.83 -26.78 12.13 -172.78<br />
MAX (Change in 2/10s) 16.0 18.2 12.9 6.0 12.8 21.0 2.2<br />
MIN (Change in 2/10s)<br />
Since Mon Feb 8th:<br />
Source: <strong>BNP</strong> Paribas<br />
-1.4 0.0 -19.3 -43.0 -46.7 -56.2 -239.3<br />
Peripherals felt most of the flattening forces<br />
-3.86 -8.14 15.70 23.35 19.91 60.86 61.22<br />
Massive steepening correction in the last 3-days<br />
Chart 2: 2/10s (ASW) Change Since 19 Nov –<br />
Further Steepening Potential for Spanish Curve<br />
30<br />
20<br />
10<br />
0<br />
-10<br />
-20<br />
-30<br />
-40<br />
-50<br />
-60<br />
-100<br />
-150<br />
-200<br />
-250<br />
-70<br />
-300<br />
Nov-09 Dec-09 Jan-10 Feb-10<br />
Source: <strong>BNP</strong> Paribas<br />
ITA<br />
POR<br />
SPA<br />
IRE<br />
GRE (RHS)<br />
Chart 3: 2/10s in ASW Vs 2y ASW Levels & POR<br />
vs SPA vs ITA ASW Curves<br />
2/10s ASW<br />
130<br />
110<br />
FRA<br />
90<br />
70<br />
50<br />
30<br />
10<br />
-10<br />
AUS<br />
GER<br />
100<br />
60<br />
BEL<br />
20<br />
-60<br />
-100<br />
ITA<br />
SPA<br />
IRE<br />
POR<br />
-50 0 50 100 150 200 250 300 350 400 450<br />
-20<br />
2y ASW<br />
GRE<br />
2012 2014 2016 2018 2020 2022 2024<br />
Source: <strong>BNP</strong> Paribas<br />
POR ITA SPA<br />
50<br />
0<br />
-50<br />
130<br />
110<br />
90<br />
70<br />
50<br />
30<br />
10<br />
-10<br />
Ioannis Sokos 12 February 2010<br />
<strong>Market</strong> <strong>Mover</strong>, Non-Objective Research Section<br />
23<br />
www.Global<strong>Market</strong>s.bnpparibas.com
EUR/GBP 2s10s Carry Box Revisited<br />
• Rolldown strategies continue to be pursued<br />
in a still-low yield environment. We review the<br />
EUR/GBP 2s10s swap carry box trade, which<br />
proved to be popular last year.<br />
• STRATEGY: Given the weaker correlation<br />
structure, we would monitor the forward term<br />
structure in order to lock in a higher profit of<br />
carry than currently available. Enter the trade for<br />
total carry ex-ante of around 50bp.<br />
3.0<br />
2.5<br />
2.0<br />
1.5<br />
1.0<br />
0.5<br />
0.0<br />
Chart 1: EUR vs GBP Spot Curves<br />
EUR 2s10s<br />
GBP 2s10s<br />
After having weakened somewhat in Q4 2009, the<br />
correlation between the EUR and the GBP swap<br />
curve has strengthened again. On 2s10s, the 6M<br />
rolling correlation is currently around 0.61, having<br />
fallen as low as 0.28 in mid December.<br />
In previous research, we have discussed how to<br />
capture the positive carry on the swap curve, while<br />
limiting the curve/delta risk implied by curve<br />
strategies: assuming a positive correlation structure<br />
between the EUR and the GBP curve: paying GBP<br />
1y fwd 2s10s vs receiving 1y fwd EUR 2s10s allows<br />
the locking in of a positive total carry as a result of<br />
the significantly wider spread between GBP 2s10s<br />
spot and GBP 1y fwd 2s10s.<br />
Chart 2 plots the evolution of the total one year carry<br />
of the combined position which could be locked in by<br />
entering the trade at different points in time. We can<br />
see that it reached values above 50bp in Q3 2009.<br />
Instead, if we were to pay the GBP 2s10s start Z10<br />
vs EUR today, we could lock in 39bp profit of carry<br />
until the end of 2010 (Table 1). Such number is still<br />
attractive but we would caution against entering the<br />
position at the current juncture.<br />
On the one hand, we remain convinced that the GBP<br />
curve will stay entrenched at steep levels in the<br />
medium term on the back of the combined forces of a<br />
dovish BoE and relentless supply. On the other hand,<br />
correlation is positive but rather low with respect to<br />
the trading range throughout the crisis.<br />
Hence, the hedge against total curve risk looks poor<br />
at present. In addition, we don’t expect the EUR<br />
curve to flatten in the short term: excess liquidity in<br />
the eurosystem is still elevated and bear flattening<br />
pressures resulting from the ECB’s implementation of<br />
exit strategies are not likely to develop before the<br />
beginning of H2. In fact, in the short term, bear<br />
steepening pressures might prevail on the EUR<br />
curve as a result of still unabated concerns regarding<br />
sovereign credit risk.<br />
-0.5<br />
-1.0<br />
2006 2007 2008 2009 2010<br />
Source: <strong>BNP</strong> Paribas<br />
Chart 2: Evolution of Ex-Ante Total Carry From<br />
1y fwd EUR/GBP 2s10s Swap Box<br />
0.6<br />
0.5<br />
0.4<br />
0.3<br />
0.2<br />
0.1<br />
0<br />
-0.1<br />
2006 2007 2008 2009 2010<br />
Source: <strong>BNP</strong> Paribas<br />
Chart 3: EUR/GBP 2s10s Swap Box Carry<br />
Analysis<br />
Ccy GBP Ccy EUR<br />
IMM Swap Curve Rolldown IMM Swap Curve Rolldown Box Rolldown<br />
0 2 0 2<br />
0 10 232 6 0 10 182 3 50 2<br />
H10 2 H10 2<br />
H10 10 226 18 H10 10 179 11 48 7<br />
M10 2 M10 2<br />
M10 10 209 20 M10 10 168 11 41 9<br />
U10 2 U10 2<br />
U10 10 189 21 U10 10 157 10 32 10<br />
Z10 2 Z10 2<br />
Z10 10 168 20 Z10 10 147 10 21 10<br />
H11 2 H11 2<br />
H11 10 148 H11 10 137 11<br />
Total Carry 84 45 39<br />
In sum, given the weaker correlation structure, we<br />
would monitor the forward term structure in order to<br />
lock in a higher profit of carry than currently<br />
available. Enter the trade for total carry ex-ante of<br />
around 50bp.<br />
Matteo Regesta 12 February 2010<br />
<strong>Market</strong> <strong>Mover</strong>, Non-Objective Research Section<br />
24<br />
www.Global<strong>Market</strong>s.bnpparibas.com
JGBs: Wait for Price Dips in Q2<br />
• JGBs tend to fall in the second quarter of<br />
the fiscal year, due to the reduction of<br />
purchases by postal savings and public<br />
pensions. In addition, numerous factors will<br />
combine to loosen JGB supply-demand<br />
conditions in Q2 FY 2010.<br />
• Our fundamental recommendation is that<br />
investors wait for sufficient price dips before<br />
starting to buy JGBs in H1 FY 2010.<br />
• Moreover, investors need to note the<br />
unexpected resilience of the economy, equities<br />
and the dollar. Such resilience could sway<br />
expectations about BoJ easing, depending on<br />
how it unfolds.<br />
• Looking out through March book closings,<br />
we will remain cautious on the medium sector<br />
of the curve where banks have significantly<br />
increased their long positions.<br />
Many factors to loosen JGB supply/demand in Q2<br />
There is a reason for JGBs’ recent weakness. A<br />
devil-plagued period for many market participants is<br />
approaching. JGBs fell sharply in the second quarter<br />
of both FY 2008 and FY 2009. This was not mere<br />
coincidence. As the repayment of funds entrusted to<br />
the FILP runs its course, JGB purchases by postal<br />
savings and public pensions gradually fall at the start<br />
of each fiscal year. Moreover, other investors,<br />
understanding this, wait for price dips before buying,<br />
exerting further downward pressure on JGBs in Q2 of<br />
the new fiscal year.<br />
That US Treasuries and JGBs are quite closely<br />
linked is well known. As Chart 1 shows, however, the<br />
two markets move independently when monetary<br />
policy is altered or when particular factors impacting<br />
supply-demand conditions come to the fore. In recent<br />
years, there has been a rise in the number of<br />
occasions when Treasuries strengthened<br />
independently or JGBs weakened independently.<br />
The tone of the JGB market has again deteriorated<br />
since the start of 2010. Investors should view this as<br />
the market starting to anticipate the customary “Q2<br />
anomaly”.<br />
Numerous factors will combine to loosen JGB<br />
supply-demand conditions in Q2 FY 2010. Aside<br />
from 1) the anomaly previously outlined, 2) we<br />
expect net JGB supply to increase by JPY 2trn-3trn<br />
compared to Q2 FY 2009; 3) the government may<br />
launch additional stimulus measures after the budget<br />
is passed; 4) it will become clear that tax revenues<br />
Chart 1: A Comparison of 10-year Yields in<br />
Japan and the US<br />
2.0 (%) JGB supply-demand<br />
(%) 5.4<br />
1.8 Japan<br />
conditions loosen<br />
5.0<br />
"Sell Japan" 4.6<br />
1.6<br />
4.2<br />
1.4<br />
1.2<br />
1.0<br />
Fed Treasury purchases<br />
BoJ additional easing<br />
0.8<br />
07/10 08/4 08/10 09/4 09/10<br />
Source: <strong>BNP</strong> Paribas<br />
US (RHS)<br />
have undershot more than currently projected when<br />
government accounts are settled at the end of May;<br />
and 5) we expect the DPJ manifesto for the Upper<br />
House elections to contain elements of reckless<br />
spending.<br />
Wait for price dips before starting to buy JGBs<br />
Finance Minister Kan has repeatedly pledged he will<br />
announce a medium-term fiscal reform outline by<br />
June of this year. However, it will be difficult to devise<br />
a convincing plan since a consumption tax hike is off<br />
the table ahead of July Upper House elections. If the<br />
plan is a mere formality that lacks true substance, it<br />
will inevitably stoke market unease. That said, after<br />
the election it is unlikely to be further postponed.<br />
Our fundamental recommendation is that investors<br />
wait for sufficient price dips before starting to buy<br />
JGBs in H1 FY 2010. We suspect the impact of the<br />
above factors loosening JGB supply-demand<br />
conditions has not been fully discounted. Moreover,<br />
investors need to note the unexpected resilience of<br />
the economy, equities and the dollar. Such resilience<br />
could sway expectations about BoJ easing,<br />
depending on how it unfolds.<br />
The short end will continue to find support, since the<br />
BoJ has intensified its quantitative easing. However,<br />
if uncertainties overseas and in the domestic political<br />
situation retreat and equity prices rise, institutional<br />
investors’ dependency on the benefit of carry will<br />
ease somewhat. Looking out through March book<br />
closings, we will remain cautious on the medium<br />
sector of the curve, where banks have significantly<br />
increased their long positions.<br />
3.8<br />
3.4<br />
3.0<br />
2.6<br />
2.2<br />
1.8<br />
Koji Shimamoto 12 February 2010<br />
<strong>Market</strong> <strong>Mover</strong>, Non-Objective Research Section<br />
25<br />
www.Global<strong>Market</strong>s.bnpparibas.com
Global Inflation Watch<br />
Large jumps in headline inflation over<br />
In the US, UK and eurozone, headline inflation has<br />
risen sharply over the past six months. As the sharp<br />
falls in food and energy inflation at the end of 2008<br />
have dropped out of the y/y comparison, it has<br />
mechanically pushed headline inflation up from its<br />
lows last summer. In the US and UK, headline CPI<br />
and RPI inflation have risen by around 5pp in just six<br />
months, reaching 2.7% and 3.5% y/y respectively in<br />
December. Eurozone CPI inflation gained around<br />
2pp over the same period to reach 0.9% y/y at the<br />
end of last year.<br />
The bulk of the base effects, however, are now past,<br />
and, on our forecasts, headline inflation is fast<br />
approaching its peaks for the year in all three<br />
countries.<br />
This should be evident in this week’s US CPI release,<br />
where a 0.3% m/m print that we are expecting for the<br />
month would lift the y/y rate by just 0.1pp to 2.8%. In<br />
the breakdown, we expect energy prices to have<br />
risen by 2.4% m/m, and food CPI by 0.2% m/m.<br />
Core inflation, meanwhile, should rise by 0.2% m/m.<br />
Underlying price pressures remain contained, but<br />
metal prices have been trending higher in recent<br />
months, and having surfaced in import and producer<br />
price inflation, have scope to have an impact on the<br />
CPI too. Auto prices would probably be the first CPI<br />
component to be affected by this upside risk.<br />
Otherwise, sluggish shelter prices and plummeting<br />
unit labour costs suggest underlying price pressures<br />
will remain contained.<br />
In the UK, the CPI should post a final month of<br />
accelerating inflation during January. The big story<br />
this month is the return of the rate of VAT to 17½%.<br />
Given the extent of the upward surprise last month,<br />
there is a suggestion that some firms have already<br />
passed on the VAT hike early. However, we also<br />
believe that conservative management of Christmas<br />
inventories has meant that the degree of discounting<br />
was probably less generous than last year.<br />
If there is full pass-through of the VAT hike, this could<br />
add a full percentage point to y/y inflation. However,<br />
several retailers have reported that they will not pass<br />
on the VAT hike, while others have said it will be<br />
deferred. Hence we expect a near ¾%pp addition in<br />
January.<br />
RPI inflation is likely to rise slightly more sharply, not<br />
least given accelerating house price inflation and<br />
base effects related to the mortgage interest<br />
component.<br />
Chart 1: Headline Inflation (US, EZ, UK)<br />
Source: Reuters EcoWin Pro, <strong>BNP</strong> Paribas<br />
Chart 2: US Core CPI & ULCs<br />
Source: Reuters EcoWin Pro, <strong>BNP</strong> Paribas<br />
Chart 3: UK CPI vs. RPI<br />
Source: European Commission, <strong>BNP</strong> Paribas<br />
Luigi Speranza/Eoin O’Callaghan 12 February 2010<br />
<strong>Market</strong> <strong>Mover</strong><br />
26<br />
www.Global<strong>Market</strong>s.bnpparibas.com
Table 1: <strong>BNP</strong> Paribas' Inflation Forecasts<br />
Eurozone<br />
France<br />
US<br />
Headline HICP Ex-tobacco HICP<br />
Headline CPI<br />
Ex-tobacco CPI<br />
CPI Urban SA CPI Urban NSA<br />
Index % m/m % y/y Index % m/m % y/y Index % m/m % y/y index % m/m % y/y Index % m/m % y/y Index % m/m % y/y<br />
2009 108.1 - 0.3 107.9 - 0.2 119.3 - 0.1 118.0 - 0.1 214.6 - -0.3 214.5 - -0.4<br />
2010 (1) 109.5 - 1.3 109.1 - 1.1 120.9 - 1.3 119.5 - 1.3 219.9 - 2.5 219.9 - 2.5<br />
2011 (1) 110.4 - 0.8 109.8 - 0.7 122.1 - 1.0 120.7 - 1.0 222.4 - 1.1 222.4 - 1.1<br />
Q3 2009 108.0 - -0.4 107.8 - -0.5 119.4 - -0.4 118.1 - -0.4 215.2 - -1.6 215.7 - -1.6<br />
Q4 2009 108.6 - 0.4 108.4 - 0.3 119.7 - 0.4 118.4 - 0.3 217.1 - 1.5 216.2 - 1.4<br />
Q1 2010 (1) 108.6 - 1.1 108.3 - 0.9 120.1 - 1.1 118.7 - 1.0 218.6 - 2.8 217.9 - 2.8<br />
Q2 2010 (1) 109.5 - 1.1 109.2 - 0.9 120.8 - 1.1 119.4 - 1.0 219.4 - 2.8 220.5 - 2.9<br />
Q3 2010 (1) 109.4 - 1.3 109.0 - 1.2 121.2 - 1.5 119.8 - 1.4 220.4 - 2.4 220.9 - 2.4<br />
Q4 2010 (1) 110.3 - 1.6 109.9 - 1.5 121.5 - 1.5 120.1 - 1.5 221.4 - 2.0 220.4 - 2.0<br />
Q1 2011 (1) 109.8 - 1.2 109.4 - 1.0 121.7 - 1.3 120.2 - 1.3 221.9 - 1.5 221.2 - 1.5<br />
Q2 2011 (1) 110.6 - 1.0 110.1 - 0.9 122.3 - 1.3 120.9 - 1.2 222.3 - 1.3 223.3 - 1.3<br />
Jul 09 107.8 -0.7 -0.7 107.51 -0.7 -0.8 119.1 -0.4 -0.7 117.80 -0.4 -0.7 214.5 0.0 -1.9 215.35 -0.2 -2.1<br />
Aug 09 108.1 0.3 -0.2 107.89 0.4 -0.3 119.7 0.5 -0.2 118.41 0.5 -0.2 215.4 0.4 -1.4 215.83 0.2 -1.5<br />
Sep 09 108.2 0.0 -0.3 107.91 0.0 -0.5 119.4 -0.2 -0.4 118.12 -0.2 -0.4 215.8 0.2 -1.3 215.97 0.1 -1.3<br />
Oct 09 108.4 0.2 -0.1 108.16 0.2 -0.3 119.5 0.1 -0.2 118.23 0.1 -0.2 216.4 0.3 -0.2 216.18 0.1 -0.2<br />
Nov 09 108.5 0.1 0.5 108.28 0.1 0.4 119.6 0.1 0.4 118.31 0.1 0.3 217.3 0.4 1.9 216.33 0.1 1.8<br />
Dec 09 108.9 0.3 0.9 108.61 0.3 0.8 120.0 0.3 0.9 118.60 0.2 0.8 217.5 0.1 2.8 215.95 -0.2 2.7<br />
Jan 10 (1) 108.1 -0.7 1.1 107.80 -0.7 0.9 119.8 -0.2 1.2 118.41 -0.2 1.1 218.2 0.3 2.9 217.05 0.5 2.8<br />
Feb 10 (1) 108.5 0.3 1.0 108.17 0.3 0.8 120.1 0.3 1.1 118.79 0.3 1.0 218.6 0.2 2.6 217.72 0.3 2.6<br />
Mar 10 (1) 109.1 0.6 1.2 108.80 0.6 1.1 120.4 0.2 1.1 119.02 0.2 1.0 218.9 0.1 2.9 218.91 0.5 2.9<br />
Apr 10 (1) 109.4 0.3 1.1 109.08 0.3 1.0 120.6 0.2 1.1 119.25 0.2 1.1 219.2 0.1 3.1 219.93 0.5 3.1<br />
May 10 (1) 109.5 0.1 1.2 109.20 0.1 1.0 120.8 0.2 1.2 119.45 0.2 1.1 219.4 0.1 3.1 220.60 0.3 3.2<br />
Jun 10 (1) 109.5 0.0 1.0 109.18 0.0 0.8 120.9 0.1 1.1 119.52 0.1 1.0 219.7 0.1 2.4 220.99 0.2 2.5<br />
Jul 10 (1) 109.1 -0.4 1.2 108.69 -0.4 1.1 120.9 0.0 1.5 119.51 0.0 1.5 220.0 0.2 2.6 220.94 0.0 2.6<br />
Aug 10 (1) 109.4 0.3 1.2 108.98 0.3 1.0 121.3 0.4 1.4 119.96 0.4 1.3 220.4 0.2 2.3 220.83 0.0 2.3<br />
Sep 10 (1) 109.8 0.3 1.5 109.37 0.4 1.4 121.3 0.0 1.7 119.99 0.0 1.6 220.8 0.2 2.3 220.95 0.1 2.3<br />
Oct 10 (1) 110.1 0.3 1.6 109.76 0.4 1.5 121.5 0.1 1.6 120.10 0.1 1.6 221.1 0.1 2.2 220.96 0.0 2.2<br />
Nov 10 (1) 110.3 0.1 1.6 109.87 0.1 1.5 121.4 0.0 1.5 120.08 0.0 1.5 221.4 0.1 1.9 220.44 -0.2 1.9<br />
Dec 10 (1) 110.6 0.3 1.6 110.21 0.3 1.5 121.6 0.1 1.3 120.21 0.1 1.4 221.6 0.1 1.9 219.93 -0.2 1.8<br />
Updated<br />
Next<br />
Release<br />
Feb 09<br />
Jan HICP (Feb 26)<br />
Jan 29<br />
Jan CPI (Feb 23)<br />
Feb 08<br />
Jan CPI (Feb 19)<br />
Source: <strong>BNP</strong> Paribas, (1) Forecasts<br />
Chart 4: Eurozone HICP (% y/y)<br />
Chart 5: US Shelter Prices Drive Core CPI Lower<br />
Source: Reuters EcoWin Pro<br />
While headline inflation troughed in July, core inflation is forecast<br />
to continue grinding lower, as the output gap weighs on ex-food,<br />
ex-energy prices.<br />
Source: Reuters EcoWin Pro<br />
The plunge in shelter inflation remains the driver of the underlying<br />
trend in the CPI. Inflation in core goods has eased, however,<br />
following a temporary boost from a series of tobacco tax hikes and<br />
a sharp contraction in vehicle inventories.<br />
Luigi Speranza/Eoin O’Callaghan 12 February 2010<br />
<strong>Market</strong> <strong>Mover</strong><br />
27<br />
www.Global<strong>Market</strong>s.bnpparibas.com
Table 2: <strong>BNP</strong> Paribas' Inflation Forecasts<br />
Japan<br />
UK<br />
Sweden<br />
Core CPI SA<br />
Core CPI NSA<br />
Headline CPI RPI<br />
CPI CPIF<br />
Index % m/m % y/y Index % m/m % y/y Index % m/m % y/y Index % m/m % y/y Index % m/m % y/y Index % m/m % y/y<br />
2009 100.3 - -1.3 100.3 - -1.3 110.8 - 2.1 213.7 - -0.5 299.7 - -0.3 191.2 - 1.9<br />
2010 (1) 98.7 - -1.6 98.7 - -1.6 113.6 - 2.5 221.2 - 3.5 304.8 - 1.7 195.4 - 2.2<br />
2011 (1) 98.4 - -0.4 98.4 - -0.4 114.7 - 1.0 227.3 - 2.7 313.4 - 2.8 199.0 - 1.8<br />
Q3 2009 99.9 - -2.3 100.1 - -2.3 111.3 - 1.5 214.4 - -1.4 299.5 - -1.2 191.6 - 1.6<br />
Q4 2009 99.7 - -1.8 99.9 - -1.8 112.1 - 2.1 216.9 - 0.6 301.3 - -0.4 193.2 - 2.3<br />
Q1 2010 (1) 99.4 - -1.6 99.0 - -1.5 112.8 - 3.1 218.5 - 3.6 301.6 - 1.2 193.7 - 2.5<br />
Q2 2010 (1) 98.6 - -1.9 98.6 - -1.9 113.4 - 2.5 220.8 - 3.8 303.8 - 1.4 195.0 - 2.1<br />
Q3 2010 (1) 98.2 - -1.7 98.4 - -1.7 113.7 - 2.1 221.7 - 3.4 304.8 - 1.8 195.6 - 2.1<br />
Q4 2010 (1) 98.8 - -0.9 99.0 - -0.9 114.4 - 2.0 223.8 - 3.2 308.9 - 2.5 197.4 - 2.2<br />
Q1 2011 (1) 98.8 - -0.7 98.3 - -0.7 114.2 - 1.3 224.7 - 2.9 308.7 - 2.4 197.2 - 1.8<br />
Q2 2011 (1) 98.5 - -0.1 98.5 - -0.1 114.9 - 1.4 227.1 - 2.9 311.8 - 2.6 198.4 - 1.7<br />
Jul 09 100.0 -0.2 -2.2 100.1 -0.2 -2.2 110.9 -0.1 1.8 213.40 0.0 -1.4 298.8 -0.5 -0.9 191.1 -0.2 1.8<br />
Aug 09 99.8 -0.2 -2.4 100.1 0.0 -2.4 111.4 0.5 1.6 214.40 0.5 -1.3 299.4 0.2 -0.8 191.5 0.2 1.9<br />
Sep 09 99.8 0.0 -2.3 100.2 0.1 -2.3 111.5 0.1 1.1 215.30 0.4 -1.4 300.4 0.3 -1.6 192.3 0.4 1.4<br />
Oct 09 99.7 -0.1 -2.3 100.1 -0.1 -2.2 111.7 0.2 1.5 216.00 0.3 -0.8 301.1 0.3 -1.5 193.0 0.3 1.9<br />
Nov 09 99.8 0.1 -1.7 99.9 -0.2 -1.7 112.0 0.3 1.9 216.60 0.3 0.3 301.0 0.0 -0.7 193.0 0.0 2.3<br />
Dec-09 99.7 -0.1 -1.3 99.8 -0.1 -1.3 112.6 0.6 2.9 218.01 0.7 2.4 301.7 0.2 0.9 193.5 0.2 2.7<br />
Jan 10 (1) 99.5 -0.2 -1.4 99.1 -0.7 -1.4 112.6 0.0 3.6 217.63 -0.2 3.6 300.9 -0.3 1.0 193.2 -0.1 2.7<br />
Feb 10 (1) 99.5 0.0 -1.5 98.9 -0.2 -1.5 112.9 0.2 3.0 218.54 0.4 3.4 301.4 0.2 1.2 193.6 0.2 2.4<br />
Mar 10 (1) 99.3 -0.2 -1.7 99.0 0.1 -1.7 112.9 0.0 2.8 219.27 0.3 3.8 302.6 0.4 1.3 194.2 0.3 2.2<br />
Apr 10 (1) 98.6 -0.7 -2.2 98.5 -0.5 -2.2 113.2 0.2 2.8 220.20 0.4 4.1 303.7 0.4 1.5 194.9 0.4 2.3<br />
May 10 (1) 98.7 0.1 -1.8 98.7 0.2 -1.8 113.5 0.3 2.5 220.76 0.3 3.7 303.7 0.0 1.4 194.9 0.0 2.1<br />
Jun 10 (1) 98.4 -0.3 -1.8 98.5 -0.2 -1.8 113.6 0.1 2.3 221.39 0.3 3.7 304.1 0.1 1.3 195.1 0.1 1.9<br />
Jul 10 (1) 98.2 -0.2 -1.8 98.3 -0.2 -1.8 113.1 -0.4 2.0 220.89 -0.2 3.5 303.2 -0.3 1.5 194.6 -0.3 1.8<br />
Aug 10 (1) 98.1 -0.1 -1.7 98.4 0.1 -1.7 114.0 0.8 2.4 221.99 0.5 3.5 304.1 0.3 1.6 195.3 0.4 1.9<br />
Sep 10 (1) 98.2 0.1 -1.6 98.6 0.2 -1.6 114.0 -0.1 2.2 222.36 0.2 3.3 307.2 1.0 2.3 196.8 0.8 2.3<br />
Oct 10 (1) 98.6 0.4 -1.1 99.0 0.4 -1.1 114.3 0.3 2.3 223.37 0.5 3.4 308.7 0.5 2.5 197.4 0.3 2.3<br />
Nov 10 (1) 98.9 0.3 -0.9 99.0 0.0 -0.9 114.3 0.0 2.0 223.55 0.1 3.2 308.5 0.0 2.5 197.5 0.0 2.3<br />
Dec 10 (1) 98.8 -0.1 -0.9 98.9 -0.1 -0.9 114.6 0.2 1.7 224.36 0.4 2.9 309.6 0.3 2.6 197.3 -0.1 1.9<br />
Updated<br />
Next<br />
Release<br />
Jan 29<br />
Jan CPI (Feb 25)<br />
Feb 11<br />
Jan CPI (Feb 16)<br />
Feb 11<br />
Jan CPI (Feb 18)<br />
Source: <strong>BNP</strong> Paribas, (1) Forecasts<br />
Chart 6: Japanese CPI (% y/y)<br />
Chart 7: UK CPI (% y/y)<br />
Source: Reuters EcoWin Pro<br />
Inflation is likely to remain heavily in negative territory for the<br />
foreseeable future.<br />
Source: Reuters EcoWin Pro, <strong>BNP</strong> Paribas<br />
Inflation surprised to the upside in December for the 16 th time in the<br />
past 21 months. We expect CPI inflation to breach the 3% y/y<br />
threshold in January but to moderate subsequently.<br />
Luigi Speranza/Eoin O’Callaghan 12 February 2010<br />
<strong>Market</strong> <strong>Mover</strong><br />
28<br />
www.Global<strong>Market</strong>s.bnpparibas.com
Table 3: <strong>BNP</strong> Paribas' Inflation Forecasts<br />
Canada Norway Australia<br />
CPI Core CPI Headline CPI Core<br />
CPI<br />
Core<br />
Index % q/q % y/y Index % q/q % y/y Index % q/q % y/y Index % q/q % y/y Index % q/q % y/y Index % q/q % y/y<br />
2009 114.4 0.3 113.6 1.8 125.7 2.2 118.4 2.6 167.8 - 1.8 - - 3.7<br />
2010 (1) 116.2 1.6 115.5 1.6 128.3 2.1 120.4 1.7 172.8 - 3.0 - - 2.8<br />
2011 (1) 117.9 1.4 116.8 1.2 131.1 2.1 122.8 2.0 178.5 - 3.3 - - 2.9<br />
Q3 2009 114.7 0.5 -0.9 113.9 1.2 1.6 125.8 0.0 1.8 118.5 0.0 2.4 168.6 1.0 1.3 - - 3.5<br />
Q4 2009 114.9 0.6 0.8 114.4 1.9 1.6 126.6 0.6 1.4 119.3 0.7 2.3 169.5 0.5 2.1 - - 3.4<br />
Q1 2010 (1) 115.3 1.6 1.5 114.8 1.4 1.9 128.0 1.1 2.6 119.5 0.1 2.0 170.5 0.6 2.6 - - 3.1<br />
Q2 2010 (1) 116.0 2.2 1.2 115.3 1.7 1.5 128.6 0.5 2.2 120.6 0.9 1.7 171.9 0.8 2.9 - - 2.7<br />
Q3 2010 (1) 116.6 2.2 1.6 115.7 1.4 1.6 128.0 -0.5 1.7 120.4 -0.1 1.6 173.7 1.0 3.0 - - 2.5<br />
Q4 2010 (1) 117.1 1.6 1.9 116.0 1.2 1.4 128.8 0.6 1.8 121.0 0.4 1.4 175.0 0.8 3.3 - - 2.8<br />
Q1 2011 (1) 117.4 1.2 1.8 116.4 1.2 1.4 129.3 0.4 1.1 121.3 0.2 1.5 176.2 0.7 3.4 - - 2.9<br />
Q2 2011 (1) 117.7 0.9 1.5 116.7 1.0 1.2 130.9 1.2 1.8 122.7 1.2 1.8 177.8 0.9 3.4 - - 2.9<br />
Updated<br />
Feb 05<br />
Feb 10 Jan 27<br />
Next<br />
Release<br />
Jan CPI (Feb 18)<br />
Feb CPI (Mar 10) Q1 CPI (Apr 28)<br />
Source: <strong>BNP</strong> Paribas, (1) Forecasts<br />
Chart 8: Canadian Total vs. Core CPI<br />
Chart 9: Australian CPI (% y/y)<br />
Source: Reuters EcoWin Pro, <strong>BNP</strong> Paribas<br />
After plunging to a 56-year low last July, headline inflation is already<br />
back into positive territory. However, the large amount of spare<br />
capacity and the strong CAD suggest core inflation will continue to<br />
ease well into this year.<br />
Source: Reuters EcoWin Pro, <strong>BNP</strong> Paribas<br />
Underlying inflation is slowing, but remains above the RBA's target<br />
range. While it will continue to moderate, the relatively limited and<br />
diminishing degree of slack in the economy mean underlying<br />
inflation will settle at the top end of the range presenting upside<br />
risks further ahead.<br />
CPI Data Calendar for the Coming Week<br />
Day GMT Economy Indicator Previous<br />
<strong>BNP</strong>P<br />
F’cast<br />
Consensus<br />
Fri 12/03 08:00 Spain CPI (Final) m/m : Jan 0.0% -1.0% -1.0%<br />
08:00 CPI (Final) y/y : Jan 0.8% 1.0% 1.0%<br />
08:00 HICP (Final) m/m : Jan 0.0% -1.0% -1.0%<br />
08:00 HICP (Final) y/y : Jan 0.9% 1.1% 1.1%<br />
Comment<br />
Tue 16/02 09:30 UK CPI m/m : Jan 0.6% 0.0% 0.1% Rising<br />
09:30 CPI y/y : Jan 2.9% 3.6% 3.7%<br />
09:30 RPI y/y : Jan 2.4% 3.6% 3.8%<br />
09:30 RPIX y/y : Jan 3.8% 4.5% 4.6%<br />
Thu 18/02 08:30 Sweden CPI (nsa) m/m : Jan 0.2% -0.3% n/a<br />
08:30 CPI (nsa) y/y : Jan 0.9% 1.0% n/a<br />
08:30 CPIF m/m : Jan 0.2% -0.1% n/a<br />
08:30 CPIF y/y : Jan 2.7% 2.7% n/a<br />
12:00 Canada CPI m/m : Jan -0.3% 0.3% 0.3% Increase<br />
12:00 CPI y/y : Jan 1.3% 2.1% 1.9%<br />
12:00 BoC Core CPI m/m : Jan -0.3% 0.2% 0.0%<br />
12:00 BoC Core CPI y/y : Jan 1.5% 2.1% 1.9%<br />
Fri 19/02 13:30 US CPI m/m : Jan 0.1% 0.3% 0.3% Moderate Increase<br />
13:30 CPI y/y : Jan 2.7% 2.9% 2.8%<br />
13:30 Core CPI m/m : Jan 0.1% 0.2% 0.2%<br />
13:30 Core CPI y/y : Jan 1.8% 1.8% 1.8%<br />
Release dates and forecasts as at c.o.b. prior to the date of publication: See Daily Economic Spotlight for any revision<br />
Source: <strong>BNP</strong> Paribas<br />
Luigi Speranza/Eoin O’Callaghan 12 February 2010<br />
<strong>Market</strong> <strong>Mover</strong><br />
29<br />
www.Global<strong>Market</strong>s.bnpparibas.com
Inflation: BEs Less Sensitive to Credit Fears?<br />
• GLO: Some value in BE, not ASW discounts.<br />
• EUR: 2y (OATei-12) BE rich, 10y fair/cheap.<br />
• USD: Neutral on BE. 30y supply could weigh.<br />
• GBP: Neutral on BE Level & curve into RPI.<br />
GLOBAL: Anticipation of a bailout of Greece has<br />
been supporting global asset markets since early in<br />
the week. Equity and commodity markets have<br />
retraced some of last week’s falls but remain volatile.<br />
As discussed during the initial EGB/sovereign CDS<br />
spread widening, breakevens and ASW discounts<br />
have been less sensitive to credit concerns than<br />
during other stress periods (Q4 ’08 and Mar ’09) like<br />
other asset classes, although they clearly remain a<br />
driving factor of sentiment. Accordingly, breakevens<br />
have rebounded somewhat in Europe but the move<br />
has been relatively muted. Sovereign credit spreads,<br />
asset markets and breakevens are likely to remain<br />
volatile as details of any bailout plan unfold. Given<br />
the improvement in sentiment, we are less negative<br />
on breakevens everywhere but still see limited value<br />
in ASW discounts, particularly in Europe (Chart 1).<br />
We prefer to focus on domestic factors including the<br />
strong negative carry on front-end linkers in EUR,<br />
supply and the Inflation Report in the UK and<br />
upcoming 30y supply in TIPS. Abrupt market moves<br />
have affected liquidity and accentuated relative value<br />
distortions, at least in Europe.<br />
EUR: Slightly flatter inflation curve with expectations<br />
of a bailout. Moves have been messy given the<br />
volatility in EGB spreads. There has been some<br />
evidence of EUR real spread tightening lagging their<br />
nominal counterparts. Ahead of the strong negative<br />
carry in March, 2y breakevens remain exposed<br />
especially the rich OATei-12. OATei-12 BE has<br />
massively outperformed BTPei-12 BE since the start<br />
of February and its 1-Apr BE fwd is (well) above its<br />
10m high whilst OATei-20 BE spot is close to its low<br />
(or middle of the range for 1-Apr fwd). Assuming a<br />
coherent and consistent bailout plan, 10y breakevens<br />
should find support – BUNDei-20 and particularly<br />
BTPei-19 are still cheap vs. the OATei curve. Given<br />
the re-flattening in the inflation curve and RV<br />
considerations, selective 2/10y breakeven<br />
steepeners look attractive – OATei-12/BTPei-19<br />
1-Apr BE spread at flat makes little sense given the<br />
steepness of global inflation curves. That said, the<br />
pricing in of March’s negative carry is typically<br />
complete by the end of February and the risk of<br />
BTPei-19 supply in late February remains. The 5y5y<br />
inflation forward via OATei-15/-20 has quickly<br />
corrected lower following its spike in late<br />
T 1: Moves Since 3 Feb (Pre-Peripheral ‘Crisis’)<br />
January/early February and is now more consistent<br />
with BTPei and inflation swap 5y5y forward<br />
breakevens. Final German HICP at -0.6% m/m<br />
exceeded the preliminary release but Italy’s CPI<br />
came in 0.1% lower. Focus on AFT linker auction on<br />
Thursday. Eurozone and FRF data late in the month.<br />
USD: Breakevens are up but marginally relative to<br />
last week’s tightening. With TIPS BEs looking<br />
relatively rich vs. equities, oil and Treasuries (based<br />
on relationship since April ’09), this is no surprise.<br />
Note, the very front-end (Jan-11) remains attractive<br />
vs. <strong>BNP</strong>P CPI forecasts. Looming 30y TIPS issue on<br />
22 March will be a good test of institutional (LDI)<br />
demand which is not usually prevalent in the US.<br />
10y+ TIPS should remain under pressure until the<br />
supply. CPI NSA expected at +0.5% m/m on Friday.<br />
GBP: Poor performance with real yields up 20bp+<br />
and breakevens down by 5-12bp with 10-15y area<br />
underperforming. The concession ensured a strong<br />
GBP 900mn UKTi-22 tap (b/c of 2.42, premium of<br />
0.5/1bp). The February BoE report was incredibly<br />
dovish on inflation. With SONIA repricing towards<br />
lower rates for longer (consistent with <strong>BNP</strong>P), we<br />
prefer to turn neutral on UK BEs (from bearish) given<br />
conflicting forces of lower base rates (direct RPI<br />
impact vs. inflationary impact) and into Jan RPI data<br />
which tend to surprise (usually to the downside).<br />
Shahid Ladha/ Herve Cros 12 February 2010<br />
<strong>Market</strong> <strong>Mover</strong>, Non-Objective Research Section<br />
30<br />
www.Global<strong>Market</strong>s.bnpparibas.com<br />
Description<br />
FTSE Global<br />
OIL<br />
Change since 03 Feb 2010<br />
-2.8%<br />
-2.8%<br />
(bp) 2y 5y 10y 30y<br />
EUR NY (OATei) -6 -3 -4 -6<br />
EUR NY (BTPei) -26 -8 -7 -5<br />
USD NY -2 -4 -1 1<br />
GBP NY -4 5 8 10<br />
EUR BE (OATei) 2 -8 -10 -6<br />
EUR BE (BTPei) -14 -3 -13 -5<br />
USD BE -11 -10 -13 -12<br />
GBP BE -11 -12 -13 -9<br />
EUR ASW Disc. -6 1 0 0<br />
GBP ASW Dis. -2 2 3 1<br />
USD ASW Disc. 0 -4 5 5<br />
DEM CDS 6<br />
FRF CDS 10<br />
ITL CDS -7<br />
GRK CDS -60<br />
GBP CDS -5<br />
USD CDS 3<br />
Chart 1: BTPei-17 BE, ASW Discount & ITL CDS<br />
100<br />
90<br />
80<br />
70<br />
60<br />
50<br />
40<br />
30<br />
20<br />
10<br />
0<br />
0.8<br />
BTPei-17<br />
1.0<br />
1.2<br />
1.4<br />
1.6<br />
1.8<br />
2.0<br />
2.2<br />
2.4<br />
Breakeven<br />
CDS<br />
2.6<br />
Discount<br />
2.8<br />
Apr-08 Jul-08 Oct-08 Jan-09 Apr-09 Jul-09 Oct-09 Jan-10<br />
All Charts Source: <strong>BNP</strong> Paribas<br />
220<br />
200<br />
180<br />
160<br />
140<br />
120<br />
100<br />
80<br />
60<br />
40<br />
20
Table 1: <strong>BNP</strong> Paribas Carry Analysis<br />
EUR<br />
Pricing Date<br />
11-Feb-10<br />
Term 1<br />
Term 2<br />
3m<br />
6m<br />
12m<br />
Repo Rate<br />
0.37%<br />
0.40%<br />
0.41% 0.51%<br />
0.76%<br />
EUR DRI<br />
108.45679<br />
108.61000<br />
107.80400 108.49289<br />
109.18747<br />
110.05376<br />
FRF DRI<br />
118.46536<br />
118.60000 118.41112<br />
118.90539<br />
119.48748<br />
120.14912<br />
Sett. Date<br />
16-Feb-10<br />
01-Mar-10<br />
01-Apr-10<br />
17-May-10<br />
16-Aug-10<br />
16-Feb-11<br />
Real BE Real BE Real BE Real BE Real BE Real BE<br />
BTANEI Jul-10 -1.21% 1.55% 21.0 21.5 -247.5 -244.4 -191.3 -178.2 -<br />
BTPEI Sep-10 -0.54% 1.29% 20.1 18.0 -157.6 -165.0 -62.1 -80.4 179.0 124.0 - -<br />
OATEI Jul-12 -0.28% 1.53% 5.1 3.5 -30.6 -35.9 -6.6 -17.8 14.8 -7.6 29.3 -12.5<br />
BTPEI Sep-12 0.37% 1.55% 5.7 3.5 -25.3 -33.0 0.9 -15.5 29.3 -4.9 68.5 -5.0<br />
BOBLEI Apr-13 0.31% 1.20% 4.7 3.2 -21.1 -26.2 -0.1 -10.9 21.7 -0.2 47.6 5.9<br />
BTPEI Sep-14 1.07% 1.57% 3.9 1.9 -12.4 -19.3 4.7 -9.8 24.4 -5.2 52.1 -7.7<br />
OATEI Jul-15 0.83% 1.64% 3.1 1.4 -10.9 -16.4 2.8 -8.6 17.7 -5.1 36.1 -8.7<br />
BUNDEI Apr-16 0.97% 1.54% 2.8 1.4 -9.4 -14.3 2.9 -7.2 16.5 -3.8 33.7 -5.8<br />
BTPEI Sep-17 1.72% 1.68% 2.8 1.0 -6.5 -12.5 5.2 -7.2 19.5 -5.5 40.1 -9.2<br />
BTPEI Sep-19 2.10% 1.77% 2.4 0.8 -4.8 -10.2 5.4 -5.8 18.1 -4.4 36.8 -8.0<br />
BUNDEI Apr-20 1.45% 1.78% 2.0 0.8 -5.3 -9.4 3.1 -5.4 12.8 -4.2 25.6 -7.2<br />
OATEI Jul-20 1.54% 1.90% 2.0 0.6 -5.1 -9.7 3.4 -6.1 13.5 -5.6 26.7 -10.4<br />
BTPEI Sep-23 2.43% 1.93% 1.9 0.5 -3.2 -8.1 4.7 -5.4 14.8 -5.5 29.8 -9.7<br />
GGBEI Jul-25 4.38% 1.59% 2.2 0.3 -1.4 -8.2 8.5 -5.5 22.6 -5.6 45.9 -11.5<br />
GGBEI Jul-30 4.41% 1.72% 1.8 0.0 -1.0 -7.5 6.7 -6.7 17.8 -9.5 35.7 -19.7<br />
OATEI Jul-32 1.78% 2.30% 1.1 0.2 -2.7 -5.9 2.2 -4.4 8.0 -5.3 15.5 -10.0<br />
BTPEI Sep-35 2.32% 2.43% 1.1 0.0 -2.0 -5.7 2.6 -5.1 8.4 -7.0 16.5 -13.2<br />
OATEI Jul-40 1.75% 2.37% 0.8 0.0 -1.9 -4.6 1.6 -3.9 5.7 -5.0 10.9 -9.5<br />
BTPEI Sep-41 2.54% 2.28% 1.0 0.0 -1.6 -5.0 2.6 -4.3 7.9 -5.9 15.6 -11.4<br />
FRF<br />
Source: <strong>BNP</strong> Paribas<br />
OATI Jul-11 -0.73% 1.45% 5.2 4.1 -14.4 -18.2 7.3 -1.0 25.6 10.7 -21.4 8.0<br />
OATI Jul-13 0.01% 1.70% 3.0 1.4 -3.1 -8.7 8.9 -2.8 21.7 -1.7 28.1 -17.5<br />
OATI Jul-17 1.06% 1.90% 1.9 0.4 0.4 -4.7 7.7 -2.7 17.1 -3.6 27.7 -12.9<br />
OATI Jul-19 1.35% 2.00% 1.7 0.3 0.7 -4.1 7.0 -2.8 15.4 -4.2 25.4 -12.8<br />
OATI Jul-23 1.69% 2.13% 1.4 0.2 0.9 -3.1 6.0 -2.2 13.0 -3.6 21.7 -10.2<br />
OATI Jul-29 1.76% 2.27% 1.1 0.0 0.8 -2.9 4.8 -2.5 10.4 -4.1 17.2 -10.7<br />
USD<br />
Pricing Date<br />
11-Feb-10<br />
Term 1<br />
Term 2<br />
3m<br />
6m<br />
12m<br />
Repo Rate<br />
0.14%<br />
0.15%<br />
0.17% 0.21%<br />
0.39%<br />
USD DRI<br />
216.18032<br />
215.94900<br />
217.05358<br />
218.14008<br />
220.73697<br />
220.20611<br />
Sett. Date<br />
12-Feb-10<br />
01-Mar-10<br />
01-Apr-10<br />
12-May-10 12-Aug-10 14-Feb-11<br />
Yield BE Real BE Real BE Real BE Real BE Real BE<br />
TIPS Apr-10 -1.74% 1.80% -157.4 -154.2 398.0 430.4 - - - - - -<br />
TIPS Jan-11 -0.97% 1.32% -18.3 -19.4 32.4 29.1 92.8 86.2 358.5 343.1 - -<br />
TIPS Apr-11 -0.76% 1.24% -13.4 -14.8 27.6 23.4 73.7 65.6 240.1 221.9 427.9 386.1<br />
TIPS Jan-12 -0.50% 1.37% -7.5 -9.3 18.2 12.8 45.3 35.0 125.4 102.5 109.5 58.5<br />
TIPS Apr-12 -0.38% 1.36% -6.3 -8.2 16.7 11.1 40.8 30.0 109.2 86.0 95.3 43.3<br />
TIPS Jul-12 -0.42% 1.51% -5.8 -7.7 14.7 9.2 36.0 25.4 95.3 72.3 77.0 27.4<br />
TIPS Apr-13 -0.20% 1.71% -4.0 -6.1 11.9 5.7 28.0 16.3 71.0 46.0 58.7 4.6<br />
TIPS Jul-13 -0.03% 1.66% -3.5 -5.7 11.9 5.7 27.7 15.9 69.5 44.1 61.6 7.8<br />
TIPS Jan-14 0.23% 1.64% -2.7 -4.9 11.3 5.0 25.9 13.9 63.6 38.1 60.6 6.8<br />
TIPS Apr-14 0.20% 1.83% -2.6 -4.8 10.4 4.0 23.8 11.8 58.1 32.9 53.9 0.3<br />
TIPS Jul-14 0.36% 1.72% -2.3 -4.5 10.5 4.1 23.7 11.7 57.5 32.1 55.9 2.8<br />
TIPS Jan-15 0.57% 1.78% -1.9 -4.1 10.0 3.4 22.3 9.9 53.3 27.2 54.2 -0.1<br />
TIPS Jul-15 0.64% 1.92% -1.6 -3.9 9.3 2.7 20.7 8.2 49.2 22.9 50.4 -4.1<br />
TIPS Jan-16 0.83% 1.91% -1.3 -3.6 9.0 2.4 19.9 7.5 46.9 20.8 49.8 -4.1<br />
TIPS Jul-16 0.89% 2.02% -1.2 -3.5 8.6 2.0 18.9 6.5 44.3 18.3 47.4 -6.3<br />
TIPS Jan-17 1.04% 2.03% -1.0 -3.3 8.3 1.8 18.2 5.9 42.3 16.6 46.3 -6.5<br />
TIPS Jul-17 1.09% 2.14% -0.9 -3.2 7.9 1.4 17.3 5.1 40.1 14.6 44.0 -8.2<br />
TIPS Jan-18 1.19% 2.20% -0.8 -3.0 7.4 1.2 16.1 4.4 37.1 12.7 41.2 -8.6<br />
TIPS Jul-18 1.24% 2.26% -0.7 -2.9 7.0 0.8 15.2 3.5 35.0 10.6 39.0 -10.6<br />
TIPS Jan-19 1.33% 2.29% -0.6 -2.7 7.0 1.1 15.0 4.0 34.5 11.6 39.0 -7.6<br />
TIPS Jul-19 1.38% 2.31% -0.6 -2.7 6.7 0.7 14.3 3.2 32.7 9.7 37.1 -9.5<br />
TIPS Jan-20 1.43% 2.27% -0.5 -2.6 6.3 0.5 13.5 2.6 30.8 8.6 35.1 -10.3<br />
TIPS Jan-25 1.96% 2.34% -0.2 -2.1 5.2 -0.4 10.9 0.4 24.4 2.8 29.5 -13.9<br />
TIPS Jan-26 2.00% 2.39% -0.1 -2.0 4.8 -0.4 10.2 0.4 22.8 2.6 27.5 -12.9<br />
TIPS Jan-27 2.05% 2.37% -0.1 -2.0 4.7 -0.4 10.0 0.3 22.3 2.4 27.0 -12.7<br />
TIPS Jan-28 2.08% 2.38% -0.1 -1.9 4.4 -0.7 9.2 -0.3 20.5 1.4 24.9 -13.5<br />
TIPS Apr-28 2.12% 2.38% -0.1 -1.8 4.9 0.1 10.2 1.2 22.7 4.2 27.8 -9.1<br />
TIPS Jan-29 2.10% 2.42% -0.1 -1.8 4.4 -0.3 9.2 0.5 20.6 2.6 25.1 -10.9<br />
TIPS Apr-29 2.12% 2.40% -0.1 -1.8 4.7 0.0 9.9 1.1 22.0 3.9 26.9 -9.1<br />
TIPS Apr-32 2.11% 2.43% -0.1 -1.7 4.1 -0.4 8.6 0.2 19.1 2.0 23.3 -10.9<br />
GBP<br />
Pricing Date<br />
11-Feb-10 Term 1<br />
Term 2<br />
3m<br />
6m<br />
12m<br />
Repo Rate<br />
0.51%<br />
0.50%<br />
0.53%<br />
0.58%<br />
0.75%<br />
Sett. Date<br />
12-Feb-10<br />
01-Mar-10<br />
01-Apr-10<br />
12-May-10<br />
12-Aug-10<br />
14-Feb-11<br />
Yield BE Real BE Real BE Real BE Real BE Real BE<br />
UKTi Aug-11 -1.05% 1.71% -29.7 -30.4 -10.7 -12.9 7.2 3.3 62.0 55.7 491.1 643.7<br />
UKTi Aug-13 -0.20% 2.32% -12.0 -14.4 -1.2 -8.2 9.5 -3.5 36.5 9.1 77.0 17.0<br />
UKTi Jul-16 0.74% 2.59% -6.0 -8.3 1.5 -5.1 9.2 -3.1 27.7 2.2 55.5 2.0<br />
UKTi Nov-17 0.89% 2.79% 5.6 3.3 2.5 -3.9 10.6 -1.2 26.2 1.8 48.7 -2.0<br />
UKTi Apr-20 1.19% 2.83% -3.7 -5.8 1.6 -4.2 7.2 -3.6 20.2 -2.0 40.0 -5.8<br />
UKTi Nov-22 1.23% 3.16% 3.8 2.0 2.0 -2.8 7.5 -1.4 18.1 0.0 33.2 -3.8<br />
UKTi Jul-24 1.28% 3.10% -2.7 -4.4 1.3 -3.5 5.5 -3.4 15.2 -3.0 29.4 -7.6<br />
UKTi Nov-27 1.19% 3.21% 2.7 1.2 1.4 -2.8 5.3 -2.5 12.7 -3.1 22.9 -8.8<br />
UKTi Jul-30 1.18% 3.25% -2.2 -3.5 1.0 -2.7 4.2 -2.6 11.8 -2.0 22.5 -5.0<br />
UKTi Nov-32 1.07% 3.36% 2.1 0.8 1.0 -2.6 4.1 -2.7 9.8 -4.0 17.6 -10.0<br />
UKTi Jan-35 1.03% 3.42% -1.7 -2.9 0.6 -2.8 3.0 -3.2 8.5 -4.1 16.0 -9.3<br />
UKTi Nov-37 0.92% 3.51% 1.7 0.6 0.8 -2.5 3.2 -2.8 7.8 -4.4 13.8 -10.6<br />
UKTi Nov-42 0.82% 3.60% 1.4 0.3 0.6 -2.4 2.5 -3.1 6.1 -5.2 10.7 -11.8<br />
UKTi Nov-47 0.70% 3.68% 1.2 0.2 0.5 -2.3 2.2 -3.0 5.3 -5.2 9.2 -11.6<br />
UKTi Mar-50 0.69% 3.68% 1.1 0.2 0.4 -2.3 2.0 -3.1 4.8 -5.3 8.3 -11.7<br />
UKTi Nov-55 0.66% 3.67% 1.1 0.2 0.4 -2.1 2.0 -2.8 4.8 -4.8 8.3 -10.6<br />
JPY<br />
Pricing Date<br />
11-Feb-10<br />
Term 1 Term 2<br />
3m<br />
6m<br />
12m<br />
Repo Rate<br />
0.12%<br />
0.12%<br />
0.12%<br />
0.13% 0.14%<br />
JPY DRI<br />
99.879<br />
99.800<br />
99.100<br />
98.923<br />
98.661 98.979<br />
Sett. Date<br />
16-Feb-10<br />
10-Mar-10<br />
10-Apr-10<br />
17-May-10<br />
16-Aug-10<br />
16-Feb-11<br />
Yield BE Yield BE Yield BE Real BE Real BE Real BE<br />
JGBI-1 Mar-14 1.37% -0.96% -0.6 -1.1 -16.4 -17.5 -18.9 -20.7 -17.4 -21.2 10.2 1.5<br />
JGBI-2 Jun-14 1.34% -0.90% -0.6 -1.0 -15.4 -16.5 -17.7 -19.7 -16.4 -20.4 8.8 -0.3<br />
JGBI-3 Dec-14 1.34% -0.83% -0.5 -1.0 -13.7 -14.9 -15.7 -17.9 -14.4 -18.9 7.5 -2.3<br />
JGBI-4 Jun-15 1.42% -0.85% -0.3 -0.9 -12.0 -13.3 -13.6 -15.9 -11.9 -16.6 8.7 -1.6<br />
JGBI-5 Sep-15 1.30% -0.68% -0.5 -1.1 -12.0 -13.4 -13.8 -16.2 -12.8 -17.7 5.4 -5.3<br />
JGBI-6 Dec-15 1.37% -0.72% -0.4 -1.0 -11.3 -12.7 -12.9 -15.3 -11.5 -16.6 6.8 -4.3<br />
JGBI-7 Mar-16 1.40% -0.70% -0.4 -1.0 -10.8 -12.3 -12.3 -14.8 -10.8 -16.1 6.8 -4.6<br />
JGBI-8 Jun-16 1.54% -0.81% -0.2 -0.8 -10.0 -11.6 -11.2 -13.8 -9.1 -14.5 9.4 -2.2<br />
JGBI-9 Sep-16 1.45% -0.68% -0.3 -1.0 -10.0 -11.5 -11.2 -13.9 -9.6 -15.2 7.3 -4.6<br />
JGBI-10 Dec-16 1.47% -0.66% -0.2 -0.9 -9.6 -11.2 -10.8 -13.5 -9.1 -14.8 7.3 -4.9<br />
JGBI-11 Mar-17 1.53% -0.67% -0.2 -0.9 -9.1 -10.8 -10.2 -13.0 -8.3 -14.2 8.0 -4.4<br />
JGBI-12 Jun-17 1.60% -0.69% -0.1 -0.8 -8.6 -10.3 -9.5 -12.4 -7.4 -13.4 9.0 -3.8<br />
JGBI-13 Sep-17 1.59% -0.64% -0.2 -0.9 -8.5 -10.2 -9.3 -12.3 -7.4 -13.5 8.4 -4.6<br />
JGBI-14 Dec-17 1.62% -0.63% -0.1 -0.8 -8.1 -9.9 -8.9 -12.0 -6.9 -13.1 8.5 -4.6<br />
JGBI-15 Mar-18 1.65% -0.62% -0.1 -0.8 -8.0 -9.7 -8.7 -11.7 -6.7 -12.8 8.6 -4.5<br />
JGBI-16 June-18 1.71% -0.64% 0.0 -0.8 -7.6 -9.4 -8.2 -11.4 -6.0 -12.4 9.3 -4.3<br />
Shahid Ladha/ Herve Cros 12 February 2010<br />
<strong>Market</strong> <strong>Mover</strong>, Non-Objective Research Section<br />
31<br />
www.Global<strong>Market</strong>s.bnpparibas.com
Europe ITraxx Credit Indices<br />
• Outright: the positive newsflow is allowing<br />
MAIN to squeeze tighter but we are very<br />
doubtful it can break 80. We advise to be very<br />
slightly long with the objective to position a<br />
short between 82 and 83.<br />
• Update on curves: 5/10s in MAIN, FIN SEN<br />
and SUB have experienced sharp flattening and<br />
are now lagging in the market recovery. In<br />
addition, they trade significantly below intrinsic<br />
value. Steepeners make sense, MAIN 5/10 at +12<br />
in particular; it has an asymmetric<br />
upside/downside, pays about 1.2bp of<br />
breakeven per month and its negative convexity<br />
is trivial.<br />
• MAIN/SEN: this spread differential remains<br />
extremely directional; it has reached a new<br />
extreme point of -13.5 this week and is now<br />
lagging in the rally. SOVX at 92 implies a<br />
MAIN/SEN differential at 7.5bp, i.e. 1.5bp tighter<br />
than the current market. Recompression is a<br />
good opportunity for bullish players only.<br />
• MAIN/XO: the XO/MAIN ratio is yo-yoing with<br />
the market: lower when spreads widen and<br />
higher when spreads tighten. Our lack of<br />
conviction on the overall market direction<br />
makes the decompression trade hazardous,<br />
even if very attractive on a pure historical basis.<br />
In this context, we much prefer the beta-hedged<br />
trade (with a ratio of x4); it presents a very<br />
asymmetric risk/reward with a very manageable<br />
negative carry (2.5bp breakeven per month).<br />
Slightly weaker results in the XO basket than in<br />
the aggregated market are also supportive of<br />
the trade.<br />
Outright<br />
Indices have retraced quite sharply on the back of<br />
the positive newsflow regarding the bailout of<br />
Greece; movements have been amplified by the fact<br />
that the street was short, expecting the agreement<br />
between EU officials to make much more time. The<br />
details of the bailout still need to be detailed but no<br />
one can deny both news and reactivity are not<br />
positive signals.<br />
Chart 1: Changes in 5/10y Curves Since 31 -<br />
Dec and 11- Jan (Bottom of <strong>Market</strong>)<br />
5/10y<br />
Current<br />
5/10y<br />
11-Jan<br />
Chg vs.<br />
11-Jan<br />
5/10y<br />
31-Dec<br />
Chg vs.<br />
31-Dec<br />
MAIN s12 +12.0 +20.5 -8.5 +19.25 -7.25<br />
FIN SEN s12 +3.0 +17.0 -14.0 +13.0 -10.0<br />
FIN SUB s12 +4.0 +17.0 -13.0 +13.0 -9.0<br />
MAIN s12 +12.0 +20.5 -8.5 +19.25 -7.25<br />
Source: <strong>BNP</strong> Paribas<br />
That being said, the pressure on sovereign is not<br />
something that we can put behind us. During<br />
Moody’s conference call on Wednesday, the rating<br />
agency reminded the market that Greece could be<br />
downgraded further in coming months should the<br />
planned budget reforms not be fully implemented.<br />
The Greek government will obviously meet internal<br />
resistances and Portugal, Spain and to a lesser<br />
extent Italy remain good wild cards.<br />
What’s the call?<br />
The retracement in iTraxx indices has been massive<br />
and MAIN is now trading at 86, just 1bp above 85<br />
which will be a psychological level difficult to break.<br />
Technical analysis indicates different resistance<br />
levels at 83, 82 and 81bp. Moreover, regressions<br />
between credit and equity indices imply that MAIN<br />
should trade around the 81 mark even it the level of<br />
correlation between the two markets has significantly<br />
decreased.<br />
All in all, MAIN could continue to benefit from the<br />
positive newsflow but we doubt it will break 80. Now<br />
the big squeeze has cleaned the market from its big<br />
short positions, we expect players to reposition<br />
shorts between 85 and 80. We are positive on the<br />
very short term with a close target at 83, level where<br />
the short will offer a much more attractive risk/reward<br />
profile.<br />
Pierre Yves Bretonniere 12 February 2010<br />
<strong>Market</strong> <strong>Mover</strong>, Non-Objective Research Section<br />
32<br />
www.Global<strong>Market</strong>s.bnpparibas.com
Update on curves<br />
5/10y indices’ curves have experienced a massive<br />
flattening this week, in harmony with the widening of<br />
the outright levels. Taking the MAIN and FIN SEN<br />
and SUB as references – they are the only liquid<br />
curves – the extent of the flattening is of 4bp for<br />
MAIN and 6bp for both SEN and SUB financial<br />
indices. From the tightest of the market (65bp for<br />
MAIN 5y and 63bp for SEN 5y reached the 11-Jan),<br />
which also corresponds to the steepest level of 5/10y<br />
curves (20.5bp for MAIN and 17bp for SEN), the<br />
retracements are quite impressive. They are of 9bp<br />
in MAIN, 14bp in SEN and 13bp in SUB!<br />
While 5/10y curves were perfectly correlated to the<br />
outright level of the 5y before the last leg of volatility,<br />
there has been some de-correlation recently. With<br />
the market essentially focussed on the outright,<br />
curves are becoming more illiquid, which has the<br />
consequence of making their moves brutal and<br />
excessive.<br />
Note that the latest moves wider in MAIN have not<br />
implied further flattening in 5/10y which seems to<br />
indicate that MAIN 5/10y found a resistance at 10bp<br />
(Chart1). It has not been the case in FIN SEN and<br />
SUB curves given the higher stress on the banking<br />
sector. This pattern is quite new and contrasts with<br />
the past behaviour of financials single-names’ and<br />
indices’ curves, consistently less volatile than nonfinancials<br />
ones (Chart 2).<br />
Last but not least, curves trade significantly flatter<br />
than their intrinsic; the differences are of c.3bp in<br />
MAIN, c.6bp in SEN and c.3bp in SUB.<br />
What’s next?<br />
At +12, we find the 5/10y steepener in MAIN<br />
relatively attractive. Given the insignificant lack of<br />
jump-to-default risk on all of its 125 constituents and<br />
our perception that the street position is much less<br />
crowed with the steepener, we see downside risks<br />
relatively limited. The curve can possibly reach +5<br />
but that would occur only if there is a massive selloff,<br />
pushing MAIN in the [120-130] range. The key<br />
points supporting the trade remain: (1) a good level<br />
of carry thanks to the widening of the outright and the<br />
flattening of the curve (about 1.2bp of performance<br />
per month) and (2) the fact that the supply in nonfinancials,<br />
which represent 80% of the index, is<br />
skewed towards longer maturities.<br />
Update on “MAIN vs. SEN”<br />
The turnaround of the market has made all indices<br />
gap tighter, the obvious outperformers being SOVX,<br />
FIN SEN and finally MAIN. In the short-squeeze, the<br />
spread differential MAIN – FIN SEN re-steepened but<br />
by less than what was implied by the sharp drop in<br />
Chart 1: 5/10y MAIN vs. Outright 5y in Series 12<br />
5/10y<br />
23<br />
21<br />
19<br />
17<br />
15<br />
13<br />
11<br />
9<br />
7<br />
5/10Y MAIN 12 (lhs)<br />
5Y MAIN 12 (rhs inverted)<br />
60<br />
65<br />
70<br />
75<br />
80<br />
85<br />
90<br />
95<br />
100<br />
5<br />
105<br />
09/09 10/09 10/09 11/09 11/09 11/09 12/09 12/09 01/10 01/10 02/10<br />
Chart 2: 5/10y MAIN, SEN and SUB in Series 11<br />
30<br />
20<br />
10<br />
0<br />
-10<br />
-20<br />
-30<br />
3/09 4/09 5/09 6/09 7/09 8/09 9/09 10/09 11/09 12/09 1/10<br />
MAIN _ FIN SEN<br />
-<br />
20<br />
15<br />
10<br />
5<br />
-5<br />
-10<br />
-15<br />
-20<br />
MAIN s11<br />
FIN SEN s11<br />
FIN SUB s11<br />
Chart 3: MAIN – FIN SEN vs. SOVX<br />
y = -0.3963x + 28.857<br />
R 2 = 0.9411<br />
40 50 60 70 80 90 100 110 120<br />
Source: <strong>BNP</strong> Paribas<br />
"Fair-vlaue" MAIN<br />
- FIN SEN<br />
SOVX<br />
SOVX, which is evidenced on Chart4, where the last<br />
point corresponds to 10-Feb closing levels. At the<br />
time of writing, the spread MAIN - FIN-SEN stands at<br />
-9bp, about 1.5bp above the spread implied by the<br />
current level of SOVX (92). The “fair-value” spread is<br />
-7.5bp.<br />
What’s next?<br />
It is extremely difficult to have a strong call on this<br />
spread given its strong directionality. That being said,<br />
investors with a constructive view on the market can<br />
play further tightening given its relative<br />
underperformance. We do not expect SOVX to break<br />
mid-January level (85) which implies that the spread<br />
MAIN – FIN SEN is likely to stay below -5bp. From<br />
Last<br />
5y<br />
Since Sep-09<br />
Pierre Yves Bretonniere 12 February 2010<br />
<strong>Market</strong> <strong>Mover</strong> Non-Objective Research Section<br />
33<br />
www.Global<strong>Market</strong>s.bnpparibas.com
current level (-9bp), the maximum upside is therefore<br />
4bp. Maximum downside is also 4bp, should the<br />
spread come back to 9-Feb level (-13.5bp).<br />
Update on “MAIN vs. XO”<br />
Over the past week, there have been big swings in<br />
the XO/MAIN relationship with, first, a collapse of<br />
ratio to a new historical low (x5.24) and then an<br />
increase to x5.44 in the market rally. Obviously, this<br />
ratio is directional and the MAIN/XO decompression<br />
trade based on the spread ratio between the two<br />
indices is bullish.<br />
While the decompression trade looks attractive on a<br />
pure historical basis, our lack of conviction on the<br />
direction of the market prevents us from advising to<br />
play the XO/MAIN relationship based on the spread<br />
ratio. However, if weights are adjusted with the 1-<br />
month historical beta (x3.94) – which is much lower<br />
than the 1-year beta (x5.5), see Chart 6 – the trade<br />
makes more sense.<br />
Lastly, the reporting season is not boding particularly<br />
well for the constituents of the XO index. Amongst its<br />
50 members, 18 reported so far and, on average,<br />
results have been just in line with expectations. It is a<br />
tad weaker than the overall market; taking the<br />
EUROSTOXX 600 as a reference, the ratio of<br />
positive vs. negative surprises comes at 60%/40%.<br />
What’s next?<br />
Based on a ratio of x4, the XO/MAIN decompression<br />
trade offers a very asymmetric upside/downside<br />
profile and should be relatively immune to market<br />
swings. The negative carry of the position is of -<br />
125bp running per year, equivalent to 2.5bp of<br />
breakeven per month, which is trivial in relation to the<br />
volatility of the strategy.<br />
Chart 4:<br />
MAIN – FIN SEN Differential History<br />
50<br />
iTraxx s12: MAIN x1 - Fin Sen<br />
Q1 (6m)<br />
FIN SEN Tight<br />
40<br />
Median (6m)<br />
Q3 (6m)<br />
30<br />
20<br />
10<br />
-<br />
-10<br />
-20<br />
-30<br />
FIN SEN Wide<br />
-40<br />
1/09 2/09 3/09 4/09 5/09 6/09 7/09 8/09 9/09 10/09 11/09 12/09 1/10 2/10<br />
8.0<br />
7.5<br />
7.0<br />
6.5<br />
6.0<br />
5.5<br />
5.0<br />
Chart 5:<br />
XO / MAIN Spread Ratio History<br />
XO / MAIN<br />
XO wide<br />
XO tight<br />
4.5<br />
10/08 12/08 2/09 4/09 6/09 8/09 10/09 12/09 2/10<br />
XO<br />
Chart 6:<br />
1,250<br />
1,150<br />
1,050<br />
950<br />
850<br />
750<br />
650<br />
550<br />
450<br />
MAIN vs. XO Historical Betas<br />
XO Wide<br />
y = 3.9403x + 127.04<br />
y = 5.33x + 166.82<br />
R 2 = 0.8949<br />
350<br />
60 80 100 120 140 160 180 200<br />
MST<br />
XO Tight<br />
Last<br />
3M-2M<br />
12M-3M<br />
1M<br />
Source: <strong>BNP</strong> Paribas<br />
Pierre Yves Bretonniere 12 February 2010<br />
<strong>Market</strong> <strong>Mover</strong> Non-Objective Research Section<br />
34<br />
www.Global<strong>Market</strong>s.bnpparibas.com
Technical Analysis – Interest Rates & Commodities<br />
Bond & Short-Term Contracts<br />
• Europe: ST pullback on key 3.09/12 area may be over but a further rebound is needed to rekindle MT rising bias<br />
• US: ST pullback seen on key 3.50/55 area & market is now trying to resume MT rising bias towards 4% initially<br />
• Short-term contracts m0: Still a MT supportive bias but ST bias remains toppish/slightly consolidative<br />
Equities & Commodities<br />
• WTI (Cl1): Rebounded slightly above its MT rising channel support, but be beware of a renewed break below it<br />
• Equity markets: ST bias turned consolidative given break of MT rising pattern’s supports<br />
US 10y: Bottoming from MT falling channel resistance towards 3.80/4.0% MT Trend: Up Range: 3.60/3.85<br />
The break above the MT falling channel<br />
pattern in December strengthened the MT<br />
rising scenario which still calls for 4.35 (MT<br />
theoretical target)<br />
The recent ST pullback, which allowed a<br />
return to its 3.534 resistance support area,<br />
could be over and US 10y is now seen<br />
correcting its January down move towards<br />
3.766 (ST 61.8%) initially<br />
However, to regain a MT weak bias, it still<br />
needs to overcome 3.814 (H&S neckline)<br />
initially, then 4.0 (June 09 top) & 4.067 (LT<br />
61.8%)<br />
3.152 ⇐ 3.441 ⇐ 3.534 –!– 3.766 ⇒ 3.814 ⇒ 4.00/4.067<br />
Tech Snapshot<br />
- Above weekly falling flag (2.826/3.534)<br />
- MT rising wave “5” scenario still developing<br />
- Bottom H&S pattern (neckline 3.814)<br />
Strategy: Used dips within 3.55/65 to reenter<br />
short side, S/L 3.50, for 4.00/4.35 &/or<br />
add above 3.814 neckline S/L 3.70<br />
EUR 2/30y swap: Risk towards 200 area once current pullback is over MT Trend: Down Range: 200/220<br />
Last rebound failed to overcome the MT<br />
61.8% (224.1) & it has broken below MT<br />
rising wedge support (224.00) & ST rising<br />
channel support (218.6). That increased the<br />
risk of developing at least a ST flattening<br />
bias towards 200 area (theoretical target of<br />
ST rising channel break). A classic pullback<br />
sent it back on ST channel support but risk<br />
remains to the downside & first bearish<br />
confirmation would come from a renewed<br />
break below 209.4 (61.8% of recent rise). If<br />
fall then extends beyond the 200 area, risk<br />
will be to extend MT flattening bias towards<br />
170/175 area (theoretical target of MT rising<br />
wedge break & MT 61.8%)<br />
187.8 ⇐ 199.5 ⇐ 209.4 –!– 218.6 ⇒ 224.0/224.1 ⇒ 239.2<br />
Tech Snapshot<br />
- MT rising wedge support break (224.0)<br />
- ST rising channel support break (218.6)<br />
STRATEGY: Short 216/222 stopped 212.<br />
Resell 218/222, S/L 226, for 200 & 180<br />
Christian Sené 12 February 2010<br />
<strong>Market</strong> <strong>Mover</strong>, Non-Objective Research Section<br />
35<br />
www.Global<strong>Market</strong>s.bnpparibas.com
10Y Germany: ST bottoming/up tone from critical 3.09/3.12 area MT Trend: Bottoming/Up Range: 3.17/3.35<br />
Technical pullback extended below key<br />
3.193 (old MT 61.8%) to reach key<br />
3.093/127 (October low & MT slight rising<br />
channel support) from which it is trying to<br />
rebound<br />
This area should be the base for resumption<br />
of previous MT weak bias (theoretical target<br />
is 3.70) but decisive breaks above 3.307<br />
(61.8%) & then 3.37 MT falling resistance)<br />
are needed to be confirmed with a break<br />
above 3.433 (top)<br />
3.093/3.108 ⇐ 3.127 ⇐ 3.193 –!– 3.307 ⇒ 3.37 ⇒ 3.433 ⇒ 3.498<br />
Tech Snapshot<br />
- Rebound from key 3.093/3.127 (October<br />
low & MT rising channel support)<br />
- Bottoming/up around key MT 61.8% (3.193)<br />
Strategy: Short 3.20/23 stopped 3.15. Reenter<br />
short within 3.15/20 for 3.45/70. S/L<br />
below 3.09<br />
UK 10y: Pullback on 3.80 may be over given ST flag resistance break MT Trend: Up Range: 3.90/4.15<br />
Break above 3.78 (MT falling channel res) a<br />
month ago strengthened the MT rising<br />
scenario towards 4.30/4.50 theoretical target<br />
area but it stalled around key 4.084 (June 09<br />
top) & then developed a technical pullback<br />
on 3.80 area. This move seems over & MT<br />
rise should now resume given break above<br />
3.942 (ST falling channel res) although a<br />
decisive break above 4.084/114 (tops) is<br />
needed to rekindle previous MT up bias<br />
3.644 ⇐ 3.723 ⇐ 3.78 –!– 4.001 ⇒ 4.084/114 ⇒ 4.248 ⇒ 4.559<br />
Tech Snapshot<br />
- 3.78 (MT falling channel res) broken<br />
- Stalled on 4.084 (wave “A” top)<br />
- ST falling flag (3.756/3.944) breakout<br />
Strategy: Retried short within 3.80/3.85,<br />
S/L 3.74, for 4.10/4.50<br />
S&P: Question is: is corrective wave “4” over as target stays at 1000? MT Trend: Consolidative/up Range: 1040/1100<br />
Break below MT rising wedge support & ST<br />
rising channel support (1170) opened the ST<br />
way down towards 1009 (theoretical target &<br />
6-months’ 61.8%). As it is rebounding from<br />
ST 38.2% (1043), the question is whether<br />
corrective wave “4” is over. There are now 3<br />
possibilities. First is to continue the fall<br />
directly to 1000 target area. Second is to see<br />
a ST rebound before it falls again (ABC) to<br />
reach this 1000 area. Third is that the wave<br />
“4” is over & wave “5” is now starting for key<br />
1228 (LT 61.8%). For the time being, we<br />
think the risk lies between the first two<br />
965/976 ⇐ 1010 ⇐ 1043 –!– 1095 ⇒ 1110 ⇒ 1150<br />
Tech Snapshot<br />
- MT rising wedge break<br />
- ST rising channel break<br />
Strategy: Wait for a rebound around 1100<br />
/10 to try a short again S/L 1130 for 1010/40<br />
Christian Sené 12 February 2010<br />
<strong>Market</strong> <strong>Mover</strong>, Non-Objective Research Section<br />
36<br />
www.Global<strong>Market</strong>s.bnpparibas.com
Trade Reviews<br />
Options, Money <strong>Market</strong> and Bond Trades – Tactical & Strategic Trades<br />
This page summarises our main tactical (T) and strategic (S) trades. The former focus on short-term horizons (a few weeks)<br />
allowing one to play any near-term corrections within a defined trend, while the latter rely on a medium-term assumed trend.<br />
For each trade we provide the expected target and the recommended stop loss.<br />
Current* Targets Stop Entry<br />
Closed Strategies<br />
Sovereign CDS Buy SovX 5Y<br />
Trade closed (10/2). PnL: EUR +76k.<br />
Existing Strategies<br />
Yield Curves<br />
USD Butterfly Pay USD 2M-fwd 2y3y5y<br />
Near low end of historical range. We are positioned for a Fed on hold and this is an<br />
ideal hedge. Negative carry/roll is less in forward than spot.<br />
Money <strong>Market</strong>s<br />
Euribor Spread Buy ERM0M1<br />
Front curve on tech support and unch ECB with Eonia normalisation now fully priced<br />
in.<br />
Euribor Basis Buy ERM0 Basis<br />
OIS/Bor spreads are at very interesting entry levels compared to the evolution of<br />
CDS and other risk indicators. Moreover, ECB liquidity volatility should be<br />
supportive of this strategy.<br />
Eurodollar Spread Buy EDZ0Z1<br />
The hawkish FOMC statement should lead to higher rate hike expectations, and the<br />
recent flattening in whites/reds on flight-to-quality concerns provides a decent entry<br />
point. Spread rolls up from Dec/Dec to Sep/Sep.<br />
-30.0<br />
(S)<br />
48.0<br />
(T)<br />
26.0<br />
(S)<br />
143.0<br />
(T)<br />
120.0 80.0 88.75<br />
(29-Jan)<br />
-5.0 -38.0 -27.75<br />
(15-Jan)<br />
65.0 45.0 55.0<br />
(29-Jan)<br />
40.0 20.0 24.0<br />
(29-Jan)<br />
180.0 130.0 146.0<br />
(27-Jan)<br />
Options<br />
Bund Spread Buy RXH0 Mar 122/12150 PS<br />
10.0 25.0 0.0 8.5<br />
Monthly option strategy playing a pull-back to the lows of the MT channel. Also,<br />
12350 strong resistance area should hold.<br />
(T)<br />
(03-Feb)<br />
Euribor Fly Buy ERU0 9862/75/87 P<br />
1.5 12.5 0.0 1.5<br />
Cheap downside strategy, playing the normalisation of Eonia. The position<br />
(S)<br />
(13-Jan)<br />
complements the upside fly (no-normalisation strategy).<br />
Euribor Fly Buy ERU0 9912/25/37 C<br />
1.5 12.5 0.0 1.5<br />
Upside protection in case of liquidity spill-over post June. Rolldown trade.<br />
(S)<br />
(12-Jan)<br />
Eurodollar Call Buy EDU0 99.25 C<br />
29.0 50.0 0.0 23.5<br />
Expectations for a Fed on hold make rolldown strategies attractive. In this case, the (T)<br />
(08-Jan)<br />
theta loss over 3m or 6m is more than compensated by the rolldown in an<br />
unchanged scenario.<br />
Sterling Fly Buy L Z0 9900/25/50 C<br />
6.0 25.0 0.0 3.5<br />
Rolldown strategy for unchanged MPC thru 2010.<br />
(S)<br />
(05-Jan)<br />
*Tactical (T) and strategic (S) trades. **Risk: vega, gamma for options, or ΔDV01 for futures, bonds and swaps.<br />
Carry<br />
/ mth<br />
Risk**<br />
P/L<br />
(ccy/Bp)<br />
5k/01 EUR +76k<br />
+15bp<br />
15k/01 USD -34k<br />
-2bp<br />
6.25k/01 EUR -44k<br />
-7bp<br />
5k/01 EUR +10k<br />
+2bp<br />
10k/01 USD -30k<br />
-3bp<br />
1.2k/01 EUR<br />
+1.5k<br />
+1.5c<br />
10k/01 EUR 0k<br />
0bp<br />
10k/01 EUR 0k<br />
0bp<br />
5k/01 USD +28k<br />
+5.5c<br />
5k/01 GBP +13k<br />
+2.5c<br />
Interest Rate Strategy 12 February 2010<br />
<strong>Market</strong> <strong>Mover</strong>, Non-Objective Research Section<br />
37<br />
www.Global<strong>Market</strong>s.bnpparibas.com
EUR Problem, Global Risks<br />
• The focus on Europe has intensified as the<br />
problems in Greece and the other European<br />
peripheral currencies increases…<br />
• ….we see little chance of a euro positive<br />
solution…<br />
• …hence, it is not a question of if to sell the<br />
euro, but when to sell<br />
• However, the problems in Europe are adding<br />
to the already deteriorating global investment<br />
environment…<br />
• …suggesting that the commodity currencies<br />
and sterling could be at even greater risk<br />
• USD to benefit, not just as a safe haven, but<br />
as an investment desination of choice<br />
2.00<br />
1.95<br />
1.90<br />
1.85<br />
1.80<br />
1.75<br />
1.70<br />
1.65<br />
1.60<br />
1.55<br />
Jun<br />
Chart 1: Relative Europe/US Financials<br />
Performance and EURUSD<br />
Relative Europe/US Financials<br />
Aug Oct Dec<br />
09<br />
Source: Reuers EcoWin Pro, <strong>BNP</strong> Paribas<br />
EURUSD<br />
Feb<br />
10<br />
Chart 2: EMU Credit Growth and EMU<br />
1.550<br />
1.525<br />
1.500<br />
1.475<br />
1.450<br />
1.425<br />
1.400<br />
1.375<br />
1.350<br />
1.325<br />
EUR/USD<br />
Not just a European problem<br />
Investor attention on the problems in Greece has<br />
intensified over the past week, providing the euro<br />
with little respite. But we suggest that the problems in<br />
Greece are not only a European concern, but also<br />
risk adding to a broader challenge to global risk<br />
appetite that we believe is starting to take hold and<br />
could become a major theme for 2010. Global<br />
liquidity withdrawal is gaining momentum and will<br />
remove an important source of support for higher risk<br />
asset markets. It also has significant implications for<br />
currency markets, leaving the commodity and procyclical<br />
currencies particularly vulnerable. Moreover,<br />
we suggest that 2010 is likely to see the return of the<br />
USD, not only as a safe haven, but as an investor<br />
destination of choice.<br />
15.0<br />
EUR-TWI (RHS)<br />
12.5<br />
10.0<br />
7.5<br />
5.0<br />
2.5<br />
EMU credit growth (% y/y)<br />
0.0<br />
98 00 02 04 06 08 10<br />
Source: Reuters EcoWin, <strong>BNP</strong> Paribas<br />
110<br />
105<br />
100<br />
95<br />
90<br />
85<br />
80<br />
75<br />
70<br />
We have discussed over recent weeks the various<br />
options and implications for Greece and the other<br />
countries at the periphery of Europe that are<br />
suffering from fiscal problems. The dilemma facing<br />
the monetary authorities within the eurozone is to<br />
balance the costs of failure in Greece (with potential<br />
spillover into Portugal and Spain) with the moral<br />
hazard of a bailout. Our conclusion is that there is<br />
unlikely to be a euro positive outcome, regardless of<br />
the route taken. While we have one of the most<br />
bearish euro forecasts in the market, we do not<br />
appear to be alone with our bearish assessment,<br />
especially within the trading community. Indeed, the<br />
extent of euro bearish positioning among speculative<br />
investors has hit the headlines as surveys, such as<br />
the CFTC, reveal record levels of euro short<br />
positions on the futures market. This extreme level of<br />
positioning is certain to make the euro more sensitive<br />
to developments that challenge the market<br />
perception in the near term.<br />
This has been the case over the past week, with<br />
rumours regarding the possibility of a bailout of<br />
Greece increasing volatility. Hence, some caution<br />
regarding euro short positions is advisable during the<br />
major eurozone events and meetings over the<br />
coming weeks. However, despite the potential for<br />
volatility in the near term, we continue to see little<br />
hope of a happy outcome for the euro and even<br />
suggest that a lower euro could be part of the<br />
solution.<br />
Little hope of a happy outcome for the euro<br />
In our recent publication, Greece: Bridging the Fiscal<br />
Gap – Four Scenarios, we examined the four most<br />
likely outcomes and conclude that all are likely to<br />
Ian Stannard 12 February 2010<br />
<strong>Market</strong> <strong>Mover</strong>, Non-Objective Research Section<br />
38<br />
www.Global<strong>Market</strong>s.bnpparibas.com
leave the euro significantly lower. Under the first<br />
scenario, Adjustment, the Greek authorities are<br />
successful in implementing the required reforms and<br />
slowly regain the confidence of markets. However,<br />
this would be a slow process and still runs high risks,<br />
suggesting that any euro recovery is likely to remain<br />
limited. Although this would likely be the most<br />
favourable outcome for the euro, much would still<br />
depend on the developments in the other peripheral<br />
countries, especially how Portugal and Spain<br />
implement their reforms. Ultimately,<br />
underperformance of the euro would still be expected<br />
as a high risk premium would remain in place and<br />
our EURUSD 1.27 year-end forecast would still be<br />
achievable.<br />
Under the second scenario, Financial Support or<br />
bailout, Greece would effectively have to borrow the<br />
credibility of other states or international institutions,<br />
buying Greece time to carry out reforms. However,<br />
although the announcement of a bailout may cause<br />
an initial euro rebound, we would not expect this to<br />
be sustained as the longer-term implications would<br />
likely be extremely negative, with the issue of moral<br />
hazard playing a major role. In fact we would expect<br />
the EURUSD to come under even greater pressure<br />
than in the first scenario, with EURUSD declines<br />
likely to exceed our 1.27 forecast targeting at least<br />
1.25 by year-end.<br />
The third scenario examined was Debt Restructuring<br />
or soft default. In this case, Greece would lose<br />
credibility and fail to borrow credibility from<br />
elsewhere, suggesting that it could encounter<br />
problems meeting its obligations – forcing it to<br />
restructure its debt. We would consider such an<br />
outcome as outright euro bearish, especially if there<br />
were spill-over effects into the rest of the European<br />
periphery. Significant portfolio and capital outflows<br />
from the eurozone would be seen. Under such<br />
circumstances, EURUSD would be vulnerable to a<br />
collapse towards the 1.10 area.<br />
Disorderly Default was the fourth and final scenario<br />
examined, where events unfolded beyond the control<br />
of the Greek authorities. This would be clearly the<br />
most bearish scenario for the euro, where the decline<br />
in the currency would likely be very abrupt, with even<br />
the 1.10 area exceeded.<br />
Bailout will not support the euro<br />
Given the extent of recent market rumours and<br />
media speculation, some sort of assistance or aid<br />
package to support Greece currently looks the more<br />
likely outcome, although there still appears to be<br />
significant disagreement with regards to how this<br />
may be carried out, not to mention the legal issues<br />
as to how this would be consistent with the<br />
Maastricht Treaty. While the risk of moral hazard<br />
30<br />
20<br />
10<br />
0<br />
-1 0<br />
-2 0<br />
-3 0<br />
-4 0<br />
-5 0<br />
-6 0<br />
-7 0<br />
-8 0<br />
-9 0<br />
-100<br />
Chart 3: Net Financial Positions (% GDP)<br />
Portugal<br />
96 97 98 99 00 01 02 03 04 05 06 07 08<br />
Source: CEIC, <strong>BNP</strong> Paribas<br />
Germany<br />
Ireland<br />
Greece<br />
Chart 4: Public Debt as % of GDP<br />
Ita ly<br />
Spain<br />
Public Debt (% GDP) 2008 2009 2010 2011<br />
Sweden 38.0 42.1 43.6 44.1<br />
Norway 49.9 54.3 50.6 45.2<br />
UK 52.0 68.6 80.3 88.2<br />
EMU 69.3 78.2 84.0 88.2<br />
Greece 99.2 112.6 124.9 135.4<br />
Spain 39.7 54.3 66.3 74.0<br />
Portugal 66.3 77.4 84.6 91.1<br />
Source: <strong>BNP</strong> Paribas<br />
associated with such a solution has been discussed<br />
in detail, the size and cost is currently conveniently<br />
being overlooked. Some initial calculations by the<br />
<strong>BNP</strong> Paribas <strong>Market</strong> Economics group based on past<br />
bailout packages in emerging markets reveals that<br />
such a solution will not be cheap. A bailout would<br />
have to be large enough to convince markets that it<br />
would be successful. Previous examples suggest<br />
rescue packages need to be around 20% of GDP. In<br />
the case of Greece this could be EUR 50bn, although<br />
large it could be manageable. However, if a broader<br />
bailout was required, including Portugal and Spain<br />
than the cost could be a far greater, over EUR<br />
300bn. So while the euro could take some initial<br />
comfort from any bailout, the longer-term implications<br />
would remain extremely bearish. Hence, we continue<br />
to recommend using any EURUSD rebounds post<br />
the EU summit to establish bearish strategies.<br />
Indeed, in our view it is no longer a case of if to sell<br />
the euro, but more a case of when to sell. Hence, we<br />
recommend option strategies, such as downside<br />
One-Touch strategies to provide protection against a<br />
renewed EURUSD decline.<br />
Ian Stannard 12 February 2010<br />
<strong>Market</strong> <strong>Mover</strong>, Non-Objective Research Section<br />
39<br />
www.Global<strong>Market</strong>s.bnpparibas.com
Global risks<br />
While the stress in the eurozone has intensified over<br />
the past week and the euro has come under<br />
significant pressure, it is interesting to note that the<br />
euro has not been the weakest currency. In fact<br />
since the beginning of the year, although the euro is<br />
lower against the USD, it has remained supported on<br />
many of the crosses. The underperformers are the<br />
commodity currencies and sterling. In fact the<br />
commodity currencies could well be the main<br />
casualties of the year, along with sterling.<br />
Sterling stands out – as vulnerable<br />
In many cases sterling and the commodity currencies<br />
are exposed to the very risks that are currently<br />
causing the most concern within Europe. Indeed, the<br />
UK net debt to GDP ratio is expected to increase<br />
rapidly over the next few years, reaching 67% in<br />
2010 and 74% in 2011 on our forecasts. This is likely<br />
to be worse than in Spain, where government debt is<br />
expected to reach 66.3% of GDP in 2010 and 74.0%<br />
in 2011.<br />
While sterling stands out as the most vulnerable of<br />
the major currencies given its poor and deteriorating<br />
fiscal position, which is likely to see the UK’s AAA<br />
rating called into question post the election if action is<br />
not taken, the commodity currencies are also<br />
exposed to the additional risk of global liquidity<br />
withdrawal. Indeed, signs that the action already<br />
taken by China is beginning to bite is starting to have<br />
a direct negative impact on the AUD far earlier than<br />
originally anticipated. The RBA has also signalled a<br />
slowing of the pace of tightening, citing the<br />
anticipated tightening of policy in China. As a result,<br />
we have also lowered our AUDUSD forecast.<br />
Most bearish<br />
In the case of sterling we have the most bearish<br />
GBPUSD forecast in the market for end-2010<br />
(GBPUSD 1.31) and the data from the UK provide<br />
little reason to change this bearish assessment. The<br />
UK has shown the weakest and most fragile of<br />
recoveries, especially compared to its developed<br />
economy peers. Taking a full quarter longer to<br />
emerge from recession than most other major<br />
economies, with a weak 0.1% q/q print in Q4, there<br />
are also signs that the brighter spots within the UK<br />
economy are already running out of steam. The<br />
latest survey evidence from the UK consumer sector<br />
(BRC) is showing some worrying signs, but the<br />
biggest concern has to be the collapse in the new<br />
buyer enquires in the housing market as revealed by<br />
the RICS house price survey. This is widely regarded<br />
as one of the better leading indicators of the UK<br />
housing market and the current pace of deterioration<br />
does not bode well for the housing market.<br />
Chart 5: BoE Corrects Rate Expectations, which<br />
Will Move GBPUSD Lower<br />
1.750<br />
1.725<br />
1.700<br />
1.675<br />
1.650<br />
1.625<br />
1.600<br />
1.575<br />
1.550<br />
1.525<br />
Jul<br />
Rate expectations (FRA 3x9)<br />
GBPUSD (lhs)<br />
Source: Reuers EcoWin Pro, <strong>BNP</strong> Paribas<br />
75<br />
50<br />
25<br />
0<br />
-25<br />
-50<br />
-75<br />
Sep Oct Nov Dec Jan<br />
09<br />
10<br />
Chart 6: RICS House Price Survey<br />
RICS House Price Expectations<br />
RICS New Buyer Enquires<br />
00 01 02 03 04 05 06 07 08 09<br />
Source: Reuers EcoWin Pro, <strong>BNP</strong> Paribas<br />
BoE dovish<br />
The BoE has also delivered a very dovish<br />
assessment, which is consistent with our view that<br />
interest rates will remain at an extremely low level for<br />
an extended period of time, probably throughout<br />
2010 and well into 2011. In fact BoE Governor King<br />
has left the door wide open for a resumption of the<br />
asset purchase programme if required (the asset<br />
purchase programme was paused at the February<br />
MPC meeting). Meanwhile, the BoE has undertaken<br />
a significant downward revision of its inflation<br />
forecasts, suggesting that inflation will remain below<br />
the target throughout the two year forecast period.<br />
An adjustment of market interest rate expectations<br />
will also add to the negative picture for sterling.<br />
Liquidity withdrawal gains momentum<br />
Global liquidity withdrawal remains a major risk for<br />
global asset markets and the commodity currencies,<br />
where we expect increased volatility to develop in the<br />
coming months. While, the BoE has left the door<br />
1.0<br />
0.9<br />
0.8<br />
0.7<br />
0.6<br />
0.5<br />
0.4<br />
0.3<br />
0.2<br />
0.1<br />
75<br />
50<br />
25<br />
0<br />
-25<br />
-50<br />
-75<br />
-100<br />
Ian Stannard 12 February 2010<br />
<strong>Market</strong> <strong>Mover</strong>, Non-Objective Research Section<br />
40<br />
www.Global<strong>Market</strong>s.bnpparibas.com
open for further measures if required, elsewhere the<br />
withdrawal of liquidity is gaining momentum. Despite<br />
the fiscal problems in eurozone, the ECB has<br />
continued on the path of unwinding unorthodox<br />
measures, with the more hawkish members<br />
reiterating the need to normalise money markets. In<br />
the US, Fed Chairman Bernanke has also laid out<br />
the process of liquidity withdrawal and policy<br />
normalisation. This removal of liquidity from the<br />
global financial system will have a huge impact given<br />
that this was the fuel driving asset and commodity<br />
markets over the past year. We would suggest that<br />
the asset markets currencies which were the biggest<br />
beneficiaries of this liquidity injection will now be the<br />
most at risk.<br />
Chart 7: AUDUSD and Commodity Prices<br />
1.00 Indust Commodities Index (rhs)<br />
0.95<br />
0.90<br />
0.85<br />
0.80<br />
0.75<br />
0.70<br />
0.65<br />
AUDUSD Spot<br />
0.60<br />
05 06 07 08 09 10<br />
Source: Reuers EcoWin Pro, <strong>BNP</strong> Paribas<br />
275<br />
250<br />
225<br />
200<br />
175<br />
150<br />
125<br />
100<br />
AUD exposed<br />
We would place the AUD near the top of the list of<br />
currencies now exposed, especially given the close<br />
links to China. Indeed, it is worth remembering that<br />
China has been a huge source of USD liquidity over<br />
the course of the past year. China has also been<br />
running ultra loose monetary policy with the<br />
management of the yaun generating huge reserve<br />
accumulation (Chinese reserves have grown by USD<br />
453bn over the past year) and diversification, adding<br />
to the USD liquidity. However, the explosion in<br />
Chinese credit growth at the beginning of the year<br />
appears to have triggered a stepping up of tightening<br />
measures in China to bring money supply and<br />
lending back under control. Initial signs suggest that<br />
these measures are having an impact already. If the<br />
Chinese authorities are successful in limiting the<br />
more speculative aspects of investment then the<br />
AUD will suffer as a direct result as commodity and<br />
equity markets come under pressure. Note the sharp<br />
decline in equity market over the past month, with the<br />
S&P 500 down over 6%, the Eurostoxx down over<br />
10%, and the Shanghai index down over 7%.<br />
Safe havens?<br />
The USD is expected to be the main beneficiary of<br />
the global reduction in risk appetite resulting from the<br />
liquidity withdrawal process, with the fiscal problems<br />
in Europe undermining the euro’s fledgling reserve<br />
status. But, we expect the USD’s appeal to go<br />
beyond its safe haven status, with global investors<br />
once again seeing the US as a destination of choice.<br />
There is already evidence of this among Japanese<br />
investors where the Lifer companies are under<br />
increasing pressure to extend exposure to overseas<br />
assets and US Treasuries in particular. JGB yields<br />
are set to remain at low levels for a extremely long<br />
period of time, with even the prospect of Japan<br />
entering quantitative easing (just when everyone else<br />
is looking for the exit) to keep yields down. Japanese<br />
investors are also expressing an interest in lower<br />
hedge ratios on their US exposure as rate<br />
Chart 8: Swedish Retail Sales and SEK<br />
90.0<br />
87.5<br />
SEK-TWI<br />
85.0<br />
82.5<br />
80.0<br />
77.5<br />
75.0<br />
72.5<br />
70.0<br />
67.5<br />
65.0<br />
62.5<br />
R etail sales (% y/y, RH S)<br />
60.0<br />
98 00 01 02 03 04 05 06 07 08 09<br />
Source: Reuers EcoWin Pro, <strong>BNP</strong> Paribas<br />
10<br />
9<br />
8<br />
7<br />
6<br />
5<br />
4<br />
3<br />
2<br />
1<br />
0<br />
-1<br />
-2<br />
expectations in the US start to rise. This will provide<br />
USDJPY with medium-term support and we reiterate<br />
our USDJPY 108 forecast for end-2010.<br />
Within Europe, the Scandinavia countries are now in<br />
a unique position. Norway and Sweden have not<br />
been tainted with the fiscal problems seen<br />
throughout much of the rest of Europe. Indeed, by<br />
comparison, debt levels in Norway and Sweden are<br />
low, projected to be at 50.6% and 43.6% of GDP<br />
respectively in 2010 and at 45.2% and 44.1% of GDP<br />
in 2011 (European Commission forecasts). The<br />
relatively strong fiscal position, especially in Norway,<br />
should provide support.<br />
However, with the Norges Bank having already<br />
started tightening monetary policy and the Riksbank<br />
relatively hawkish, both currencies will benefit from<br />
relative interest rate expectations. We would also<br />
recommend short GBPSEK positions in this<br />
environment, to take advantage of relative fiscal and<br />
debt positions.<br />
Ian Stannard 12 February 2010<br />
<strong>Market</strong> <strong>Mover</strong>, Non-Objective Research Section<br />
41<br />
www.Global<strong>Market</strong>s.bnpparibas.com
SEK Steams Ahead<br />
• The Scandinavian currencies have remained very well supported and have continued to deliver<br />
positive technical signals…<br />
• …the SEK is now starting to gain even further momentum and we would expect gains to be<br />
sustained over the medium term<br />
• Indeed, EUR/SEK has broken sharply lower through the major medium-term support to trigger<br />
another bearish signal…<br />
• …while NOK/SEK is now expected to develop a significant correction lower with the long-term up<br />
trendline support set to be challenged.<br />
The SEK has resumed its major uptrend with an<br />
acceleration of gains over the past week breaking<br />
though key technical levels against the euro and<br />
on many of the crosses. Indeed, the SEK has<br />
been one of the best performing currencies over<br />
the past week (second only to the AUD among<br />
the G10). The <strong>BNP</strong> Paribas SEK Trade Weighted<br />
Index is also set to break higher from the recent<br />
trading range, which will confirm the broad-based<br />
nature of SEK gains.<br />
EUR/SEK has already broken sharply lower<br />
through the major support in the 10.05 area,<br />
confirming the medium-term bearish outlook that<br />
has now developed. We expect the down trend to<br />
be extended towards the major support clustered<br />
in the 9.85/9.80 area, which also coincides with<br />
the 76.40% retracement level of the rally<br />
developed from the May 2008 lows. Over the<br />
medium term, the broad down trend that has<br />
developed from the 11.785 March 2009 high is<br />
expected to be extended towards the 9.555<br />
support zone.<br />
GBP/SEK has broken sharply lower over the course<br />
of the past week, breaking through the major up<br />
trendline support that had been in place since<br />
October. GBP/SEK losses are now approaching<br />
major support at the 11.265 area, which represents<br />
the bottom end of the major three-month trading<br />
range. A further break below here will generate a<br />
major negative signal leaving GBP/SEK vulnerable to<br />
a decline back towards the 10.955 lows seen in<br />
October. Longer term, a decline towards the 10.475<br />
area is expected. Technical indicators are also<br />
developing significant negative momentum signals,<br />
confirming that the pressure is clearly to the<br />
downside.<br />
NOK/SEK is expected to undergo a significant<br />
correction lower. Major up trendline support has<br />
already been broken and a test of the 1.2150 support<br />
is now expected ahead of the longer-term up<br />
trendline support that currently intervenes at 1.2030.<br />
EUR/USD corrective<br />
rebounds have<br />
remained extremely<br />
limited keeping the<br />
major downtrend<br />
intact.<br />
A break below the<br />
1.3585 low will extend<br />
the down trend<br />
towards the 1.3425<br />
area.<br />
Over the medium<br />
term, even a return to<br />
the 1.3095 area is<br />
now possible.<br />
Chart 1: EUR/USD – keeping the pressure to the downside<br />
1.52<br />
1.50<br />
1.48<br />
1.46<br />
1.44<br />
1.42<br />
1.40<br />
1.38<br />
1.36<br />
1.34<br />
1.4340<br />
1.3750<br />
22-Jun-09<br />
1.4446<br />
1.4015<br />
19-Aug-09<br />
1.4842<br />
1.4480<br />
1.5060<br />
16-Oct-09<br />
1.4630<br />
1.5144<br />
1.4219<br />
15-Dec-09<br />
1.4582<br />
11-Feb-10<br />
Source: <strong>BNP</strong> Paribas<br />
Ian Stannard 12 February 2010<br />
<strong>Market</strong> <strong>Mover</strong>, Non-Objective Research Section<br />
42<br />
www.Global<strong>Market</strong>s.bnpparibas.com
EUR/SEK has broken<br />
sharply lower through<br />
the major support at<br />
the 1.0400/1.0350<br />
levels to trigger<br />
another bearish signal.<br />
We now expect a<br />
decline extending the<br />
major down trend<br />
towards the 9.80<br />
support zone initially.<br />
Over the medium term,<br />
even a decline towards<br />
the 9.555 area is<br />
becoming likely.<br />
Source: <strong>BNP</strong> Paribas<br />
NOK/SEK has traded<br />
a peak at the 1.2580<br />
level and we would<br />
now expect a<br />
significant correction of<br />
the major up trend to<br />
develop.<br />
Indeed, initial up<br />
trendline support has<br />
been breached and we<br />
would now expect a<br />
decline to test the<br />
1.2150 support ahead<br />
of the longer-term up<br />
trendline support at<br />
1.2030.<br />
Source: <strong>BNP</strong> Paribas<br />
GBP/SEK is<br />
developing an<br />
extremely bearish<br />
pattern on longer-term<br />
charts.<br />
The sharp decline<br />
seen over the past<br />
week confirms that the<br />
11.900 recent peak is<br />
a corrective top.<br />
Major support at<br />
11.265 is now being<br />
targeted. A break<br />
below here will extend<br />
the downtrend towards<br />
10.475.<br />
Source: <strong>BNP</strong> Paribas<br />
Chart 2: EUR/SEK – major bearish breakout<br />
11.152<br />
11.10<br />
10.90<br />
10.70<br />
10.685<br />
10.535<br />
10.50<br />
10.30<br />
10.170<br />
10.10<br />
10.035 10.065<br />
9.90<br />
22-Jun-09 19-Aug-09 16-Oct-09 15-Dec-09 11-Feb-10<br />
Chart 3: NOK/SEK – major correction lower developing<br />
1.27<br />
1.2580<br />
1.25<br />
1.2420<br />
1.2550<br />
1.23<br />
1.2320<br />
1.21<br />
1.1975<br />
1.2150<br />
1.19<br />
1.17<br />
1.1645<br />
1.15<br />
Jun-09 Jul-09 Aug-09 Sep-09 Oct-09 Nov-09 Dec-09 Jan-10 Feb-10<br />
Chart 4: GBP/SEK – major support now being tested<br />
13.50<br />
13.170<br />
13.00<br />
12.910<br />
12.50<br />
12.445<br />
12.00<br />
11.845<br />
11.900<br />
11.50<br />
1.305<br />
11.00<br />
10.955<br />
10.50<br />
Jun-09 Jul-09 Aug-09 Sep-09 Oct-09 Nov-09 Dec-09 Jan-10 Feb-10<br />
Ian Stannard 12 February 2010<br />
<strong>Market</strong> <strong>Mover</strong>, Non-Objective Research Section<br />
43<br />
www.Global<strong>Market</strong>s.bnpparibas.com
Currency Spot Trade Recommendations Date<br />
GBP/SEK 11.380 Sell 11.510, stop 11.650, target 10.600 11 Feb 2010<br />
NOK/SEK 1.2275 Sell 1.2340, stop 1.2440, target 1.20 11 Feb 2010<br />
GBP/USD 1.5685 Sell 1.5870, stop 1.6115, target 1.51 05 Feb 2010<br />
USD/JPY 89.75 Buy 88.10, stop 87.10, target 96.00 05 Feb 2010<br />
AUD/USD 0.9000 Short at 0.8780, stop 0.8930, target 0.8160 09 Feb 2010<br />
EUR/USD 1.3655 Short at 1.3835, lower stop to 1.3835, target 1.31 09 Feb 2010<br />
USD/CHF 1.0735 Long at 1.0560, stop raise to 1.0590, target 1.10 01 Feb 2010<br />
Source: <strong>BNP</strong> Paribas<br />
Ian Stannard 12 February 2010<br />
<strong>Market</strong> <strong>Mover</strong>, Non-Objective Research Section<br />
44<br />
www.Global<strong>Market</strong>s.bnpparibas.com
Economic Calendar: 12 - 19 February<br />
GMT Local Previous Forecast Consensus<br />
Fri 12/02 07:00 08:00 Germany GDP (Flash) q/q : Q4 0.7% 0.4% 0.2%<br />
07:00 08:00 GDP (Flash) y/y : Q4 -4.8% -2.1% -2.2%<br />
07:45 08:45 France Wages (nsa, Prel) q/q : Q4 0.5% 0.3% 0.3%<br />
07:45 08:45 Wages (Prel) y/y : Q4 2.0% 2.0% n/a<br />
07:45 08:45 GDP (Prel) q/q : Q4 0.3% 0.6% 0.5%<br />
07:45 08:45 GDP (Prel) y/y : Q4 -2.3% -0.2% -0.3%<br />
07:45 08:45 Non-Farm Payrolls (Prel) q/q : Q4 -0.6% -0.2% -0.3%<br />
07:45 08:45 Non-Farm Payrolls (Prel) y/y : Q4 -2.7% -2.4% n/a<br />
08:00 09:00 Spain CPI (Final) m/m : Jan 0.0% -1.0% -1.0%<br />
08:00 09:00 CPI (Final) y/y : Jan 0.8% 1.0% 1.0%<br />
08:00 09:00 HICP (Final) m/m : Jan 0.0% -1.0% -1.0%<br />
08:00 09:00 HICP (Final) y/y : Jan 0.9% 1.1% 1.1%<br />
08:00 09:00 Eurozone ECB’s Nowotny Speaks in Vienna<br />
10:00 11:00 Industrial Production (sa) m/m : Dec -0.2% -0.8% 0.1%<br />
10:00 11:00 Industrial Production (wda) y/y : Dec -6.8% -2.5% -1.7%<br />
10:00 11:00 GDP (Flash) q/q : Q4 0.4% 0.4% 0.3%<br />
10:00 11:00 GDP (Flash) y/y : Q4 -4.0% -1.8% -1.9%<br />
08:30 09:30 Neths GDP (Prel) q/q : Q4 0.5% 0.6% 0.5%<br />
08:30 09:30 GDP (Prel) y/y : Q4 -3.7% -1.9% -2.5%<br />
08:30 09:30 Retail Sales y/y : Dec -6.4% -7.5% n/a<br />
09:00 10:00 Italy GDP (Prel) q/q : Q4 0.6% 0.1% 0.1%<br />
09:00 10:00 GDP (Prel) y/y : Q4 -4.6% -2.5% -2.6%<br />
13:30 08:30 US Retail Sales m/m : Jan -0.3% -0.9% 0.3%<br />
13:30 08:30 Retail Sales Ex-Autos m/m : Jan -0.2% 0.1% 0.5%<br />
14:30 09:30 Fed’s Tarullo Testifies on Systemic Risk to Senate Panel<br />
14:55 09:55 Michigan Sentiment (Prel) : Feb 74.4 76.5 75.0<br />
15:00 10:00 Business Inventories : Dec 0.4% 0.2% 0.2%<br />
Mon 15/02 Holiday US, Canada<br />
23:50 08:50 Japan GDP (Prel) q/q : Q4 0.3% 0.9% 0.9%<br />
23:50 08:50 GDP (Prel) y/y : Q4 -5.1% -1.2% n/a<br />
(14/02)<br />
00:01 00:01 UK Rightmove House Price Index : Feb<br />
09:00 10:00 Italy EU Trade Balance : Dec EUR-0.8bn EUR-1.0bn n/a<br />
16:00 17:00 Eurozone Finance Ministers Meet<br />
Tue 16/02 00:30 01:30 Australia RBA MPC Minutes<br />
00:30 01:30 NAB Business Confidence : Jan 8 12 n/a<br />
00:30 01:30 NAB Business Conditions : Jan 10 9 n/a<br />
07:00 08:00 Eurozone EU25 New Car Registrations : Jan<br />
08:30 09:30 EU Finance Ministers Meet<br />
09:30 09:30 UK CPI m/m : Jan 0.6% 0.0% 0.1%<br />
09:30 09:30 CPI y/y : Jan 2.9% 3.6% 3.7%<br />
09:30 09:30 RPI y/y : Jan 2.4% 3.6% 3.8%<br />
09:30 09:30 RPIX y/y : Jan 3.8% 4.5% 4.6%<br />
09:30 09:30 DCLG UK House Prices y/y : Dec<br />
10:00 11:00 Germany ZEW Expectations : Feb 47.2 40.0 41.0<br />
10:00 11:00 ZEW Current Assessment : Feb -56.6 -51.0 -52.0<br />
13:30 08:30 US Empire State Survey : Feb 16 19 17<br />
14:00 09:00 TICS Data : Dec USD26.6bn USD25.0bn n/a<br />
17:00 12:00 Fed’s Hoenig speaks at Budget Policy Forum in Washington<br />
17:45 12:45 Fed’s Kocherlakota Speaks on the Economic Outlook in Minnesota<br />
18:00 13:00 NAHB Housing <strong>Market</strong> Index : Feb 15 16 16<br />
Wed 17/02 23:50 08:50 Japan Tertiary Index (sa) m/m : Dec -0.2% -0.3% -0.3%<br />
(16/02)<br />
05:00 06:00 Eurozone ECB’s Quaden Speaks<br />
10:00 11:00 Foreign Trade Balance (nsa) : Dec EUR4.8bn EUR8.0bn n/a<br />
08:00 09:00 Spain GDP (Final) q/q : Q4 -0.1% (p) -0.1% n/a<br />
08:00 09:00 GDP (Final) y/y : Q4 -3.1% (p) -3.1% n/a<br />
<strong>Market</strong> Economics 12 February 2010<br />
<strong>Market</strong> <strong>Mover</strong><br />
45<br />
www.Global<strong>Market</strong>s.bnpparibas.com
Economic Calendar: 12 - 19 February<br />
GMT Local Previous Forecast Consensus<br />
Wed 17/02 09:30 09:30 UK BoE MPC Minutes<br />
(cont) 09:30 09:30 Unemployment Change : Jan -15k -15k -10k<br />
09:30 09:30 Unemployment Rate (Claimant) : Jan 5.0% 4.9% 5.0%<br />
13:30 08:30 US Import Prices m/m : Jan 0.0% 1.0% 0.9%<br />
13:30 08:30 Import Prices Ex Petroleum m/m : Jan 0.5% 0.5% n/a<br />
13:30 08:30 Housing Starts : Jan 557k 580k 581k<br />
14:15 09:15 Industrial Production m/m : Jan 0.6% 0.9% 0.7%<br />
14:15 09:15 Capacity Utilisation Rate : Jan 72.0% 72.8% 72.6%<br />
17:45 12:45 Fed’s Plosser Speaks on the Financial Crisis in Philadelphia<br />
19:00 14:00 FOMC Minutes<br />
14:00 15:00 Belgium GDP (Flash) q/q : Q4 0.5% 0.3% n/a<br />
14:00 15:00 GDP (Flash) y/y : Q4 -3.5% -1.1% n/a<br />
Thu 18/02 Japan BoJ Rate Announcement<br />
08:30 09:30 Sweden CPI (nsa) m/m : Jan 0.2% -0.3% n/a<br />
08:30 09:30 CPI (nsa) y/y : Jan 0.9% 1.0% n/a<br />
08:30 09:30 CPIF m/m : Jan 0.2% -0.1% n/a<br />
08:30 09:30 CPIF y/y : Jan 2.7% 2.7% n/a<br />
08:30 09:30 Unemployment Rate (nsa) : Jan 8.6% 9.4% n/a<br />
08:30 09:30 Neths Unemployment Rate : Jan 5.3% 5.5% n/a<br />
09:00 10:00 Norway GDP (Mainland, sa) q/q : Q4 0.5% 0.6% 0.8%<br />
09:00 10:00 GDP (Mainland) y/y : Q4 -1.4% 0.6% n/a<br />
09:00 10:00 GDP (Total, sa) q/q : Q4 0.9% 0.7% 0.7%<br />
09:00 10:00 GDP (Total) y/y : Q4 -0.7% -0.1% n/a<br />
09:30 09:30 UK PSNCR : Jan GBP23.6bn GBP-17.8bn GBP-17.8bn<br />
09:30 09:30 PSNB : Jan GBP15.7bn GBP-2.6bn GBP-2.8bn<br />
11:00 11:00 CBI Monthly Industrial Trends : Feb<br />
Eurozone ECB Governing Council Meeting (No Rate Announcement)<br />
12:00 07:00 Canada CPI m/m : Jan -0.3% 0.3% 0.3%<br />
12:00 07:00 CPI y/y : Jan 1.3% 2.1% 1.9%<br />
12:00 07:00 BoC Core CPI m/m : Jan -0.3% 0.2% 0.0%<br />
12:00 07:00 BoC Core CPI y/y : Jan 1.5% 2.1% 1.9%<br />
13:30 08:30 US PPI (sa) m/m : Jan 0.2% 0.8% 0.8%<br />
13:30 08:30 PPI (sa) y/y : Jan 4.4% 4.6% 4.4%<br />
13:30 08:30 PPI Core (sa) m/m : Jan 0.0% 0.2% 0.1%<br />
13:30 08:30 PPI Core (sa) y/y : Jan 0.9% 0.8% 0.8%<br />
13:30 08:30 Initial Claims 440k 450k n/a<br />
15:00 10:00 Philadelphia Fed Survey : Feb 15.2 20.0 17.0<br />
15:00 10:00 Leading Indicators m/m : Jan 1.1% 0.6% 0.5%<br />
16:00 11:00 EIA Oil Inventories<br />
18:00 12:00 Fed’s Bullard Speaks to Economic Club of Memphis<br />
00:00<br />
(19/02)<br />
20:00 Fed’s Lockhart Speaks on the Economic Outlook in Georgia<br />
Fri 19/02 07:00 08:00 Germany PPI m/m : Jan -0.1% 0.3% 0.3%<br />
07:00 08:00 PPI y/y : Jan -5.2% -3.9% -3.9%<br />
07:45 08:45 France Industry Survey : Feb 92 93 n/a<br />
09:00 10:00 Eurozone PMI Manufacturing (Flash) : Feb 52.4 52.6 52.8<br />
09:00 10:00 PMI <strong>Services</strong> (Flash) : Feb 52.5 52.5 52.5<br />
09:00 10:00 PMI Composite (Flash) : Feb 53.7 53.4 53.5<br />
09:00 10:00 Current Account (nsa) : Dec EUR0.1bn EUR5.0bn n/a<br />
09:00 10:00 Italy Industrial Orders y/y : Dec 0.0% -2.7% n/a<br />
09:30 09:30 UK Retail Sales m/m : Jan 0.3% -0.6% -0.6%<br />
09:30 09:30 Retail Sales y/y : Jan 2.1% 1.0% 1.0%<br />
13:00 08:00 US Fed’s Dudley Speaks at Economic Conference in Puerto Rico<br />
13:30 08:30 CPI m/m : Jan 0.1% 0.3% 0.3%<br />
13:30 08:30 CPI y/y : Jan 2.7% 2.9% 2.8%<br />
13:30 08:30 Core CPI m/m : Jan 0.1% 0.2% 0.2%<br />
13:30 08:30 Core CPI y/y : Jan 1.8% 1.8% 1.8%<br />
Release dates and forecasts as at c.o.b. prior to the date of publication: See Daily Economic Spotlight for any revision Source: <strong>BNP</strong> Paribas<br />
<strong>Market</strong> Economics 12 February 2010<br />
<strong>Market</strong> <strong>Mover</strong><br />
46<br />
www.Global<strong>Market</strong>s.bnpparibas.com
Key Data Preview<br />
115<br />
105<br />
95<br />
85<br />
75<br />
65<br />
Chart 1: Eurozone Growth & Sentiment<br />
EC Survey:<br />
Economic Sentiment<br />
GDP (% y/y, RHS)<br />
55<br />
-6<br />
96 97 98 99 00 01 02 03 04 05 06 07 08 09 10<br />
Source: Reuters EcoWin Pro<br />
Seas. Adjusted Q4 09 (f) Q3 09 Q2 09 Q1 09<br />
GDP % q/q 0.4 0.4 -0.1 2.5<br />
GDP % y/y -1.8 -4.0 -4.8 -5.0<br />
Key Point:<br />
Survey data signal another robust q/q growth rate in<br />
Q4 although ‘hard’ data highlight the continued<br />
weakness of consumer demand.<br />
5<br />
4<br />
3<br />
2<br />
1<br />
0<br />
-1<br />
-2<br />
-3<br />
-4<br />
-5<br />
<strong>BNP</strong> Paribas Forecast: Picking Up<br />
Eurozone: GDP (Q4 2009, ‘Flash’ Estimate)<br />
Release Date: Friday 12 February<br />
We forecast that eurozone GDP will continue to expand on<br />
a q/q basis in Q4, consistent with the high level of<br />
improvement in a range of leading indicators of activity.<br />
Our prediction of a q/q rate of increase of 0.4% is broadly<br />
in line with the pointers from the reliable survey data such<br />
as the PMI. The industrial sector remains pivotal to the<br />
rebound in the economy. Industrial production is forecast to<br />
expand by over 1% q/q for the second consecutive quarter<br />
after five consecutive contractions up to Q2 2009.<br />
Looking at GDP by expenditure components, exports will<br />
again expand on the basis of the trade figures released for<br />
Q4 to date. Domestic demand, however, remains weak.<br />
Private consumption has increased only once in the past<br />
six quarters on a q/q basis, in Q2 2009, boosted by car<br />
purchase incentives. Retail sales data for Q4 to date point<br />
to another contraction in Q4. <strong>Investment</strong> has fallen on a q/q<br />
basis for six straight quarters though the rate of contraction<br />
has been moderating.<br />
The y/y rate of contraction in GDP will decelerate markedly<br />
due to base effects and, for the same reason, a return to<br />
positive rates of change is likely from Q1 2010 (see chart).<br />
2.5<br />
2.0<br />
1.5<br />
1.0<br />
0.5<br />
0.0<br />
-0.5<br />
-1.0<br />
-1.5<br />
-2.0<br />
-2.5<br />
-3.0<br />
-3.5<br />
Chart 2: German GDP<br />
-4.0<br />
-7.0<br />
91 92 93 94 95 96 97 98 99 00 01 02 03 04 05 06 07 08 09 10<br />
Source: Reuters EcoWin Pro<br />
% y/y (RHS)<br />
% q/q<br />
Seas. Adjusted Q4 09 (f) Q3 09 Q2 09 Q1 09<br />
GDP % q/q 0.4 0.7 0.4 -3.5<br />
GDP % y/y -2.1 -4.8 -5.8 -6.7<br />
Key Point:<br />
Surveys signal another solid q/q rise in GDP, driven<br />
by external rather than domestic demand.<br />
5.0<br />
4.0<br />
3.0<br />
2.0<br />
1.0<br />
0.0<br />
-1.0<br />
-2.0<br />
-3.0<br />
-4.0<br />
-5.0<br />
-6.0<br />
<strong>BNP</strong> Paribas Forecast: External Boost<br />
Germany: GDP (Q4 2009, ‘Flash’ Estimate)<br />
Release Date: Friday 12 February<br />
We expect German GDP to rise on a q/q basis for the third<br />
straight quarter in Q4, albeit at a slower pace than Q3. The<br />
y/y rate of contraction in GDP will decelerate markedly due<br />
to base effects and a return to positive rates of change is<br />
highly probable from Q1 2010 onwards.<br />
The rebound in global manufacturing activity is pivotal to<br />
the pick-up in activity in Germany. Industrial production is<br />
on course to deliver another strong q/q increase in Q4.<br />
Consistent with the global upswing and continued poor<br />
state of domestic demand, the main contribution to growth<br />
in GDP in Germany will be net exports. The trade data for<br />
Q4 to date point to an unusually high contribution from net<br />
trade, outweighing what is likely to be another very weak<br />
quarter for private consumption.<br />
Private consumption fell by 0.9% q/q in Q3, the biggest fall<br />
in ten quarters. This follows two unusually strong quarters,<br />
driven by car purchase incentives. The latter are likely to<br />
have brought demand forward from 2010 which, combined<br />
with what we expect will be a further rise in unemployment<br />
this year, will weigh on spending. Retail sales data for Q4<br />
point to the sixth q/q decline in seven quarters.<br />
<strong>Investment</strong> is likely to be subdued by high uncertainty and<br />
low capacity utilisation rates.<br />
<strong>Market</strong> Economics 12 February 2010<br />
<strong>Market</strong> <strong>Mover</strong><br />
47<br />
www.Global<strong>Market</strong>s.bnpparibas.com
Key Data Preview<br />
Chart 3: France GDP (% q/q) v. Industrial Production<br />
1.5<br />
1.0<br />
0.5<br />
0.0<br />
-0.5<br />
-1.0<br />
-1.5<br />
-2.0<br />
-2.5<br />
GDP (% q/q)<br />
IP (% 3m/3m, RHS)<br />
02 03 04 05 06 07 08 09<br />
Source: Reuters EcoWin Pro<br />
Volume SA-/WDA Q4 (f) Q3 Q2 Q4 08<br />
GDP % q/q 0.6 0.3 0.3 -1.5<br />
GDP % y/y -0.2 -2.3 -2.8 -1.7<br />
PCE % q/q 0.8 0.1 0.4 0.0<br />
External contrib. (pt) -0.6 0.3 0.9 -0.6<br />
Key Point:<br />
We expect a strong rebound, driven by consumption<br />
and inventories.<br />
4<br />
3<br />
2<br />
1<br />
0<br />
-1<br />
-2<br />
-3<br />
-4<br />
-5<br />
-6<br />
-7<br />
-8<br />
-9<br />
<strong>BNP</strong> Paribas Forecast: Rebound<br />
France: GDP (Q4 2009, First Estimate)<br />
Release Date: Friday 12 February<br />
Retail sales of manufactured goods rose 3.0% q/q in Q4,<br />
boosted by car sales (ahead of the reduction of purchase<br />
incentives); excluding autos, retail still printed a strong<br />
1.5% q/q gain. This should obviously benefit GDP growth.<br />
However, a large part of that increase will materialise in<br />
imports (assuming December is unchanged m/m, imports<br />
in Q4 will be up 6.1% q/q).<br />
Another key issue, as in the US, is the behaviour of<br />
inventories. In the past two quarters, inventory contraction<br />
was equivalent to 2.5 percentage points of GDP. This pace<br />
of contraction is clearly unsustainable. More and more<br />
companies are now reporting that stocks are below normal<br />
levels, and some indicated in the latest INSEE survey that<br />
the lack of inventories may create production bottlenecks.<br />
The jump in imports is surely also a sign that the pace of<br />
inventory contraction has eased.<br />
As a result, we forecast PCE and inventory change to be<br />
the main contributors to GDP growth in Q4 and foreign<br />
trade to be the main negative factor.<br />
We forecast GDP growth of 0.6% q/q, the highest rate<br />
since Q3 2007. That, combined with the base effect, should<br />
allow the y/y rate of change to recover to close to zero.<br />
5<br />
4<br />
3<br />
2<br />
1<br />
0<br />
-1<br />
-2<br />
-3<br />
-4<br />
Chart 4: French Labour <strong>Market</strong><br />
GDP (% y/y)<br />
Private Sector Employment (Non-farm Payrolls, % y/y)<br />
80 82 84 86 88 90 92 94 96 98 00 02 04 06 08<br />
Source: Reuters EcoWin Pro<br />
% Q4 (f) Q3 Q2 Q4 08<br />
NF Payrolls (sa) q/q -0.2 -0.6 -0.6 -0.5<br />
NF Payrolls y/y -2.4 -2.7 -2.4 -0.9<br />
Monthly Wage nsa q/q 0.3 0.5 0.4 0.3<br />
Monthly Wage y/y 2.0 2.0 2.2 3.0<br />
Key Point:<br />
The labour market is showing signs of stabilisation.<br />
We expect fewer job losses in Q4 but a pick-up in<br />
wages is only likely to occur in the course of 2010.<br />
<strong>BNP</strong> Paribas Forecast: Stabilisation<br />
France: NF Payrolls and Wages (Q4 2009)<br />
Release Date: Friday 12 February<br />
The adjustment of employment to the sharp economic<br />
slowdown was more rapid than in prior recessions. Rather<br />
than reflecting labour market reforms, this was primarily<br />
due to the corporate sector adapting to existing regulation.<br />
The share of temporary employees and the use of interim<br />
staff have increased in recent years, allowing for a quick<br />
bringing into line of manpower resources with corporate<br />
needs. The increased flexibility of working hours as well as<br />
the rising number of part-time workers has further<br />
increased flexibility. The bottom line is that employment is<br />
likely to stabilise rapidly once the economy shows clear<br />
signs of recovery. Unemployment was still on the rise in<br />
Q4, suggesting continued job losses during that quarter,<br />
but this may soon end.<br />
On the wage front, the rising unemployment rate, absence<br />
of inflation and extremely low capacity utilisation rate all<br />
point to ongoing wage moderation in Q4. The annual<br />
increase in the average monthly wage has fallen a full<br />
percentage point over the last three quarters to an<br />
unsustainably low level of 2.0%. That is consistent with<br />
general wage increases of no more than 0.5% and<br />
individual pay hikes of 1.5%. However, it will be some time<br />
before wages do pick up.<br />
<strong>Market</strong> Economics 12 February 2010<br />
<strong>Market</strong> <strong>Mover</strong><br />
48<br />
www.Global<strong>Market</strong>s.bnpparibas.com
Key Data Preview<br />
Chart 5: Italian GDP and IP<br />
Source: Reuters EcoWin Pro, <strong>BNP</strong> Paribas. Note: Q4 IP based on our<br />
estimates for December<br />
% Q4 (f) Q3 Q2 Q1<br />
GDP q/q 0.1 0.6 -0.5 -2.7<br />
GDP y/y -2.5 -4.6 -5.9 -6.0<br />
Key Point:<br />
Growth will slow from Q3 on seasonal distortions.<br />
The underlying trend is for a modest recovery going<br />
into 2010.<br />
<strong>BNP</strong> Paribas Forecast: Payback<br />
Italy: GDP (Q4 2009)<br />
Release Date: Friday 12 February<br />
The 0.6% q/q rise in Q3 GDP overstated the strength in the<br />
underlying trend due to seasonal distortions. A sharp<br />
increase in August industrial output artificially boosted Q3’s<br />
IP (+4.4% q/q) at the expense of Q4, when we expect<br />
production to have fallen by around 1% q/q. This will be<br />
partly offset by another, albeit modest, increase in services<br />
activity, in line with the persistent improvement shown by<br />
recent surveys.<br />
On the demand side, flat growth in retail sales and survey<br />
evidence point to persistent weakness in consumer<br />
demand. Noteworthy has been the contrast in the services<br />
survey between the sharp improvement in activity for<br />
services to businesses and financials and the weaker<br />
assessment in services for households. Poor employment<br />
prospects and a slowdown in real wage growth will<br />
continue to weigh on consumer demand going into 2010.<br />
Similarly, we expect investment spending to remain<br />
sluggish, given very low capacity utilisation and persistent<br />
uncertainty. Finally, we expect a positive albeit modest<br />
contribution to growth from net trade (+0.2% q/q).<br />
Weakness in domestic demand will persist in 2010. While<br />
we expect the economic recovery to continue, growth will<br />
remain modest.<br />
Chart 6: US Retail Sales in Gradual Recovery<br />
Source: Reuters EcoWin Pro<br />
% m/m Jan (f) Dec Nov Oct<br />
Retail Sales -0.2 -0.3 1.8 1.2<br />
Ex-autos 0.1 -0.2 1.9 0.0<br />
Key Point:<br />
Retail sales are forecast to decline by 0.2% in<br />
January as auto sales declined and sales of general<br />
merchandise weakened.<br />
<strong>BNP</strong> Paribas Forecast: Small Decline<br />
US: Retail Sales (January)<br />
Release Date: Friday 12 February<br />
Retail sales are expected to decline by 0.2% in January<br />
following a small fall in December. Consumers apparently<br />
purchased holiday presents early in Q4 during pre-<br />
Christmas sales and then retreated. In January, retailers<br />
had far less inventory to offer in post-Christmas sales and<br />
therefore sales of general merchandise declined by an<br />
estimated 1%. However, consumers also reduced their<br />
purchases of autos as well. The unit volume of domestic<br />
vehicle sales plunged by 7% in January, with larger SUVs<br />
the hardest hit. The Toyota problems contributed to the fall,<br />
but were not the principle factor behind the large decline.<br />
Retail sales ex automobiles rose by an estimated 0.1%.<br />
Apart from food and healthcare, the only major component<br />
of retail sales to rise in January was gasoline – due to an<br />
estimated 4% rise in gasoline prices. Retail sales in<br />
January ex-gasoline contracted at an estimated 0.5%.<br />
Consequently, the budget constraints faced by many<br />
consumers and ignored before the holidays are finally<br />
causing consumers to hunker down and purchase just the<br />
necessities.<br />
<strong>Market</strong> Economics 12 February 2010<br />
<strong>Market</strong> <strong>Mover</strong><br />
49<br />
www.Global<strong>Market</strong>s.bnpparibas.com
Key Data Preview<br />
Chart 7: US: The Future/Present Wedge Has<br />
Peaked<br />
Source: Reuters EcoWin Pro<br />
Feb p (f) Jan H2 Jan p Jan Dec<br />
Michigan<br />
Sentiment 76.5 75.0 72.8 74.4 72.5<br />
Key Point:<br />
The University of Michigan Index of Consumer<br />
Confidence should increase further in early January<br />
and reach 76.0.<br />
<strong>BNP</strong> Paribas Forecast: Increase<br />
US: Michigan Consumer Sentiment (Feb, Preliminary)<br />
Release Date: Friday 12 February<br />
The final Michigan consumer sentiment index for January<br />
increased to 74.4, 1.9 points higher than the final<br />
December reading of 72.5. This is well above the trough<br />
reached back in November 2008 and the index is at its<br />
strongest since the beginning of recession in January 2008<br />
(when it was at 78.4). The present situation measure has<br />
begun to catch up with the future expectations index lately<br />
and the wedge between present and future has been<br />
trending down toward its long-run mean. This usually<br />
happens when the expansion begins (see Chart).<br />
Sentiment in the Conference Board survey was improving<br />
on hopes for the future rather than on current conditions<br />
until recently. In January, it rebounded to 25.0 from its 26-<br />
year low of 20.2 reached back in December 2009. Oil<br />
prices have reseeded slightly in recent weeks, implying<br />
gasoline costs are likely to decrease in February. In<br />
addition, strong GDP growth in Q4 should support<br />
consumer optimism. Overall, we expect the University of<br />
Michigan index to improve further in early February,<br />
increasing by 2.1 points to 76.5.<br />
2<br />
1<br />
0<br />
-1<br />
-2<br />
-3<br />
-4<br />
Chart 8: Japanese Real GDP (sa, % q/q)<br />
Domestic Demand<br />
(excluding Private inventory)<br />
Private inventory<br />
External<br />
Demand<br />
03 04 05 06 07 08 09<br />
Source: Cabinet Office, <strong>BNP</strong> Paribas<br />
Q4 09 (f) Q3 09 Q2 09 Q1 09<br />
Real (% q/q) 0.9 0.3 0.7 -3.1<br />
Real (% annualized) 3.8 1.3 2.7 -11.9<br />
Real (% y/y) -1.2 -5.1 -5.8 -8.9<br />
Key Point:<br />
Led by brisk exports, coupled with a rebound in<br />
domestic demand, Q4 2009 real GDP will likely show<br />
robust annualised growth of 3.8%. Even so, it will be<br />
a while yet before an autonomous growth<br />
mechanism begins.<br />
<strong>BNP</strong> Paribas Forecast: Robust Growth<br />
Japan: GDP (Q4 2009)<br />
Release Date: Monday 15 February<br />
The preliminary (first) estimate of Q4 2009 GDP will likely<br />
show that the growth accelerated from 0.3% q/q in Q3<br />
(1.3% annualised) to 0.9% q/q (3.8% annualised). Growth<br />
in Q4 will have been led by booming exports, while<br />
domestic demand has also finally stopped contracting<br />
thanks to the stabilisation of capital investment (this had<br />
been weak for a long time). However, a large revision in<br />
the second estimate cannot be ruled out, as occurred the<br />
previous quarter (Q3 growth was marked down to an<br />
annualised 1.3% from 4.8%, with revisions in capital<br />
investment and inventories the key factors).<br />
That said, the domestic economy remains fundamentally<br />
weak as the positive cyclical feedback loop between<br />
income and expenditure has yet to kick in. Meanwhile, the<br />
impact of fiscal stimulus is expected to fade in coming<br />
quarters and the economy will likely enter a soft patch in<br />
the spring. With exports (especially to the rest of Asia)<br />
likely to continue expanding solidly, we believe that the soft<br />
patch will be mild. However, it will be a while yet before an<br />
autonomous growth mechanism starts to function.<br />
<strong>Market</strong> Economics 12 February 2010<br />
<strong>Market</strong> <strong>Mover</strong><br />
50<br />
www.Global<strong>Market</strong>s.bnpparibas.com
Key Data Preview<br />
Source: Reuters EcoWin Pro<br />
Chart 9: UK CPI vs RPI<br />
Jan (f) Dec Nov Oct<br />
CPI % m/m 0.0 0.6 0.3 0.2<br />
CPI % y/y 3.6 2.9 1.9 1.5<br />
RPI Index 217.6 218.0 216.7 216.0<br />
RPI % y/y 3.6 2.4 0.3 -0.8<br />
RPIX % y/y 4.5 3.8 2.7 1.9<br />
Key Point:<br />
We expect a final month of accelerating inflation in<br />
January, largely due to the VAT hike.<br />
<strong>BNP</strong> Paribas Forecast: Rising<br />
UK: CPI (January)<br />
Release Date: Tuesday 16 February<br />
We expect UK CPI to post a final month of accelerating<br />
inflation during January. The big story this month is the<br />
return of the rate of VAT to 17.5%. Given the extent of the<br />
upward surprise last month, there is some suggestion that<br />
some firms passed on the VAT hike early. However, we<br />
also believe that conservative management of Christmas<br />
inventories has meant that the degree of discounting was<br />
probably less generous than last year.<br />
When VAT was cut, this tended to depress the CPI by<br />
around 0.7 percentage points – slightly less than if there<br />
had been full pass-through. Full pass-through of the VAT<br />
hike could add a full percentage point to % y/y inflation.<br />
However, several retailers have reported that they will not<br />
pass on the VAT hike while others have said it will be<br />
deferred. Hence we expect an addition of around 0.75<br />
points in January.<br />
RPI inflation is likely to rise slightly more sharply, not least<br />
given accelerating house price inflation and base effects<br />
related to the mortgage interest component.<br />
We believe that January will mark the peak, with base<br />
effects becoming more favourable from February onwards.<br />
Chart 10: UK Employment and GDP<br />
Source: Reuters EcoWin Pro<br />
Jan (f) Dec Nov Oct<br />
Claimant Count Chg -15k -15k -11k 6.0k<br />
ILO Unemp 3m-Chg -5k -7k 21k<br />
ILO Emp 3m-Chg 5k -14k 52k<br />
Weekly Earns 3m/yr 0.9% 0.7% 0.6%<br />
Ex-Bonus 3m/yr 1.2% 1.1% 1.2%<br />
Key Point:<br />
We expect another robust month of improvement in<br />
the key labour market indicators. The new measure<br />
of wage inflation is likely to rise from a low level.<br />
<strong>BNP</strong> Paribas Forecast: Improving<br />
UK: Labour Report (January)<br />
Release Date: Wednesday 17 February<br />
We expect further signs of firming in the UK labour market<br />
in the January Labour Report. Claimant count<br />
unemployment has been lower than expected for the last<br />
nine consecutive months, culminating in a 15k decline in<br />
unemployment during December. Given the continued<br />
upward trajectory in survey indicators of output growth, we<br />
expect further improvement in the labour data. We expect<br />
another robust reading in January, a 15k fall.<br />
The ILO data (which are a month behind the claimant<br />
count) have also been on an improving trend. We expect<br />
employment to have posted an increase in the last three<br />
months and unemployment to have registered a small<br />
decline. Since these data are a 3-month change, they take<br />
a little longer to turn the corner. Data in the coming months<br />
are likely to show a more substantial improvement.<br />
The ONS has changed its preferred measure of wage<br />
inflation. The average earnings index has been replaced by<br />
average weekly earnings. This is based on the same<br />
underlying data, but different methodology. The new series<br />
tends to be more variable, partly because it includes more<br />
outliers, so we are braced for some big surprises. We<br />
expect a small acceleration in December, though from a<br />
low level.<br />
<strong>Market</strong> Economics 12 February 2010<br />
<strong>Market</strong> <strong>Mover</strong><br />
51<br />
www.Global<strong>Market</strong>s.bnpparibas.com
Key Data Preview<br />
Chart 11: US: Housing Starts & Building Permits<br />
Source: Reuters EcoWin Pro<br />
Jan (f) Dec Nov Oct<br />
Housing Starts<br />
(000s, saar) 580 557 580 524<br />
Key Point:<br />
Housing starts are forecast to increase by 4.1% m/m<br />
in January to 580k annualised units.<br />
<strong>BNP</strong> Paribas Forecast: Small Increase<br />
US: Housing Starts (January)<br />
Release Date: Wednesday 17 February<br />
After troughing in spring 2009, housing starts picked up<br />
during the summer months and then stalled towards the<br />
end of the year. We forecast starts will resume their<br />
moderate upward trend going forward, although at a much<br />
slower pace than during previous cycles, and will reach<br />
580k in January. Inventories of new homes have declined<br />
noticeably in recent months, suggesting a pick-up in<br />
activity. Nevertheless, record foreclosures and<br />
unemployment near a 26-year high represent hurdles that<br />
may prevent the industry from strengthening much further.<br />
Building permits unexpectedly jumped 10.9% in December,<br />
signalling gains in housing will be sustained into 2010.<br />
Nonetheless, there is some anecdotal evidence that the<br />
leap in building permits at the end of 2009 was due to<br />
builders submitting applications in anticipation of cost<br />
increases in 2010. Thus, we expect a longer lag between<br />
permits and starts and the recent increase in permits to<br />
feed through to starts over the next three months.<br />
Chart 12: US Industrial Production<br />
Source: Reuters EcoWin Pro<br />
Jan (f) Dec Nov Oct<br />
Ind. Prod. (% m/m) 0.9 0.6 0.6 0.2<br />
Cap. Util (%) 72.8 72.0 71.5 71.0<br />
<strong>BNP</strong> Paribas Forecast: Another Solid Gain<br />
US: Industrial Production (January)<br />
Release Date: Wednesday 17 February<br />
Industrial production is expected to surge 0.9% m/m in<br />
January after solid 0.6% gains in December and<br />
November. Our forecast would imply an increase in<br />
capacity utilisation to 72.8%, the highest reading since<br />
November 2008. The gains should be broad-based,<br />
reflecting the strength in the January ISM and<br />
manufacturing hours worked. A number of sectors appear<br />
to have worked off excess inventories, allowing firms to<br />
ramp up production. Auto production is expected to be a<br />
positive factor as is utility output: Data on electricity<br />
generation showed a further increase on continued cold<br />
temperatures. Mining activity should also see a moderate<br />
gain as this sector benefits from the more robust recovery<br />
in many emerging markets.<br />
Key Point:<br />
Industrial production is expected to rise 0.9% in<br />
January, leading capacity utilisation to increase to<br />
72.8%.<br />
<strong>Market</strong> Economics 12 February 2010<br />
<strong>Market</strong> <strong>Mover</strong><br />
52<br />
www.Global<strong>Market</strong>s.bnpparibas.com
Key Data Preview<br />
Chart 13: Norwegian Mainland GDP<br />
Source: Reuters EcoWin Pro<br />
Q4 (f) Q3 Q2 Q1<br />
Mainland GDP % q/q 0.6 0.5 0.3 -0.9<br />
Mainland GDP % y/y 0.6 -1.4 -2.0 -1.7<br />
Total GDP % q/q 0.7 0.9 -0.9 -0.7<br />
Total GDP % y/y -0.1 -0.7 -2.3 -1.1<br />
Key Point:<br />
Both activity data and surveys indicate that the GDP<br />
continued to expand in Q4.<br />
<strong>BNP</strong> Paribas Forecast: Further Expansion<br />
Norway: GDP (Q4 2009)<br />
Release Date: Thursday 18 February<br />
In Q3, Norwegian mainland GDP growth at 0.5% q/q was<br />
weaker than market expectations at 0.8%, while total GDP<br />
growth surprised slightly to the upside. The main<br />
contributor to growth was net trade. Oil sector output also<br />
rose, by 2.0% q/q after falling 4.8% in Q2, leading to a<br />
significant increase in total GDP growth.<br />
In Q4, we expect mainland GDP to have continued<br />
expanding on a q/q basis. On the consumer side, retail<br />
sales rose by 0.8% q/q in Q4. Although this is down from<br />
1.2% in Q3, it is still a robust reading. Also, new car<br />
registrations rose for a third quarter in a row, posting a<br />
17.8% q/q increase in Q3. These, together with an<br />
improvement in consumer confidence, point to an increase<br />
in private consumption over the quarter.<br />
Monthly export data show that exports including oil and<br />
natural gas rose further in Q4, but at a slower pace. After a<br />
fall in Q3, imports also ticked higher. Therefore, we expect<br />
both exports and imports to rise, but the contribution from<br />
net trade should decline. Also, the pace of improvement in<br />
manufacturing production eased in Q4, suggesting<br />
continued contraction in investment, but to a lesser extent<br />
than in Q3.<br />
Overall, we expect mainland and total GDP to have<br />
expanded by 0.6% and 0.7 q/q in Q4 respectively.<br />
Chart 14: US: Pressure on Core PPI Eases<br />
Source: Reuters EcoWin Pro<br />
% m/m Jan (f) Dec Nov Oct<br />
Headline 0.8 0.2 1.8 0.3<br />
Ex-food & energy 0.2 0.0 0.5 -0.6<br />
Key Point:<br />
Stronger food and energy prices suggest PPI should<br />
increase by 0.8% m/m in January.<br />
<strong>BNP</strong> Paribas Forecast: Increase<br />
US: PPI (January)<br />
Release Date: Thursday 18 February<br />
We expect PPI to have increased by 0.8% m/m in January.<br />
Strength should be driven by energy prices which are<br />
forecast to increase by 2.8% m/m, as gasoline prices rose<br />
around 4.5% on the month. Food prices are forecast to<br />
increase by 1.5% m/m in January, reflecting mounting<br />
pressures in commodity food costs. Indeed, while sluggish<br />
demand in 2009 probably delayed the pass-through to<br />
consumer prices last year, higher food prices have now<br />
trickled through the food production pipeline and are<br />
expected to support headline inflation over the next few<br />
months. Core PPI is forecast to increase by 0.2% m/m after<br />
remaining unchanged the previous month. Ongoing<br />
strength in metal prices points to upside risks in auto<br />
prices. In addition, while tight credit conditions and<br />
subdued final demand have so far constrained investment<br />
spending, recent durable goods orders data suggest firms<br />
have increased spending on equipment and software.<br />
Against this background of firmer industrial demand, higher<br />
commodity prices risk being passed on to final goods<br />
prices, pointing to upside risks for producer prices.<br />
<strong>Market</strong> Economics 12 February 2010<br />
<strong>Market</strong> <strong>Mover</strong><br />
53<br />
www.Global<strong>Market</strong>s.bnpparibas.com
Key Data Preview<br />
Chart 15: US Leading Indicators Suggest Growth<br />
Source: Reuters EcoWin Pro<br />
Jan (f) Dec Nov Oct<br />
Lead Index (% m/m) 0.6 1.1 1.0 0.3<br />
6-mo. ann. chg. (%) 10.0 10.8 10.2 11.0<br />
<strong>BNP</strong> Paribas Forecast: A More Modest Gain<br />
US: Leading Indicators (January)<br />
Release Date: Thursday 18 February<br />
The index of leading indicators is expected to rise 0.6% in<br />
January after surging 1.1% in December. Our forecast<br />
would suggest a slight cooling in the 6-month annualised<br />
rate to 10.0% from 10.8% in December. This is line with the<br />
deceleration we anticipate in GDP growth to 2.4% q/q saar<br />
in Q1 from 5.7% in Q4. The index will be influenced by a<br />
number of cross currents; the decline in the stock market<br />
and a backing up in initial jobless claims will weigh on the<br />
index while an increase in the ISM index of supplier<br />
deliveries, a still-steep yield curve, an improvement in<br />
consumers’ assessments of future conditions and a modest<br />
rise in building permits will be positive factors that keep the<br />
index rising overall.<br />
Key Point:<br />
A more modest gain in the index of leading<br />
indicators is expected in January.<br />
Chart 16: Canadian Inflation<br />
<strong>BNP</strong> Paribas Forecast: Increase<br />
Canada: CPI (January)<br />
Release Date: Thursday 18 February<br />
Source: Reuters EcoWin Pro<br />
m/m % Jan (f) Dec Nov Oct<br />
CPI 0.3 -0.3 0.5 -0.1<br />
Bank of Canada Core 0.2 -0.3 0.4 0.1<br />
Key Point:<br />
Higher gasoline prices, a rebound in clothing prices<br />
and mounting pressures on shelter costs suggest<br />
Canadian CPI inflation will increase by 0.3% m/m in<br />
January.<br />
Canadian CPI inflation is forecast to increase by 0.3% m/m<br />
in January. Because headline CPI declined by 0.3% m/m in<br />
January 2009, large base effects will push the headline<br />
index up by 1.9% on a year-on-year basis, marking the<br />
highest reading in over a year. Strength should be driven<br />
by gasoline prices, which are forecast to have increased by<br />
3.0% m/m. Additional upward pressures should come from<br />
clothing prices. In December, clothing prices plunged by<br />
4.7% m/m, the largest monthly decline for this month in the<br />
series’ 60-year history. Given that large discounts during<br />
the holiday shopping season tend to be followed by higher<br />
prices earlier in the year, we expect apparel prices to<br />
increase by 1.0% m/m in January. Shelter prices are<br />
expected to increase by 0.2%, reflecting an up-tick in<br />
household energy costs and recent increases in house<br />
prices (which feed into the CPI index directly through their<br />
effect of the CPI replacement component). Excluding the<br />
eight most volatile components and the effect of indirect<br />
taxes, the Bank of Canada core CPI is expected to<br />
increase 0.2% m/m in January. Base effects will play a<br />
very large role as the core CPI index declined by 0.4%<br />
m/m in January 2009. As a result, we expect core inflation<br />
to jump to 2.1% y/y in January from 1.5% previously.<br />
<strong>Market</strong> Economics 12 February 2010<br />
<strong>Market</strong> <strong>Mover</strong><br />
54<br />
www.Global<strong>Market</strong>s.bnpparibas.com
Key Data Preview<br />
Chart 17: UK Retail Sales vs BRC Retail Sales<br />
Monitor<br />
Source: Reuters EcoWin Pro<br />
Jan (f) Dec Nov Oct<br />
% m/m -0.6 0.3 -0.3 0.5<br />
% y/y 1.0 2.1 2.7 3.5<br />
% 3m/3m 0.2 0.7 0.7 1.1<br />
% 3m/yr 1.9 2.7 3.0 2.8<br />
Key Point:<br />
We expect a weather-induced contraction in retail<br />
sales in January.<br />
<strong>BNP</strong> Paribas Forecast: Weather distortion<br />
UK: Retail Sales (December)<br />
Release Date: Friday 19 February<br />
We expect UK retail sales to post a 0.6 percentage point<br />
contraction in January, heavily influenced by the weather.<br />
More specifically, the worst snowfall in decades brought<br />
many parts of the country to a standstill. This will have<br />
physically prevented consumers from getting to the shops.<br />
There is also the possibility that the VAT hike may have<br />
acted as a drag on spending.<br />
Survey indicators have been pretty poor indicators of<br />
official retail sales in recent months. Nonetheless, for what<br />
it is worth, both the CBI and BRC gauges of high street<br />
spending suffered setbacks in January. The accompanying<br />
commentary attributed this to the poor weather.<br />
December’s retail sales data were disappointing despite<br />
upbeat survey indications. We suspect that less generous<br />
than usual discounting was responsible. In turn, this is<br />
likely to have reflected cautious Christmas inventory<br />
management, restricting the need to slash prices. If this is<br />
the case, it is also likely to have suppressed retail sales<br />
growth during January.<br />
Overall, we expect a weather-distorted reading. The<br />
flipside is that February’s data are likely to enjoy a bounce<br />
following the big thaw.<br />
30<br />
20<br />
10<br />
0<br />
-10<br />
-20<br />
-30<br />
-40<br />
-50<br />
-60<br />
-70<br />
-80<br />
Chart 18: French Industrial Survey<br />
Own Production Outlook<br />
General Production Outlook<br />
Composite Indicator (RHS)<br />
01 02 03 04 05 06 07 08 09<br />
Source: Reuters EcoWin Pro<br />
115<br />
110<br />
105<br />
100<br />
95<br />
90<br />
85<br />
80<br />
75<br />
70<br />
65<br />
SA Feb (f) Jan 10 Dec Feb 09<br />
Composite index 93 92 88 70<br />
Overall Manuf. Outlook -4 -4 -11 -76<br />
Own Manuf. Outlook -6 -9 -8 -46<br />
Key Point:<br />
The financial markets turmoil may weigh on<br />
business confidence, but should not affect the<br />
INSEE industrial survey too heavily.<br />
<strong>BNP</strong> Paribas Forecast: Smaller Gain<br />
France: Monthly Industrial Survey (February)<br />
Release Date: Friday 19 February<br />
After a correction at the end of 2009, industrial confidence,<br />
according to the monthly INSEE survey, started to recover<br />
in January. The correction was stronger for the own<br />
production average and the recovery has not yet started,<br />
while the general outlook has performed better.<br />
Looking at other business surveys for France, it is notable<br />
that PMIs have either stabilised (for manufacturing) or<br />
declined (for services) over the last few months, while Bank<br />
of France and European Commission surveys are still on a<br />
rising trend. This difference may be explained by the fact<br />
that PMIs have been above their long-term average since<br />
last summer while the two others only reached this level in<br />
December.<br />
We believe the own production outlook should recover,<br />
while the general perception should stabilise. The former<br />
should be supported by the higher orders already reported<br />
in January survey, while the latter sub-index may suffer<br />
from the general economic uncertainties.<br />
Clearly, the very poor equity market performance and the<br />
turmoil seen on the bond market during the first week of<br />
February are a threat to business confidence. However, we<br />
believe that the INSEE industrial survey should not be<br />
overly affected.<br />
<strong>Market</strong> Economics 12 February 2010<br />
<strong>Market</strong> <strong>Mover</strong><br />
55<br />
www.Global<strong>Market</strong>s.bnpparibas.com
Key Data Preview<br />
Chart 21: US Total vs. Core CPI Inflation<br />
Source: Reuters EcoWin Pro<br />
% m/m Jan (f) Dec Nov Oct<br />
CPI 0.3 0.1 0.4 0.3<br />
Core 0.2 0.1 0.0 0.2<br />
NSA (index) 217.05 215.95 216.33 216.18<br />
Key Point:<br />
CPI should increase by 0.3% in December, driven by<br />
higher energy prices.<br />
<strong>BNP</strong> Paribas Forecast: Moderate Increase<br />
US: Consumer Price Index (January)<br />
Release Date: Friday 19 February<br />
Headline CPI is expected to increase 0.3% m/m in<br />
January. The forecast for January is complicated by the<br />
fact that the BLS will revise its seasonal adjustment factors<br />
as well as the weights of the CPI basket. Weights depend<br />
on relative prices and gasoline prices have increased since<br />
last year. Therefore, the weight for CPI energy will likely be<br />
revised higher in 2010, suggesting gasoline price swings<br />
will have a large impact on headline CPI this year. In<br />
January, we forecast that energy prices increased by 2.4%<br />
m/m, driven by a 4.3% expected rise in gasoline prices.<br />
Food prices are expected to increase by 0.2% m/m,<br />
reflecting upward pressures on supermarket prices. The<br />
CPI food-at-home component rose by 0.3% m/m in<br />
December and is expected to post a similar gain in<br />
January, as pressures in food commodity prices have<br />
intensified recently. Excluding food and energy, core CPI<br />
should increase by 0.2% m/m. While underlying price<br />
pressures remain contained, metal prices have been<br />
trending higher in recent months. Upward pressures have<br />
already surfaced in import and producer prices and have<br />
the potential to filter through to CPI prices. Auto prices<br />
would likely be the first CPI component to be affected by<br />
this upside risk. Despite this, sluggish shelter prices and<br />
plummeting unit labour costs suggest underlying price<br />
pressures should remain contained. In non-seasonally<br />
adjusted terms, headline CPI should increase to 217.05 in<br />
January from 215.95 previously.<br />
<strong>Market</strong> Economics 12 February 2010<br />
<strong>Market</strong> <strong>Mover</strong><br />
56<br />
www.Global<strong>Market</strong>s.bnpparibas.com
Economic Calendar: 15 February – 12 March<br />
22 February 23 February 24 February 25 February 26 February<br />
Italy: Non-EU Trade<br />
Balance Jan<br />
Neths: Consumer<br />
Confidence Feb<br />
<strong>Market</strong> Economics 12 February 2010<br />
<strong>Market</strong> <strong>Mover</strong><br />
Japan: BoJ Monetary<br />
Policy Meeting Minutes<br />
UK: CBI Distributive<br />
Trades Jan<br />
Germany: Ifo Survey Feb<br />
France: Retail Sales Jan,<br />
CPI Jan, Housing Starts<br />
Jan<br />
Italy: CPI Jan, ISAE<br />
Consumer Confidence<br />
Feb<br />
Neths: Producer<br />
Confidence Feb<br />
Belgium: Business<br />
Confidence Feb<br />
US: Consumer<br />
Confidence Feb,<br />
S&P/Case-Schiller Home<br />
Price Index Dec<br />
Japan: Trade Balance<br />
Jan<br />
Eurozone: Industrial<br />
Orders Dec<br />
Germany: GDP (Final)<br />
Q4, GfK Consumer<br />
Confidence Mar<br />
France: Job Seekers Jan<br />
Italy: Retail Sales Dec<br />
Norway: Labour (sa) Dec<br />
US: New Home Sales Jan<br />
Eurozone: Monetary<br />
Developments Jan,<br />
Business & Consumer<br />
Survey Feb, Retail PMI<br />
Feb<br />
Germany: Labour Jan<br />
France: PPI Feb,<br />
Consumer Confidence<br />
Feb<br />
Italy: ISAE Business<br />
Confidence Feb<br />
Spain: PPI Jan<br />
Sweden: PPI Jan,<br />
Consumer Conf Feb<br />
Norway: Labour (nsa) Dec<br />
Belgium: CPI Feb<br />
US: Durable Goods<br />
Orders Jan, FHFA HPI<br />
Dec & Q4<br />
During Week: Germany Import Prices Jan, UK Nationwide House Prices Feb<br />
1 March 2 March 3 March 4 March 5 March<br />
Eurozone: Labour Jan,<br />
PMI Man (Final) Feb<br />
UK: CIPS Man Feb, Net<br />
Consumer Credit Jan,<br />
Mortgage Approvals Jan<br />
Italy: GDP 2009<br />
Sweden: GDP Q4<br />
Norway: Retail Sales Jan<br />
Switz: PMI Feb<br />
US: Personal Inc & Exp<br />
Jan, ISM Man Feb,<br />
Construction Spending<br />
Jan, Help Wanted Feb<br />
Canada: GDP Dec & Q4<br />
Japan: Labour Jan,<br />
Household Consumption<br />
Jan<br />
Australia: Retail Sales<br />
Jan, RBA Rate<br />
Announcement<br />
Eurozone: HICP (Flash)<br />
Feb, PPI Jan<br />
Italy: CPI Feb<br />
Switz: GDP Q4<br />
US: Vehicle Sales Feb<br />
Canada: BoC Rate<br />
Announcement<br />
Australia: GDP Q4<br />
Eurozone: Retail Sales<br />
Jan, PMI <strong>Services</strong> (Final)<br />
Feb<br />
UK: CIPS <strong>Services</strong> Feb<br />
US: ISM <strong>Services</strong> Feb,<br />
Challenger Layoffs Feb,<br />
ADP Employment Change<br />
Feb, Beige Book<br />
Australia: Trade Balance<br />
Jan<br />
Eurozone: GDP (2 nd Est)<br />
Q4, ECB Rate Ann &<br />
Press Conference<br />
UK: BoE Rate Ann, BoE<br />
Asset Purchase Target<br />
Mar<br />
Neths: CPI Feb<br />
US: Non-Farm<br />
Productivity (Final) Q4,<br />
ULC (Final) Q4, Factory<br />
Orders Jan, Pending<br />
Home Sales Jan<br />
During Week: Germany Retail Sales Jan, Import Prices Jan, UK Halifax House Prices Feb<br />
8 March 9 March 10 March 11 March 12 March<br />
Japan: M2 Feb, Current<br />
Account Jan<br />
Germany: Industrial<br />
Production Jan<br />
France: BoF Survey (Prel)<br />
Feb<br />
Japan: Leading indicator<br />
Jan<br />
Australia: NAB Business<br />
Confidence Feb, Westpac<br />
Consumer Confidence<br />
Mar<br />
UK: RICS House Price<br />
Balance Jan, BRC Retail<br />
Sales Monitor Feb, Trade<br />
Balance Jan<br />
France: Trade Balance<br />
Jan<br />
Switz: CPI Feb<br />
Japan: CGPI Feb,<br />
Machinery Orders Jan<br />
UK: IP Jan<br />
Germany: Trade Balance<br />
Jan, CPI Feb, HICP Feb<br />
France: IP Jan<br />
Italy: IP Jan, GDP (Final)<br />
Q4<br />
Spain: Retail Sales Jan<br />
Belgium: GDP (Rev) Q4<br />
Sweden: IP Jan, AMV<br />
Unemployment Feb<br />
Norway: CPI Feb, PPI Feb<br />
US: Wholesale Trade Jan,<br />
Treasury Statement Feb<br />
Japan: GDP (Rev) Q4<br />
Australia: Labour Feb<br />
Eurozone: ECB Monthly<br />
Bulletin<br />
Germany: LCI Q4<br />
France: Budget Balance<br />
Jan, Non-Farm Payrolls<br />
(Final) Q4<br />
Sweden: CPI Feb<br />
Switz: SNB Rate<br />
Announcement<br />
US: Trade Balance Jan<br />
During Week: Germany WPI Feb<br />
15 March 16 March 17 March 18 March 19 March<br />
Eurozone: Employment<br />
Q4<br />
UK: Rightmove House<br />
Prices Mar<br />
US: Empire State Survey<br />
Mar, Industrial Production<br />
Feb, TICS Data Jan,<br />
NAHB Housing <strong>Market</strong><br />
Index Mar<br />
Source: <strong>BNP</strong> Paribas<br />
Australia: RBA MPC<br />
Minutes<br />
Eurozone: HICP Feb,<br />
EU25 New Car Reg Feb<br />
UK: DCLG House Prices<br />
Jan<br />
Germany: ZEW Survey<br />
Mar<br />
France: CPI Feb<br />
Italy: CPI Feb<br />
Neths: IP Jan, Retail<br />
Sales Jan<br />
US: Import Prices Feb,<br />
Housing Starts Feb,<br />
FOMC Rate Ann<br />
Japan: BoJ Rate<br />
Announcement<br />
Eurozone: LCI Q4<br />
UK: BoE MPC Minutes,<br />
Labour Feb<br />
US: PPI Feb<br />
World: Opec Meeting<br />
Japan: CPI Tokyo Feb,<br />
CPI National Jan, IP Jan,<br />
Housing Starts Jan, Retail<br />
Sales Jan<br />
Eurozone: HICP Jan,<br />
Eurocoin Feb<br />
UK: GfK Consumer Conf<br />
Feb, GDP (2 nd Est) Q4<br />
Germany: States’ CoL<br />
Feb, HICP (Flash) Feb<br />
Italy: PPI Jan<br />
Spain: HICP (Prel) Feb<br />
Sweden: Retail Sales Jan<br />
Switz: KOF Leading<br />
Indicator Feb<br />
US: GDP (2 nd Release)<br />
Q4, Chicago PMI Feb,<br />
Existing Home Sales Jan,<br />
UoM Sentiment (Final) Feb<br />
UK: PPI Feb<br />
Germany: Factory Orders<br />
Jan<br />
Spain: Industrial<br />
Production Jan<br />
Norway: Industrial<br />
Production Jan<br />
US: Labour Feb,<br />
Consumer Credit Jan<br />
Eurozone: Industrial<br />
Production Jan<br />
France: Current Account<br />
Jan<br />
Spain: CPI Feb<br />
US: Retail Sales Feb, UoM<br />
Sentiment (Prel) Mar,<br />
Business Inventories Jan<br />
Canada: Labour Feb<br />
Eurozone: Governing Germany: PPI Feb<br />
Council Meeting (No France: Non-Farm<br />
Rate Announcement), Payrolls (Final) Q4, Wages<br />
Current Account Jan, (Final) Q4<br />
Trade Balance Jan Italy: Industrial Production<br />
UK: PSNCR Feb, PSNB Jan<br />
Feb<br />
Sweden: PPI Jan<br />
Italy: EU Trade Bal Jan Canada: CPI Feb<br />
Sweden: Labour (nsa) Feb<br />
Neths: Consumer<br />
Confidence Mar, Labour<br />
Feb<br />
US: CPI Feb, Leading<br />
Indicators Feb, Philly Fed<br />
Mar, Current Account Q4<br />
Release dates as at c.o.b. prior to the date of this publication. See our Daily Spotlight for any revisions<br />
57<br />
www.Global<strong>Market</strong>s.bnpparibas.com
Treasury and SAS Issuance Calendar<br />
Daily update onto https://globalmarkets.bnpparibas.com, Tools & Apps, Analytical Tools, <strong>Market</strong> Calendar, Government Flows<br />
In the pipeline - Treasuries:<br />
Spain: To issue a new syndicated 15y Obligacion in Feb (exact date to be confirmed)<br />
France: To consider a dollar-denominated bond issue in 2010<br />
Germany: Reserves the right to issue foreign currency bonds, as market conditions allow<br />
Greece: Plans to issue a 10y bond via a syndicated deal (EUR 3-5bn) (not to be held before the end of February at the earliest)<br />
Poland: Plans to sell at least USD 1bn of dollar-denominated bonds (maturity shorter than 10y) in Q1<br />
UK: Gilt 4% Jan 2060 to be tapped (syndication) in the period 17-25 February<br />
Finland: To issue new 5y & 10y RFGBs and to tap 4 to 5 auctions with possibly 2-3 in H1 (details announced a week prior to auctions).<br />
Neths: To issue a new 30y DSL (DDA, before the summer) - No plans for inflation-linked bonds - May issue a dollar-denominated bond (in '10)<br />
Czech Rep.: Issue in euros possible and a dollar-denominated bond is under consideration<br />
Denmark: To issue a EUR 5y loan (EUR 1-2bn) in H1 '10 - To open new 5y & 10y DGBs H2 '10 - To launch a T-bill programme on 25 Feb<br />
Slovak Rep.: Plans an up to EUR 1.5bn syndicated 10y before the end of Q1<br />
During the week:<br />
UK: Index-Linked Gilt 0.75% Nov 2047 (mini tender)<br />
FHLB: February Global Notes auction details to be announced on Wed 17 Feb<br />
Date Day Closing Country Issues Details <strong>BNP</strong>P forecasts<br />
Local GMT<br />
12/02 Fri 12:00 03:00 Japan Bonds (buyback)<br />
10:55 09:55 Italy BTP 3% Apr 2015 EUR 2.5-3.5bn<br />
BTP 3.75% Aug 2021<br />
EUR 1-2bn<br />
BTP 5% Mar 2025<br />
EUR 2-2.5bn<br />
16/02 Tue 12:00 03:00 Japan JGB Dec 2014 JPY 2.4tn<br />
10:00 10:00 Ireland Gilt 4% Jan 2014<br />
Gilt 4.5% Apr 2020<br />
12 Feb EUR 1-1.5bn<br />
Denmark DGB 4% Nov 2019 DKK 5bn<br />
12:00 17:00 Canada Repurchase of 8 Cash Mgt Bonds (Jun-10-Jun-11) CAD 1bn<br />
17/02 Wed 11:00 10:00 Germany Schatz Mar 2012 (new) EUR 7bn<br />
10:30 10:30 Portugal OT 3.2% Apr 2011 (reverse auction) EUR 0.5bn<br />
12:00 17:00 Canada CAN 30-year 11 Feb<br />
18/02 Thu 10:30 09:30 Spain Obligacion 4.2% Jan 2037 15 Feb EUR 2-3bn<br />
10:50 09:50 France BTANs 2- &/or 5-year 12 Feb EUR 7-9bn<br />
11:50 10:50 France OATis , OATeis, BTANeis 12 Feb<br />
11:00 10:00 Sweden ILB 3.5% Dec 2015 (# 3105) SEK 0.5bn<br />
19/02 Fri 12:00 03:00 Japan Auction for enhanced liquidity 12 Feb JPY 0.6tn<br />
22/02 Mon 12:00 11:00 Belgium OLO 15 Feb<br />
Slovak Rep. SLOVGB 3.5% Feb 2016 (#213) (new) EUR 0.3-0.5bn<br />
13:00 18:00 US TIPS 30-year (new) 18 Feb USD 12bn<br />
23/02 Tue 12:00 03:00 Japan JGB 20-year 16 Feb JPY 1.1tn<br />
10:55 09:55 Italy CTZ 18 Feb<br />
Neths DSLs (off-the-run facility) 17 Feb EUR 1bn<br />
13:00 18:00 US Notes 2-year (new) 18 Feb USD 44bn<br />
24/02 Wed 10:55 09:55 Italy BTPeis 18 Feb<br />
11:00 10:00 Sweden T-bonds 17 Feb<br />
10:30 10:30 Portugal OTs (to be confirmed) 18 Feb<br />
10:30 10:30 UK Gilt 3.75% Sep 2019 16 Feb<br />
Denmark DGB 4% Nov 2010 (buyback)<br />
12:00 17:00 Canada CANi 30-year 18 Feb<br />
13:00 18:00 US Notes 5-year (new) 18 Feb USD 42bn<br />
25/02 Thu 12:00 03:00 Japan JGB 2-year 18 Feb JPY 2.6tn<br />
10:55 09:55 Italy 3 & 10y BTPs and CCT 18 Feb EUR 7-9bn<br />
13:00 18:00 US Notes 7-year (new) 18 Feb USD 32bn<br />
02/03 Tue 12:00 03:00 Japan JGB 10-year 23 Feb JPY 2.2tn<br />
10:30 10:30 UK Gilt 4.25% Sep 2039 23 Feb<br />
03/03 Wed 11:00 10:00 Germany OBL 2.5% Feb 2015 (Series 156) EUR 5bn<br />
10:30 10:30 UK Gilt 2.75% Jan 2015 23 Feb<br />
12:00 17:00 Canada CAN 5-year 25 Feb<br />
04/03 Thu 12:00 03:00 Japan Auction for enhanced liquidity 25 Feb JPY 0.6tn<br />
10:30 09:30 Spain Bono 5-year (2015) (new) 1 Mar<br />
10:50 09:50 France OATs 10- &/or 15- &/or 30-year 26 Feb<br />
Sources: Treasuries, <strong>BNP</strong> Paribas<br />
Interest Rate Strategy 12 February 2010<br />
<strong>Market</strong> <strong>Mover</strong>, Non-Objective Research Section<br />
58<br />
www.Global<strong>Market</strong>s.bnpparibas.com
Next week's T-Bills Supply<br />
Date Country Issues Details<br />
12/02 UK T-Bills Mar 2010 GBP 1bn<br />
T-Bills May 2010<br />
GBP 2bn<br />
T-Bills Aug 2010<br />
GBP 1.5bn<br />
15/02 France BTF May 2010 EUR 3.5bn<br />
BTF Aug 2010<br />
EUR 2bn<br />
BTF Feb 2011<br />
EUR 2.5bn<br />
Germany Bubills Aug 2010 (new) EUR 5bn<br />
Neths DTC Apr 2010 EUR 1-2.5bn<br />
DTC May 2010<br />
EUR 0.5-1.5bn<br />
DTC May 2010<br />
EUR 0.5-1.5bn<br />
DTC Dec 2010<br />
EUR 1-2.5bn<br />
16/02 Japan T-Bills Feb 2011 JPY 2.5tn<br />
Spain Letras Feb 2011 15 Feb<br />
Letras Aug 2011<br />
15 Feb<br />
Belgium TC May 2010 12 Feb<br />
TC Feb 2011<br />
12 Feb<br />
US T-Bills May 2010 USD 25bn<br />
T-Bills Aug 2010 (new) USD 28bn<br />
FHLMC Bills 3-month & 6-month 12 Feb<br />
FHLB Discount Notes<br />
17/02 Japan T-Bills May 2010 JPY 5.7tn<br />
Sweden T-Bills May 2010 SEK 15bn<br />
Portugal BT Feb 2011 (new) EUR 1bn<br />
US T-Bills 4-week 16 Feb<br />
FNMA Bills 3-month & 6-month 12 Feb<br />
18/02 FHLB Discount Notes<br />
19/02 UK T-Bills 12 Feb<br />
Sources: Treasuries, <strong>BNP</strong> Paribas<br />
Comments and charts<br />
• EGB gross supply increases slightly to EUR 20bn in<br />
the week ahead from EUR 19bn in the past week. In 10y<br />
duration-adjusted terms, it falls to EUR 9.6bn from EUR<br />
16.8bn as the bulk of supply will take place in the 2y-5y<br />
sector.<br />
• Germany will launch a new Schatz Mar-12 for EUR<br />
7bn on Wednesday. On Tuesday, Ireland will re-open<br />
Gilts Jan-14 & Apr-20 for an expected size of EUR 1-<br />
1.5bn. Spain will tap the longer end of the curve with the<br />
re-opening of SPGB Jan-37 for an expected amount of<br />
around EUR 2bn on Thursday. On the same day,<br />
France will conduct its mid-month BTAN auctions and<br />
inflation-linked bonds auctions too. More details will be<br />
announced on Friday 12 February.<br />
• Outside the eurozone, Japan, Denmark, Canada<br />
and Sweden will also issue paper in the week ahead.<br />
Next week's Eurozone Redemptions<br />
Date Country Details Amount<br />
15/02 Italy BOT 12mth EUR 8.2bn<br />
15/02 Neths DTC EUR 5.8bn<br />
15/02 Ireland T-Bills EUR 1.8bn<br />
17/02 Germany Bubills EUR 7.0bn<br />
18/02 France BTF EUR 11.0bn<br />
18/02 Belgium TC EUR 5.2bn<br />
19/02 Spain Letras EUR 11.7bn<br />
Total Eurozone Short-term Redemption EUR 50.7bn<br />
20<br />
15<br />
10<br />
5<br />
0<br />
-5<br />
-10<br />
-15<br />
-20<br />
-25<br />
-30<br />
20<br />
18<br />
16<br />
14<br />
12<br />
10<br />
25<br />
8<br />
6<br />
4<br />
2<br />
0<br />
Chart 1: Investors’ Net Cash Flows<br />
(EUR bn, 10y equivalent)<br />
Net Investors' Cash Flows<br />
(EUR bn , 10y equivalent)<br />
Week of Feb 15th Week of Feb 22nd Week of Mar 1st Week of Mar 8th<br />
Chart 2: EGB Gross Supply Breakdown by<br />
Country (EUR bn, 10y equivalent)<br />
Germany Italy Portugal Belgium<br />
France Spain Netherlands Austria<br />
Finland Greece Ireland<br />
Week of Feb 15th Week of Feb 22nd Week of Mar 1st Week of Mar 8th<br />
Chart 3: EGB Gross Supply Breakdown by<br />
Maturity (EUR bn, 10y equivalent)<br />
EGBs Gross Supply (EUR bn, 10y equivalent)<br />
20<br />
2-3-YR 5-7-YR 10-YR >10-YR<br />
15<br />
10<br />
5<br />
0<br />
Week of Feb 15th Week of Feb 22nd Week of Mar 1st Week of Mar 8th<br />
All Charts Source: <strong>BNP</strong> Paribas<br />
Interest Rate Strategy 12 February 2010<br />
<strong>Market</strong> <strong>Mover</strong>, Non-Objective Research Section<br />
59<br />
www.Global<strong>Market</strong>s.bnpparibas.com
Central Bank Watch<br />
Interest Rate<br />
EUROZONE<br />
Current<br />
Rate<br />
Minimum Bid Rate 1.00<br />
US<br />
Fed Funds Rate 0 to 0.25<br />
Discount Rate 0.50<br />
JAPAN<br />
Call Rate 0.10<br />
Basic Loan Rate 0.30<br />
UK<br />
Bank Rate 0.5<br />
DENMARK<br />
Lending Rate 1.05<br />
SWEDEN<br />
Repo Rate 0.25<br />
NORWAY<br />
Sight Deposit Rate 1.75<br />
SWITZERLAND<br />
3 Mth LIBOR Target<br />
Range<br />
CANADA<br />
0.0-0.75<br />
Overnight Rate 0.25<br />
Bank Rate 0.50<br />
AUSTRALIA<br />
Cash Rate 3.75<br />
CHINA<br />
1Y Bank Lending<br />
Rate<br />
BRAZIL<br />
5.31%<br />
Selic Overnight Rate 8.75%<br />
Source: <strong>BNP</strong> Paribas<br />
Date of Last<br />
Change<br />
-25bp<br />
(7/5/09)<br />
-75bp<br />
(16/12/08)<br />
-75bp<br />
(16/12/08)<br />
-20bp<br />
(19/12/08)<br />
-20bp<br />
(19/12/08)<br />
-50bp<br />
(5/3/09)<br />
-10bp<br />
(14/1/10)<br />
-25bp<br />
(2/7/09)<br />
+25bp<br />
(16/12/09)<br />
-25bp<br />
(12/3/09)<br />
-25bp<br />
(21/4/09)<br />
-25bp<br />
(21/4/09)<br />
+25bp<br />
(1/12/09)<br />
-27bp<br />
(22/12/08)<br />
-50bp<br />
(22/7/09)<br />
Next Change in<br />
Coming 6 Months<br />
No Change<br />
No Change<br />
+25bp<br />
(Mar/May)<br />
No Change<br />
No Change<br />
No Change<br />
-5bp<br />
(Feb/Mar)<br />
+25bp<br />
(1/7/10)<br />
+25bp<br />
(24/3/10)<br />
No Change<br />
No Change<br />
No Change<br />
+25bp<br />
(6/4/10)<br />
+27bp<br />
(Q3)<br />
No Change<br />
Comments<br />
In early March, the ECB will announce the details of its exit<br />
strategy from unconventional measures for Q2. We do not expect<br />
any conventional tightening, i.e. rises in the refi rate, in 2010.<br />
The FOMC will end its purchases of mortgage-backed securities<br />
and agency debt by 31 March. It will maintain the funds rate at 0<br />
to 0.25% for an extended period while the ending of extreme<br />
liquidity initiatives in the next few weeks will foreshadow a<br />
probable rise in the discount rate.<br />
With the BoJ forecasting negative CPI inflation through H1 of FY<br />
2011, we expect its ultra-low interest rate policy to remain in<br />
place for some time.<br />
The latest Inflation Report highlighted that the first interest rate<br />
hike is a very long way off and there is a greater risk of more<br />
quantitative easing.<br />
We expect the lending rate to fall further. The timing will depend<br />
on foreign exchange reserve developments.<br />
Given a further improvement in the economy, the Riksbank now<br />
intends to deliver its first hike in the summer or early autumn.<br />
We expect it in July. However, if the stress in financial markets<br />
intensifies, the Riksbank is likely to wait until September.<br />
The Norges Bank is now more cautious and uncertain about<br />
external developments ahead. Economic conditions warrant<br />
further rate hikes, but an increase in March will be postponed if<br />
stress in financial markets intensifies and uncertainty increases.<br />
By relaxing its commitment to prevent currency appreciation the<br />
SNB is de facto tightening policy and has kept the ball rolling<br />
towards an eventual increase in rates. The strong franc remains<br />
the biggest hurdle to the first hike.<br />
The BoC committed to keep rates unchanged until mid-2010,<br />
conditional on the outlook for inflation. While domestic conditions<br />
are stronger than in the US, the BoC is unlikely to begin raising<br />
interest rates well ahead of the Fed.<br />
The RBA surprised by leaving rates unchanged in February and<br />
signalled that it wants to assess the impact of previous<br />
tightening. This favours waiting until April before hiking again.<br />
The latest 50bp RRR hike is likely to mark the beginning of a<br />
series of measures to tighten policy. The first hike in key policy<br />
rates is expected in Q3 when the CPI rate is forecast to exceed<br />
3%. However, given the authorities' rising caution about excess<br />
credit, an earlier move cannot be ruled out.<br />
The BCB frontloaded monetary easing by cutting rates by<br />
500bp. Given signs of a stabilisation of the Brazilian economy<br />
and an improvement in global conditions, we expect the BCB to<br />
remain on hold for a long period.<br />
Change since our last weekly in bold and italics<br />
For the full EMK Central Bank Watch please see our Local <strong>Market</strong>s <strong>Mover</strong><br />
<strong>Market</strong> Economics 12 February 2010<br />
<strong>Market</strong> <strong>Mover</strong><br />
60<br />
www.Global<strong>Market</strong>s.bnpparibas.com
Economic Forecasts<br />
GDP<br />
Year 2009<br />
2010<br />
(% y/y) ’08 ’09 (1) ’10 (1) Q1 Q2 Q3 Q4 (1) Q1 (1) Q2 (1) Q3 (1) Q4 (1)<br />
US 0.4 -2.4 2.8 -3.3 -3.8 -2.6 0.1 2.4 3.1 3.1 2.4<br />
Eurozone 0.5 -3.9 1.3 -5.0 -4.8 -4.0 -1.6 1.2 1.6 1.3 0.9<br />
Japan -1.2 -5.3 1.2 -8.9 -5.8 -5.1 -1.7 1.7 1.2 0.9 0.8<br />
World (2) 3.2 -0.8 3.9 -2.2 -1.9 -0.8 1.5 4.0 4.2 3.8 3.7<br />
Industrial Production<br />
Year<br />
2009<br />
2010<br />
(% y/y) ’08 ’09 (1) ’10 (1) Q1 Q2 Q3 Q4 (1) Q1 (1) Q2 (1) Q3 (1) Q4 (1)<br />
US -2.2 -9.7 4.1 2.0 5.6 4.6 4.2 4.1 4.4 4.6 4.4<br />
Eurozone -1.7 -14.4 3.3 -17.7 -18.2 -15.0 -6.2 4.2 5.5 2.5 1.0<br />
Japan -3.4 -22.3 15.6 -34.6 -27.8 -20.1 -4.7 28.1 19.2 11.5 6.9<br />
Unemployment Rate<br />
Year<br />
2009 2010<br />
(%) ’08 ’09 (1) ’10 (1) Q1 Q2 Q3 Q4 (1) Q1 (1) Q2 (1) Q3 (1) Q4 (1)<br />
US 5.8 9.3 10.1 7.0 8.2 9.3 10.0 10.2 10.1 10.2 10.0<br />
Eurozone 7.6 9.4 10.4 8.8 9.3 9.6 9.9 10.2 10.4 10.6 10.6<br />
Japan 4.0 5.1 5.3 4.4 5.2 5.5 5.3 5.3 5.3 5.3 5.2<br />
CPI<br />
Year<br />
2009<br />
2010<br />
(% y/y) ’08 ’09 ’10 (1) Q1 Q2 Q3 Q4 Q1 (1) Q2 (1) Q3 (1) Q4 (1)<br />
US 3.8 -0.4 2.5 0.0 -1.2 -1.6 1.4 2.8 2.9 2.4 2.0<br />
Eurozone 3.3 0.3 1.3 1.0 0.2 -0.4 0.4 1.1 1.1 1.3 1.6<br />
Japan 1.4 -1.4 -1.4 -0.1 -1.0 -2.2 -2.1 -1.4 -1.8 -1.7 -0.6<br />
Current Account<br />
(% GDP) ’08<br />
Year<br />
’09 (1) ’10 (1) General Government<br />
(% GDP)<br />
’08<br />
Year<br />
’09 (1) ’10 (1)<br />
US -4.9 -3.5 -4.4 US (4) -3.1 -11.0 -10.2<br />
Eurozone -1.6 -0.8 -0.8 Eurozone -1.9 -6.5 -6.9<br />
Japan 3.2 2.7 3.0 Japan -6.7 -11.3 -9.5<br />
Interest Rate Forecasts<br />
Interest Rate (3)<br />
Year<br />
2009<br />
2010<br />
(%) ’08 ’09 ’10 (1) Q1 Q2 Q3 Q4 Q1 (1) Q2 (1) Q3 (1) Q4 (1)<br />
US<br />
Fed Funds Rate 0.25 0.25 0.25 0.25 0.25 0.25 0.25 0.25 0.25 0.25 0.25<br />
3-month Rate 1.43 0.25 0.45 1.19 0.60 0.29 0.25 0.30 0.30 0.40 0.45<br />
2-year yield 0.77 1.14 1.30 0.80 1.12 0.95 1.14 1.00 0.90 1.15 1.30<br />
10-year yield 2.22 3.84 3.75 1.67 2.56 2.31 2.68 3.25 3.00 3.30 3.75<br />
2y/10y Spread (bp) 145 270 245 87 144 136 154 225 210 215 245<br />
Eurozone<br />
Refinancing Rate 0.00 0.00 1.00 0.00 0.00 0.00 0.00 1.00 1.00 1.00 1.00<br />
3-month Rate 2.50 1.00 1.10 1.50 1.00 1.00 1.00 0.60 0.60 0.65 1.10<br />
2-year yield 1.74 1.37 1.50 1.23 1.38 1.28 1.37 1.25 1.25 1.50 1.50<br />
10-year yield 2.35 2.45 3.50 2.24 2.51 2.42 2.45 3.10 2.90 3.20 3.50<br />
2y/10y Spread (bp) 61 108 200 101 113 114 108 185 165 170 200<br />
Japan<br />
O/N Call Rate 0.00 0.00 0.10 0.00 0.00 0.00 0.00 0.10 0.10 0.10 0.10<br />
3-month Rate 0.10 0.10 0.35 0.10 0.10 0.10 0.10 0.45 0.45 0.40 0.35<br />
2-year yield 0.40 0.15 0.45 0.41 0.32 0.25 0.15 0.20 0.25 0.35 0.45<br />
10-year yield 0.71 0.47 1.70 0.78 0.71 0.60 0.47 1.40 1.50 1.60 1.70<br />
2y/10y Spread (bp) 31 32 125 37 39 35 32 120 125 125 125<br />
Footnotes: (1) Forecast (2) Country weights used to construct world growth are those in the IMF World Economic Outlook Update<br />
October 2009 (3) End Period (4) Fiscal year Figures are y/y percentage change unless otherwise indicated<br />
Source: <strong>BNP</strong> Paribas<br />
<strong>Market</strong> Economics / Interest Rate Strategy 12 February 2010<br />
<strong>Market</strong> <strong>Mover</strong><br />
61<br />
www.Global<strong>Market</strong>s.bnpparibas.com
FX Forecasts*<br />
USD Bloc Q1 '10 Q2 '10 Q3 '10 Q4 '10 Q1 '11 Q2 '11 Q3 '11 Q4 '11 Q1 '12 Q2 '12 Q3 '12<br />
EUR/USD 1.40 1.36 1.32 1.27 1.30 1.32 1.34 1.36 1.36 1.36 1.36<br />
USD/JPY 93 97 100 108 110 115 120 118 116 114 112<br />
USD/CHF 1.04 1.05 1.10 1.16 1.15 1.15 1.16 1.15 1.18 1.18 1.19<br />
GBP/USD 1.59 1.49 1.39 1.31 1.38 1.42 1.46 1.49 1.49 1.51 1.53<br />
USD/CAD 1.07 1.09 1.13 1.15 1.11 1.09 1.06 1.04 1.02 1.05 1.08<br />
AUD/USD 0.86 0.85 0.84 0.84 0.87 0.90 0.92 0.92 0.92 0.93 0.92<br />
NZD/USD 0.72 0.70 0.68 0.67 0.66 0.66 0.68 0.69 0.72 0.69 0.67<br />
USD/SEK 7.07 7.35 7.42 7.64 7.38 7.27 7.16 6.84 6.76 6.91 7.06<br />
USD/NOK 5.79 6.10 6.14 6.30 6.15 5.91 5.67 5.51 5.44 5.51 5.59<br />
EUR Bloc Q1 '10 Q2 '10 Q3 '10 Q4 '10 Q1 '11 Q2 '11 Q3 '11 Q4 '11 Q1 '12 Q2 '12 Q3 '12<br />
EUR/JPY 130 132 132 137 143 152 161 160 158 155 152<br />
EUR/GBP 0.88 0.91 0.95 0.97 0.94 0.93 0.92 0.91 0.91 0.90 0.89<br />
EUR/CHF 1.45 1.43 1.45 1.47 1.49 1.52 1.55 1.57 1.60 1.61 1.62<br />
EUR/SEK 9.90 10.00 9.80 9.70 9.60 9.60 9.60 9.30 9.20 9.40 9.60<br />
EUR/NOK 8.10 8.30 8.10 8.00 8.00 7.80 7.60 7.50 7.40 7.50 7.60<br />
EUR/DKK 7.46 7.46 7.46 7.46 7.46 7.46 7.46 7.46 7.46 7.46 7.46<br />
Central Europe Q1 '10 Q2 '10 Q3 '10 Q4 '10 Q1 '11 Q2 '11 Q3 '11 Q4 '11 Q1 '12 Q2 '12 Q3 '12<br />
USD/PLN 2.80 3.09 3.30 3.19 3.15 3.03 2.84 2.94 2.79 2.72 2.65<br />
EUR/CZK 26.0 26.2 26.2 25.8 25.2 25.5 25.0 24.7 24.3 24.0 23.9<br />
EUR/HUF 255 280 278 265 260 255 250 260 255 255 255<br />
USD/ZAR 8.00 8.20 8.30 8.50 8.40 8.50 8.40 8.20 7.80 7.80 7.50<br />
USD/TRY 1.48 1.53 1.58 1.55 1.60 1.58 1.55 1.50 1.43 1.45 1.45<br />
EUR/RON 4.30 4.30 4.40 4.35 4.40 4.30 4.20 4.00 3.90 3.80 3.75<br />
USD/RUB 30.51 31.84 30.59 29.42 28.19 27.10 26.02 25.82 25.29 25.88 26.84<br />
EUR/PLN 3.92 4.20 4.35 4.05 4.10 4.00 3.80 4.00 3.80 3.70 3.60<br />
USD/UAH 8.9 8.4 8.6 8.7 8.5 8.3 7.9 7.5 5.5 5.3 5.4<br />
EUR/RSD 92 105 95 93 90 87 85 87 90 86 87<br />
Asia Bloc Q1 '10 Q2 '10 Q3 '10 Q4 '10 Q1 '11 Q2 '11 Q3 '11 Q4 '11 Q1 '12 Q2 '12 Q3 '12<br />
USD/SGD 1.37 1.36 1.36 1.34 1.33 1.32 1.31 1.30 1.30 1.30 1.30<br />
USD/MYR 3.31 3.28 3.26 3.20 3.18 3.15 3.13 3.10 3.10 3.10 3.10<br />
USD/IDR 9000 8800 8700 8600 8500 8400 8300 8200 8100 8000 8000<br />
USD/THB 32.70 32.50 32.30 32.00 31.70 31.50 31.30 31.00 31.00 31.00 31.00<br />
USD/PHP 45.50 45.00 44.50 44.00 43.50 43.00 42.70 42.50 42.00 42.00 42.00<br />
USD/HKD 7.80 7.80 7.80 7.80 7.80 7.80 7.80 7.80 7.80 7.80 7.80<br />
USD/RMB 6.83 6.83 6.72 6.62 6.57 6.52 6.47 6.42 6.37 6.32 6.27<br />
USD/TWD 30.70 30.50 30.30 30.00 29.70 29.50 29.30 29.00 29.00 29.00 29.00<br />
USD/KRW 1120 1090 1070 1050 1030 1020 1010 1000 1000 1000 1000<br />
USD/INR 45.00 44.00 43.00 42.00 41.00 40.00 39.00 38.00 38.00 38.00 38.00<br />
USD/VND 17300 17000 16700 16500 16400 16300 16200 16000 16000 16000 16000<br />
LATAM Bloc Q1 '10 Q2 '10 Q3 '10 Q4 '10 Q1 '11 Q2 '11 Q3 '11 Q4 '11 Q1 '12 Q2 '12 Q3 '12<br />
USD/ARS 3.89 4.20 4.10 4.20 4.25 4.35 4.45 4.50 4.60 4.70 4.80<br />
USD/BRL 1.75 1.90 1.80 1.75 1.75 1.80 1.80 1.85 1.85 1.85 1.85<br />
USD/CHL 505 530 525 530 530 535 535 535 540 540 540<br />
USD/MXN 13.00 13.75 13.10 12.50 12.50 12.50 12.50 12.50 12.25 12.25 12.00<br />
USD/COP 1900 2100 2050 2000 2000 2050 2100 2100 2150 2150 2200<br />
USD/VEF priority (1) 2.59 2.59 2.59 2.59 2.59 2.59 2.59 2.59 5.30 5.30 5.30<br />
USD/VEF oil (1) 4.60 4.60 4.60 4.60 4.60 4.60 4.60 4.60 8.80 8.80 8.80<br />
Others Q1 '10 Q2 '10 Q3 '10 Q4 '10 Q1 '11 Q2 '11 Q3 '11 Q4 '11 Q1 '12 Q2 '12 Q3 '12<br />
USD Index 79.19 81.91 84.85 88.70 86.73 86.04 85.28 83.79 83.46 83.47 83.46<br />
*End Quarter<br />
(1) Following the devaluation of the VEF, there is now an official ‘priority’ exchange rate and a so-called ‘oil’ exchange rate used for certain transactions<br />
Source: <strong>BNP</strong> Paribas<br />
Foreign Exchange Strategy 12 February 2010<br />
<strong>Market</strong> <strong>Mover</strong><br />
www.Global<strong>Market</strong>s.bnpparibas.com<br />
62
<strong>Market</strong> Coverage<br />
<strong>Market</strong> Economics<br />
Paul Mortimer-Lee Global Head of <strong>Market</strong> Economics London 44 20 7595 8551 paul.mortimer-lee@uk.bnpparibas.com<br />
Ken Wattret Chief Eurozone <strong>Market</strong> Economist London 44 20 7595 8657 kenneth.wattret@uk.bnpparibas.com<br />
Luigi Speranza Head of Inflation Economics, Eurozone, Italy London 44 20 7595 8322 luigi.speranza@uk.bnpparibas.com<br />
Alan Clarke UK London 44 20 7595 8476 alan.clarke@uk.bnpparibas.com<br />
Eoin O’Callaghan Inflation, Eurozone, Switzerland, Ireland London 44 20 7595 8226 eoin.ocallaghan@uk.bnpparibas.com<br />
Gizem Kara Scandinavia London 44 20 7595 8783 gizem.kara@uk.bnpparibas.com<br />
Dominique Barbet Eurozone, France Paris 33 1 4298 1567 dominique.barbet@bnpparibas.com<br />
Brian Fabbri Chief Economist North America New York 1 212 841 3633 brian.fabbri@americas.bnpparibas.com<br />
Julia Coronado Senior US Economist New York 1 212 841 2281 julia.l.coronado@americas.bnpparibas.com<br />
Anna Piretti US, Canada New York 1 212 841 3663 anna.piretti@americas.bnpparibas.com<br />
Ryutaro Kono Chief Economist Japan Tokyo 81 3 6377 1601 ryutaro.kono@japan.bnpparibas.com<br />
Hiroshi Shiraishi Japan Tokyo 81 3 6377 1602 hiroshi.shiraishi@japan.bnpparibas.com<br />
Azusa Kato Japan Tokyo 81 3 6377 1603 azusa.kato@japan.bnpparibas.com<br />
Richard Iley Head of Asia Economics Hong Kong 852 2108 5104 richard.iley@asia.bnpparibas.com<br />
Dominic Bryant Asia, Australia Hong Kong 852 2108 5105 dominic.bryant@asia.bnpparibas.com<br />
Chan Kok Peng Chief Economist Singapore 65 6210 1946 kokpeng.chan@asia.bnpparibas.com<br />
Michal Dybula Central & Eastern Europe Warsaw 48 22 697 2354 michal.dybula@pl.bnpparibas.com<br />
Rafael de la Fuente Chief Economist Latin America ex Brazil New York 1 212 841 3637 rafael.delafuente@americas.bnpparibas.com<br />
Italo Lombardi Latin America New York 1 212 841 6599 italo.lombari@americas.bnpparibas.com<br />
Alexandre Lintz Latin America São Paulo 55 11 3841 3418 alexandre.lintz@br.bnpparibas.com<br />
Diego Donadio Latin America São Paulo 55 11 3841 3421 diego.donadio@@br.bnpparibas.com<br />
Interest Rate Strategy<br />
Cyril Beuzit Global Head of Interest Rate Strategy London 44 20 7595 8639 cyril.beuzit@uk.bnpparibas.com<br />
Patrick Jacq Europe Strategist Paris 33 1 4316 9718 patrick.jacq@bnpparibas.com<br />
Hervé Cros Chief Inflation Strategist London 44 20 7595 8419 herve.cros@uk.bnpparibas.com<br />
Shahid Ladha Inflation Strategist London 44 20 7 595 8573 shahid.ladha@uk.bnpparibas.com<br />
Alessandro Tentori Chief Alpha Strategy Europe London 44 20 7595 8238 alessandro.tentori@uk.bnpparibas.com<br />
Matteo Regesta Europe Alpha Strategist London 44 20 7595 8607 matteo.regesta@uk.bnpparibas.com<br />
Ioannis Sokos Europe Alpha Strategist London 44 20 7595 8671 ioannis.sokos@uk.bnpparibas.com<br />
Bülent Baygün Head of Interest Rate Strategy US New York 1 212 471 8043 bulent.baygun@americas.bnpparibas.com<br />
Sergey Bondarchuk US Strategist New York 1 212 841 2026 sergey.bondarchuk@americas.bnpparibas.com<br />
Suvrat Prakash US Strategist New York 1 917 472 4374 suvrat.prakash@americas.bnpparibas.com<br />
Anish Lohokare MBS Strategist New York 1 212 841 2867 anish.lohokare@americas.bnpparibas.com<br />
Koji Shimamoto Head of Interest Rate Strategy Japan Tokyo 81 3 6377 1700 koji.shimamoto@japan.bnpparibas.com<br />
Takafumi Yamawaki Japan Strategist Tokyo 81 3 6377 1705 takafumi.yamawak@bnpparibas.com<br />
Tomohisa Fujiki Japan Strategist Tokyo 81 3 6377 1702 Tomohisa.fujiki@japan.bnpparibas.com<br />
Christian Séné Technical Analyst Paris 33 1 4316 9717 christian.séné@bnpparibas.com<br />
FX Strategy<br />
Hans Redeker Global Head of FX Strategy London 44 20 7595 8086 hans-guenter.redeker@uk.bnpparibas.com<br />
Ian Stannard FX Strategist London 44 20 7595 8086 ian.stannard@uk.bnpparibas.com<br />
James Hellawell Quantitative Strategist London 44 20 7595 8485 james.hellawell@uk.bnpparibas.com<br />
Sebastien Galy FX Strategist New York 1 212 841 2492 sebastien.galy@bnpparibas.com<br />
Andy Chaveriat Technical Analyst New York 1 212 841 2408 andrew.chaveriat@americas.bnpparibas.com<br />
FX & Interest Rate Strategy<br />
Drew Brick Head of FX & IR Strategy Asia Singapore 65 6210 3262 Drew.brick@asia.bnpparibas.com<br />
Chin Loo Thio FX & IR Asia Strategist Singapore 65 6210 3263 chin.thio@asia.bnpparibas.com<br />
Robert Ryan FX & IR Asia Strategist Singapore 65 6210 3314 robert.ryan@asia.bnpparibas.com<br />
Gao Qi FX & IR Asia Strategist Singapore 65 6210 3264 gao.qi@asia.bnpparibas.com<br />
Shahin Vallée Head of FX & IR Strategy CEEMEA London 44 20 7595 8306 shahin.vallee@uk.bnpparibas.com<br />
Elisabeth Gruié FX & IR CEEMEA Strategist London 44 20 7595 8492 elisabeth.gruie@uk.bnpparibas.com<br />
Bartosz Pawlowski FX & IR CEEMEA Strategist London 44 20 7595 8195 Bartosz.pawlowski@uk.bnpparibas.com<br />
For Production and Distribution, please contact:<br />
Ann Aston, <strong>Market</strong> Economics, London. Tel: 44 20 7595 8503 Email: ann.aston@uk.bnpparibas.com<br />
Danielle Catananzi, Interest Rate Strategy, London. Tel: 44 20 7595 4418 Email: danielle.catananzi@uk.bnpparibas.com<br />
Derek Allassani, FX Strategy, London. Tel: 44 20 7595 8486 Email: derek.allassani@uk.bnpparibas.com<br />
Martine Borde, <strong>Market</strong> Economics/Interest Rate Strategy, Paris. Tel: 33 1 4298 4144 Email martine.borde@bnpparibas.com<br />
Editors<br />
Amanda Grantham-Hill, Interest Rate Strategy/<strong>Market</strong> Economics, London. Tel: 44 20 7595 4107 Email: amanda.grantham-hill@bnpparibas.com<br />
Nick Ashwell, FX/<strong>Market</strong> Economics, London. Tel: 44 20 7595 4120 Email: nick.ashwell@uk.bnpparibas.com<br />
<strong>BNP</strong> Paribas Global Fixed Income Website<br />
www.globalmarkets.bnpparibas.com<br />
Bloomberg<br />
Fixed Income Research BPCM <strong>Market</strong> Economics BPEC<br />
Interest Rate Strategy BPBS Forex Strategy BPFR<br />
63
RESEARCH DISCLAIMERS:<br />
IMPORTANT DISCLOSURES: Please see important disclosures in the text of this report.<br />
Some sections of this report have been written by our strategy teams. These sections are clearly labelled and do not purport to be an exhaustive<br />
analysis, and may be subject to conflicts of interest resulting from their interaction with sales and trading which could affect the objectivity of this<br />
report. (Please see further important disclosures in the text of this report). These sections are a marketing communication. They are not<br />
independent investment research. They have not been prepared in accordance with legal requirements designed to provide the independence<br />
of investment research, and are not subject to any prohibition on dealing ahead of the dissemination of investment research.<br />
The information and opinions contained in this report have been obtained from, or are based on, public sources believed to be reliable, but no<br />
representation or warranty, express or implied, is made that such information is accurate, complete or up to date and it should not be relied<br />
upon as such. This report does not constitute an offer or solicitation to buy or sell any securities or other investment. Information and opinions<br />
contained in the report are published for the assistance of recipients, but are not to be relied upon as authoritative or taken in substitution for the<br />
exercise of judgement by any recipient, are subject to change without notice and not intended to provide the sole basis of any evaluation of the<br />
instruments discussed herein. Any reference to past performance should not be taken as an indication of future performance. To the fullest<br />
extent permitted by law, no <strong>BNP</strong> Paribas group company accepts any liability whatsoever (including in negligence) for any direct or<br />
consequential loss arising from any use of or reliance on material contained in this report. All estimates and opinions included in this report are<br />
made as of the date of this report. Unless otherwise indicated in this report there is no intention to update this report. <strong>BNP</strong> Paribas SA and its<br />
affiliates (collectively “<strong>BNP</strong> Paribas”) may make a market in, or may, as principal or agent, buy or sell securities of any issuer or person<br />
mentioned in this report or derivatives thereon. <strong>BNP</strong> Paribas may have a financial interest in any issuer or person mentioned in this report,<br />
including a long or short position in their securities and/or options, futures or other derivative instruments based thereon, or vice versa. <strong>BNP</strong><br />
Paribas, including its officers and employees may serve or have served as an officer, director or in an advisory capacity for any person<br />
mentioned in this report. <strong>BNP</strong> Paribas may, from time to time, solicit, perform or have performed investment banking, underwriting or other<br />
services (including acting as adviser, manager, underwriter or lender) within the last 12 months for any person referred to in this report. <strong>BNP</strong><br />
Paribas may be a party to an agreement with any person relating to the production of this report. <strong>BNP</strong> Paribas, may to the extent permitted by<br />
law, have acted upon or used the information contained herein, or the research or analysis on which it was based, before its publication. <strong>BNP</strong><br />
Paribas may receive or intend to seek compensation for investment banking services in the next three months from or in relation to any person<br />
mentioned in this report. Any person mentioned in this report may have been provided with sections of this report prior to its publication in order<br />
to verify its factual accuracy.<br />
<strong>BNP</strong> Paribas is incorporated in France with limited liability. Registered Office 16 Boulevard des Italiens, 75009 Paris. This report was produced<br />
by a <strong>BNP</strong> Paribas group company. This report is for the use of intended recipients and may not be reproduced (in whole or in part) or delivered<br />
or transmitted to any other person without the prior written consent of <strong>BNP</strong> Paribas. By accepting this document you agree to be bound by the<br />
foregoing limitations.<br />
Certain countries within the European Economic Area:<br />
This report is solely prepared for professional clients. It is not intended for retail clients and should not be passed on to any such persons.<br />
This report has been approved for publication in the United Kingdom by <strong>BNP</strong> Paribas London Branch. <strong>BNP</strong> Paribas London Branch is<br />
authorised by CECEI and AMF and authorised and subject to limited regulation by the Financial <strong>Services</strong> Authority. Details of the extent of our<br />
authorisation and regulation by the Financial <strong>Services</strong> Authority are available from us on request.<br />
This report has been approved for publication in France by <strong>BNP</strong> Paribas, a credit institution licensed as an investment services provider by the<br />
CECEI and the AMF, whose head office is 16, Boulevard des Italiens 75009 Paris, France.<br />
This report is being distributed in Germany either by <strong>BNP</strong> Paribas London Branch or by <strong>BNP</strong> Paribas Niederlassung Frankfurt am Main,<br />
regulated by the Bundesanstalt für Finanzdienstleistungsaufsicht (BaFin).<br />
United States: This report is being distributed to US persons by <strong>BNP</strong> Paribas Securities Corp., or by a subsidiary or affiliate of <strong>BNP</strong> Paribas<br />
that is not registered as a US broker-dealer to US major institutional investors only. <strong>BNP</strong> Paribas Securities Corp., a subsidiary of <strong>BNP</strong> Paribas,<br />
is a broker-dealer registered with the Securities and Exchange Commission and a member of the National Association of Securities Dealers, the<br />
New York Stock Exchange and other principal exchanges. <strong>BNP</strong> Paribas Securities Corp. accepts responsibility for the content of a report<br />
prepared by another non-US affiliate only when distributed to US persons by <strong>BNP</strong> Paribas Securities Corp.<br />
Japan: This report is being distributed to Japanese based firms by <strong>BNP</strong> Paribas Securities (Japan) Limited, Tokyo Branch, or by a subsidiary or<br />
affiliate of <strong>BNP</strong> Paribas not registered as a financial instruments firm in Japan, to certain financial institutions defined by article 17-3, item 1 of<br />
the Financial Instruments and Exchange Law Enforcement Order. <strong>BNP</strong> Paribas Securities (Japan) Limited, Tokyo Branch, a subsidiary of <strong>BNP</strong><br />
Paribas, is a financial instruments firm registered according to the Financial Instruments and Exchange Law of Japan and a member of the<br />
Japan Securities Dealers Association. <strong>BNP</strong> Paribas Securities (Japan) Limited, Tokyo Branch accepts responsibility for the content of a report<br />
prepared by another non-Japan affiliate only when distributed to Japanese based firms by <strong>BNP</strong> Paribas Securities (Japan) Limited, Tokyo<br />
Branch. Some of the foreign securities stated on this report are not disclosed according to the Financial Instruments and Exchange Law of<br />
Japan.<br />
Hong Kong: This report is being distributed in Hong Kong by <strong>BNP</strong> Paribas Hong Kong Branch, a branch of <strong>BNP</strong> Paribas whose head office is in<br />
Paris, France. <strong>BNP</strong> Paribas Hong Kong Branch is regulated as a Registered Institution by Hong Kong Monetary Authority for the conduct of<br />
Advising on Securities [Regulated Activity Type 4] under the Securities and Futures Ordinance.<br />
© <strong>BNP</strong> Paribas (2010). All rights reserved.


