

Market Economics | Interest Rate Strategy - BNP PARIBAS ...
Market Economics | Interest Rate Strategy - BNP PARIBAS ...
Market Economics | Interest Rate Strategy - BNP PARIBAS ...

You also want an ePaper? Increase the reach of your titles
YUMPU automatically turns print PDFs into web optimized ePapers that Google loves.
<strong>Market</strong> <strong>Economics</strong> | <strong>Interest</strong> <strong>Rate</strong> <strong>Strategy</strong> | Forex <strong>Strategy</strong> 16 July 2010<br />
<strong>Market</strong> Mover<br />
<strong>Market</strong> Outlook 2-3<br />
Fundamentals 4-20<br />
• Where Have You Gone, Joe<br />
4-6<br />
DiMaggio?<br />
• US Housing: A Cold Summer 7-9<br />
• UK: Mind the Gap 10-11<br />
• Denmark: The Tide is Turning 12-13<br />
• China: House Price Controls to 14-15<br />
Continue<br />
• Japan: Post-Election Outlook for Tax 16-17<br />
Reform<br />
• Japan: PM Kan’s Dubious <strong>Economics</strong> 18-20<br />
<strong>Interest</strong> <strong>Rate</strong> <strong>Strategy</strong> 21-50<br />
• US: 10y Range Trade with a Receiver 21<br />
Fly<br />
• US: TSY Switches for Yield/Duration 22-23<br />
Pickup<br />
• US: Corporate Issuance and Swap 24-25<br />
Spreads<br />
• MBS: Higher Coupons Could Speed 26-27<br />
Up Later<br />
• EUR: Eonias to Push Up Further 28<br />
• EUR: Deflation Macro Hedge Via 29<br />
Options<br />
• EUR: Yet Another Volatility Deflation 30<br />
Trade<br />
• EUR: SAS Diversification to Enhance 31<br />
Yields<br />
• JGBs: Fiscal Austerity – Not an Easy 32<br />
Task<br />
• Global Inflation Watch 33-36<br />
• Inflation: Sell 30y in the UK & US 37-38<br />
• GBP: Evolving LDI Demand with Shift 39-42<br />
to CPI?<br />
• Europe iTraxx Credit Indices 43-46<br />
• Technical Analysis 47-48<br />
• Trade Reviews 49<br />
FX <strong>Strategy</strong> 50-55<br />
• <strong>Strategy</strong>: Returning to EURAUD 50-52<br />
Bearish Strategies<br />
• Technical <strong>Strategy</strong>: 53-54<br />
• Trading Positions 55<br />
Forecasts & Calendars 56-70<br />
• 1 Week Economic Calendar 56-57<br />
• Key Data Preview 58-63<br />
• 4 Week Calendar 64<br />
• Treasury & SAS Issuance 65-66<br />
• Central Bank Watch 67<br />
• Economic & <strong>Interest</strong> <strong>Rate</strong> Forecasts 68<br />
• FX Forecasts 69<br />
Contacts 70<br />
www.Global<strong>Market</strong>s.bnpparibas.com<br />
• A strong start to the corporate earnings season has<br />
brought support to risk appetite.<br />
• However, the setback in safe-haven flows has remained<br />
limited, with ongoing concerns about sovereign debt and<br />
the recent softening of economic data supporting govvies.<br />
• We remain constructive on the main government bond<br />
markets over the coming weeks, expecting flatter curves.<br />
• The minutes of June's FOMC meeting suggest that the<br />
door to a further round of unconventional stimulus has<br />
opened further.<br />
• The results of the EU-wide stress tests will be<br />
announced on 23 July. The CEBS statement last week<br />
failed to clarify a number of issues, including in particular<br />
the assumptions on sovereign debt developments.<br />
• The lack of concrete information available at this stage,<br />
on a number of fronts, suggests that national governments<br />
have struggled to reach agreement over the specific<br />
details. This is not a good sign.<br />
• Supply/demand conditions remain favourable for the<br />
JGB market.<br />
• We expect the pro-cyclical and commodity currencies<br />
to remain supported in the medium term.<br />
• Some further near-term gains are expected for the EUR<br />
and GBP in the current environment as position unwinding<br />
persists.<br />
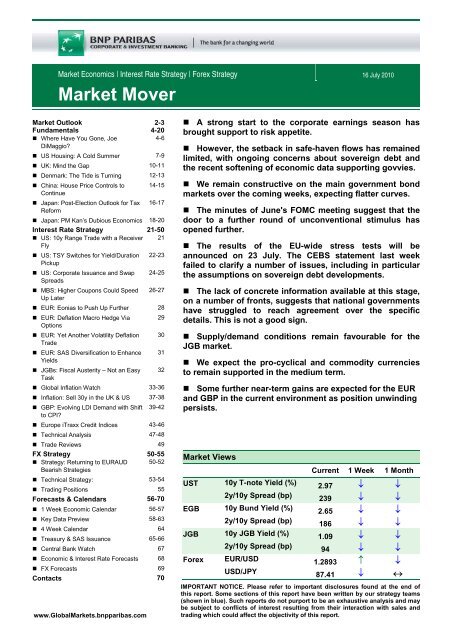
<strong>Market</strong> Views<br />
UST 10y T-note Yield (%)<br />
2y/10y Spread (bp)<br />
EGB 10y Bund Yield (%)<br />
2y/10y Spread (bp)<br />
JGB 10y JGB Yield (%)<br />
2y/10y Spread (bp)<br />
Forex<br />
EUR/USD<br />
USD/JPY<br />
Current 1 Week 1 Month<br />
2.97 ↓ ↓<br />
239 ↓ ↓<br />
2.65 ↓ ↓<br />
186 ↓ ↓<br />
1.09 ↓ ↓<br />
94 ↓ ↓<br />
1.2893 ↑ ↓<br />
87.41 ↓ ↔<br />
IMPORTANT NOTICE. Please refer to important disclosures found at the end of<br />
this report. Some sections of this report have been written by our strategy teams<br />
(shown in blue). Such reports do not purport to be an exhaustive analysis and may<br />
be subject to conflicts of interest resulting from their interaction with sales and<br />
trading which could affect the objectivity of this report.
<strong>Market</strong> Outlook<br />
Fragile rebound in risk<br />
appetite after a positive<br />
start to the earnings<br />
season<br />
Government bond markets gave up some of their recent gains over the past<br />
week following a positive start to the earnings season. In Europe, the<br />
assumptions behind the stress test appear increasingly credible and the<br />
remaining question concerns the recapitalisation funds that may need to be<br />
made available. In addition, the European Financial Stability Facility should<br />
be operational by the end of August, according to the CEO of the SPV.<br />
Finally, Greece passed the test of the primary market with relative ease: the<br />
auction of 26-week bills was well received.<br />
However, the recent setback in safety trades has remained limited, notably<br />
as the fundamental context remains bond-supportive. Most of the recent<br />
economic data have indeed continued to paint a picture of a recovery that is<br />
losing momentum. The latest FOMC minutes indicate an adjustment to lower<br />
long-term forecasts for growth and core inflation, and higher for<br />
unemployment. These concerns about the growth outlook are generating an<br />
immediate policy response. The Fed is suggesting that excess liquidity will<br />
remain in place for longer than the market had been expecting while several<br />
FOMC members are putting forward the view that additional measures<br />
should be considered if the outlook deteriorates further. This has led to the<br />
market pushing its rate hike expectations out further along the curve, also<br />
providing support for the Treasury market.<br />
The strong start to the earnings season supports risk appetite but<br />
govvies remain resilient<br />
4.0<br />
10 yr N ote Y ield<br />
3.9<br />
3.8<br />
3.7<br />
3.6<br />
3.5<br />
3.4<br />
3.3<br />
3.2<br />
S&P (RHS)<br />
3.1<br />
3.0<br />
2.9<br />
Jan Feb Mar Apr May Jun Jul<br />
10<br />
Source: Reuters EcoWin Pro<br />
1225<br />
1200<br />
1175<br />
1150<br />
1125<br />
1100<br />
1075<br />
1050<br />
1025<br />
1000<br />
Supportive environment<br />
for Tsy though the upside<br />
potential looks limited on<br />
short-dated maturities<br />
We remain constructive on Treasuries over the coming weeks, with the<br />
prospect of another downward surprise to core CPI looming. The FOMC<br />
minutes should now set the stage for a dovish monetary policy report from<br />
Bernanke to Congress next week. With long-term forecasts being revised to<br />
show a bleaker picture than forecast a few months ago, the talk has shifted<br />
away from when the Fed could tighten. Instead, Fed speakers are now<br />
discussing the implications of disinflation, and possible further asset<br />
purchases or other forms of stimulus.<br />
One risk to our positive call on Treasuries is that the stock market continues<br />
its recovery as expectations for corporate earnings are generally upbeat. We<br />
are certainly wary of this and favour having short exposure in the front end<br />
as cheap protection against our main view. At 0.60%, the 2y note is again at<br />
the low end of its yield range so risk/reward favours a short, although with<br />
the cost of negative carry.<br />
Cyril Beuzit 16 July 2010<br />
<strong>Market</strong> Mover<br />
2<br />
www.Global<strong>Market</strong>s.bnpparibas.com
2-10s receivers attractive<br />
in the 150bp area<br />
JGBs remain solid<br />
In Europe, we also remain more comfortable in the short run being<br />
positioned for a flatter curve – rather than going for outright longs on longdated<br />
maturities. The front end of the curve still looks at risk, with further<br />
unwinding of carry trades ahead. Remaining uncertainties about the stress<br />
test should continue to support EGBs and this week’s auctions were<br />
relatively easily digested, helping intra-EMU spreads to consolidate further<br />
despite the downgrade of Portugal by Moody’s from Aa2 to A1. Irish spreads<br />
were under pressure following the news that Ireland may announce a deficit<br />
for 2010 of almost 17% of GDP as EUR 8.3bn capital given to AIB could be<br />
requalified and included, adding 5.25pp to a projected 11.5% deficit.<br />
In Japan, last weekend's election defeat for the DPJ-led ruling coalition<br />
meant a loss of its majority in the upper house. With many party insiders<br />
attributing the poor showing to Prime Minister Naoto Kan's bungled handling<br />
of the consumption tax debate, there are fears that the government's fiscal<br />
rebuilding efforts might now need to be put on hold for the time being.<br />
Yoshimi Watanabe – leader of Your Party, which won ten of the seats<br />
contested in Sunday's election – wants the government and the Bank of<br />
Japan to target an inflation rate of +2%, which suggests to us that political<br />
pressures may force the central bank to take additional easing measures in<br />
the relatively near future.<br />
Massive untapped demand among domestic investors continues to support<br />
JGBs, with dip-buying helping to limit the market's overall reaction to the<br />
recent rally in stock prices. Short-covering in the super-long sector has<br />
driven a significant flattening of the yield curve, but we expect to see an<br />
easing or partial reversal of this flattening bias ahead of next Thursday's<br />
20yr auction.<br />
Pro-cyclical and<br />
commodity currencies to<br />
remain supported medium<br />
term<br />
In FX markets, while fears of a renewed slowdown may cause some nearterm<br />
volatility, we expect global investor sentiment to be supported by the<br />
apparent readiness of monetary authorities to take prompt action,<br />
suggesting that the pro-cyclical and commodity currencies will remain<br />
supported over the medium term. Indeed, the Fed highlighting downside<br />
risks and the softer data from China are currently overshadowing the strong<br />
corporate earnings data, putting equity markets under pressure and<br />
triggering a broad position unwinding in currency markets – with the USD<br />
selling off. USD weakness is likely to be most emphasised against the yen,<br />
given the continued sensitivity of USD/JPY to US data and developments in<br />
the US yield curve.<br />
However, we believe that the current moves will provide another opportunity<br />
to establish medium-term bullish strategies in the commodity currencies.<br />
Indeed, members of the FOMC have expressed their willingness to take<br />
action if the outlook deteriorates further, while China has reaffirmed its<br />
commitment to sustaining growth. Hence, although some further volatility is<br />
expected in the near term, we would look to buy the AUD in particular as<br />
long as overall Chinese growth is maintained and global liquidity remains<br />
ample.<br />
Further near-term upside<br />
on EUR and GBP<br />
Some further near-term gains are expected for the EUR and GBP in the<br />
current environment as position unwinding persists. However, once again<br />
this will provide an opportunity to establish medium-term strategic positions,<br />
with the EUR and GBP expected to become vulnerable to significant moves<br />
lower again as the full extent of the negative impact from fiscal tightening will<br />
likely become apparent in the weeks ahead. We look to take advantage of a<br />
EUR/AUD rebound over the coming week to establish a medium-term<br />
bearish position.<br />
Cyril Beuzit 16 July 2010<br />
<strong>Market</strong> Mover<br />
3<br />
www.Global<strong>Market</strong>s.bnpparibas.com
Where Have You Gone, Joe DiMaggio?<br />
• The debate on more stimulus in the US has<br />
heated up with a stutter in economic growth and<br />
falling core inflation.<br />
Chart 1: Fiscal Concerns Have Driven Policy<br />
Tightening<br />
• The prospect of additional unconventional<br />
measures has risen. Given our forecasts –<br />
especially for core inflation – QE2 looks likely,<br />
though the form it would take is uncertain.<br />
• In contrast, the ECB is set on the exit from<br />
unconventional measures. Different tracks for<br />
the two central banks could have a big impact<br />
on markets and currencies.<br />
The tone of the global recovery has shifted<br />
notably in recent months and debates are<br />
underway as to whether more policy stimulus is<br />
needed to keep the recovery on track<br />
The tone of the global recovery has shifted notably in<br />
recent months. The European fiscal crisis spurred a<br />
rout in risky assets and a round of fiscal tightening<br />
measures that will limit growth in the next several<br />
years. More recently, a softening in economic data in<br />
the US and China has raised further questions about<br />
the staying power of the rebound, and debates are<br />
underway as to whether more policy stimulus is<br />
needed to keep the recovery on track.<br />
There was considerable disagreement on the need<br />
for more stimulus at the G20 meetings in June, with<br />
European policymakers arguing for fiscal restraint to<br />
shore up credibility and the US arguing for further<br />
deficit-financed stimulus to spur activity. However,<br />
even in the US, the political will for more fiscal<br />
stimulus appears to have evaporated, with aid to<br />
cash-strapped states and unemployment benefits<br />
having recently been nixed by Congress.<br />
This leaves monetary policy, although here the<br />
options are again limited. Short-term rates are<br />
already hovering just above zero, leaving the<br />
duration of zero rates and central bank balance<br />
sheets as the only remaining tools. While Euro area<br />
monetary policymakers have been dragged kicking<br />
and screaming into measures supporting sovereign<br />
funding markets, the Fed proactively shifted its<br />
language in June in a way that pushed back market<br />
expectations for policy tightening. Ultimately, we<br />
think monetary policymakers will be pushed into<br />
delivering more stimulus to prevent a debt<br />
deflationary dynamic from derailing the recovery.<br />
Source: Reuters EcoWin Pro<br />
Chart 2: The US Recovery is Weakest in Post-<br />
War Period<br />
Source: Reuters EcoWin Pro<br />
There seem to be constraints on how much more<br />
fiscal stimulus can be delivered in the US, and<br />
even the more robust European economies with<br />
the ability to engage in further stimulus have<br />
opted for fiscal austerity<br />
The best outcome on the fiscal side would be further<br />
temporary stimulus measures – say, aid to states to<br />
help ease the downward adjustment in spending and<br />
more tax credits for house purchases, coupled with<br />
measures that address the longer-term fiscal outlook.<br />
These should include things that address the<br />
structural deficit from social security and Medicare<br />
such as implementing a near-term ramping up of the<br />
retirement and Medicare eligibility ages. This doesn’t<br />
appear a realistic option, however, given the political<br />
appetite for tackling the US ageing issues. Extending<br />
the Bush tax cuts, at least partially, is a possibility<br />
although this does not provide much stimulus.<br />
Rather, it forestalls tightening so it doesn’t really<br />
Julia Coronado and Paul Mortimer-Lee 16 July 2010<br />
<strong>Market</strong> Mover<br />
4<br />
www.Global<strong>Market</strong>s.bnpparibas.com
arrest the slow growth dynamic we seem to be falling<br />
into. The recent failure of a USD 140bn stimulus bill<br />
that included aid to states and unemployment benefit<br />
extensions to pass the Senate highlights the lack of<br />
political will for further deficit spending. This is not a<br />
philosophical or theoretical issue, but a clear<br />
message from voters to Congress in an election<br />
year. It appears US voters don’t necessarily object<br />
strongly to the Japan-like scenario of slower growth.<br />
This could shift if economic conditions deteriorate<br />
much further but there seem to be constraints on<br />
how much more fiscal stimulus can be delivered in<br />
the US.<br />
The situation is different in Europe. Countries in the<br />
periphery have to tighten fiscal policy hard in order to<br />
try to restore credibility and overcome a potential<br />
inability to sell debt. Ideally, in these circumstances,<br />
we would have liked to have seen the countries with<br />
better fiscal conditions refrain from tightening, or<br />
even supplying a bit of temporary stimulus in order to<br />
support overall aggregate demand. In fact, the<br />
reverse is happening with Germany intent on<br />
tightening policy to set an example. Our view is that<br />
Germany’s expansion owes far too much to exports<br />
and far too little to aggregate demand. A bit of fiscal<br />
push – or a lack of brake – when the momentum in<br />
the traded goods sector was strong could have<br />
helped the recovery spread more broadly to the nontraded<br />
sector. However, that was not to be. Overall,<br />
the fiscal tightening, together with the effects of the<br />
fiscal crisis (lower confidence, likely less willingness<br />
to supply credit by banks) led us to halve our growth<br />
forecast for the eurozone in 2011 to 0.6%.<br />
The choices for monetary policy are also very<br />
difficult<br />
The choices for monetary policy are also very<br />
difficult. In general, it is easier to be aggressive and<br />
creative when you are addressing liquidity crises or<br />
the potential for a second Great Depression and<br />
much harder when the scenario is a Japan-like<br />
outcome of slow growth and no inflation. There are a<br />
few easy first steps. The Fed already took the first<br />
step toward lengthening the horizon for zero rates in<br />
June by citing financial tightening and acknowledging<br />
the downward trend in inflation. It could further<br />
strengthen its language around the inflation and<br />
employment conditions that would lead to both<br />
further easing as well as tightening. Beyond rhetoric,<br />
the Fed could easily announce that it will re-invest<br />
the MBS rolling off, a decision that would forestall a<br />
decline in its balance sheet of USD 100bn-150bn per<br />
year that would otherwise begin in H2. This would be<br />
a signal that it is willing to maintain the current easy<br />
stance of policy and wouldn’t require a new facility or<br />
the re-initiation of an expired facility. Doing so would<br />
imply it would absorb 40-60% of net new mortgage<br />
supply at current rates. It could also lower the<br />
Chart 3: Core Prices are Decelerating<br />
Source: Reuters EcoWin Pro<br />
interest it is paying on reserves from 25bp to zero,<br />
although this could lead to dysfunction in overnight<br />
funding markets (hence leaving it at 25bp and<br />
keeping a target for fed funds as a range between<br />
zero and 25bp even at the height of the crisis).<br />
Further expansion in central bank balance sheets<br />
would be predicated on a worsening in economic<br />
and financial conditions from here<br />
Phase two of quantitative easing, which is to say a<br />
further expansion in the Fed’s balance sheet, would<br />
be predicated on a worsening in conditions from here<br />
that could include deterioration in the labour market,<br />
further pronounced deceleration in inflation that<br />
appears to be leading to deflationary expectations<br />
(one could argue we are getting close with<br />
Treasuries where they are), indications that housing<br />
is slipping back into dangerous territory, or more<br />
pronounced financial market distress.<br />
Housing is still a source of systemic risk as a further<br />
significant leg-down in prices could produce a wave<br />
of strategic defaults and bank losses. This could<br />
prompt the Fed to invoke 13.3 (acting in “unusual<br />
and exigent circumstances”) and add another<br />
tranche of MBS purchases. While buying Treasuries<br />
is the purest form of quantitative easing – and the<br />
ease of exit is certainly something that recommends<br />
it – these purchases would likely raise political and<br />
market concerns that the Fed is monetising the debt.<br />
The Treasury purchase programme was widely<br />
viewed as ineffective by the Fed and certainly<br />
Treasuries are the asset class least in need of<br />
support. QE II would thus more likely be based on a<br />
serious worsening in conditions that would facilitate<br />
the invocation of 13.3 and further credit easing.<br />
There is a scenario in between that does not have<br />
an easy policy prescription – the muddle-through<br />
scenario we are currently in<br />
Beyond committing to zero rates and a stable<br />
balance sheet, it seems difficult to announce a bold<br />
Julia Coronado and Paul Mortimer-Lee 16 July 2010<br />
<strong>Market</strong> Mover<br />
5<br />
www.Global<strong>Market</strong>s.bnpparibas.com
new expansion of the Fed balance sheet without a<br />
notable deterioration in the outlook. And it is not<br />
obvious that more mortgage purchases would be<br />
effective in stimulating aggregate demand, which is<br />
to say it is not clear the balance sheet can be<br />
effective in fine-tuning the outlook. In a speech in<br />
May 2003, then Fed Chairman Alan Greenspan gave<br />
three policy prescriptions to cure the Japanese<br />
deflation and stagnation. He said the Bank of Japan<br />
should commit to a price level rather than an inflation<br />
rate, thus signalling it would allow a period of<br />
reflation, or inflation temporarily above its target. He<br />
also suggested the Bank of Japan should purchase<br />
securities without consideration of the potential<br />
balance sheet losses realised down the road. Finally,<br />
he suggested that the federal government and the<br />
central bank engage in a one-time tax cut financed<br />
by the central bank’s printing of money. This seems<br />
to be an action expressly prohibited by the Federal<br />
Reserve Act and one that would be unwelcome in the<br />
current political environment.<br />
Eurozone on a different path<br />
The Fed has stopped adding to its balance sheet for<br />
the last several months, keeping the stock of<br />
purchased assets at high levels, and is now mulling<br />
whether to engage in further unconventional<br />
measures. The ECB’s policy in unconventional space<br />
has seen more variation.<br />
Aside from a tiny amount of covered-bond<br />
purchases, the ECB’s policy in unconventional space<br />
was until May not the outright purchase of assets but<br />
rather supplying liquidity in the money market. That<br />
has had two dimensions – supplying fixed rate<br />
money at an amount to be decided by the banks, not<br />
the ECB (fixed rate, full allotment), and supplying that<br />
money for longer periods than usual (i.e. through 3-,<br />
6- and 12-month Long Term Refinancing Operations<br />
or LTROs). Exit from this policy had already started<br />
with adjustments to duration – there have been no<br />
further 12-month LTROs since December last year.<br />
Despite the clear signs of financial stress in Greece –<br />
widening CDS and government bonds spreads,<br />
increased reliance by Greek banks on Bank of<br />
Greece funding – the ECB continued with its exit<br />
strategy, scrapping the 6-month LTRO after April and<br />
announcing that the 3-month LTRO would be a<br />
variable rate tender from April.<br />
The eurozone sovereign debt crisis put a stop to the<br />
exit in early May, with the ECB (i) reintroducing<br />
another 6-month fixed rate full allotment LTRO; (ii)<br />
18<br />
16<br />
14<br />
12<br />
10<br />
8<br />
6<br />
4<br />
2<br />
0<br />
Chart 4: ECB Government Bond Purchases<br />
(EURbn)<br />
Source: ECB<br />
ECB Purchases under the<br />
Securities <strong>Market</strong>s Programme (EURbn)<br />
1 2 3 4 5 6 7 8 9<br />
Weeks from the start of the Programme<br />
committing to further 3-month fixed rate full allotment<br />
LTROs until September; and (iii) buying limited<br />
amounts of peripheral government debt.<br />
The lack of enthusiasm for the latter course is<br />
illustrated by the public dissent expressed by Mr<br />
Weber at the instigation of the sovereign debt<br />
purchases and also by the scaling back we have<br />
seen in the quantity of those purchases over recent<br />
weeks (see Chart 4). This trend down in purchases<br />
shows that the ECB is continuing with the exit policy<br />
as is also clear from the fall in excess reserves and<br />
increase in money market rates following the<br />
expiration of the first 12-month repo on 1 July.<br />
Overall then, the Fed is contemplating a further<br />
round of QE in order to stabilise the economy and<br />
avoid a shift down in inflation expectations while the<br />
ECB seems to be continuing, albeit with a blip, its<br />
policy of trying to exit unconventional policies. It is<br />
quite possible that, in coming months, we see the<br />
ECB continuing to exit while the Fed institutes some<br />
form of QE2. The impact of this on the markets will<br />
depend on the speed of the ECB exit, the macro<br />
backdrop and exactly what measures the Fed<br />
chooses to pursue and on what scale. In underlying<br />
philosophy, there is a big gap between the Fed – do<br />
everything possible to avoid bad outcomes – and the<br />
ECB – do as little as possible and hope for the best.<br />
There is also a difference in terms of response to<br />
developments in the real economy, with the ECB<br />
being much less activist and eschewing ‘fine-tuning’.<br />
Thus it is quite possible that we see very different<br />
policy moves in coming months on the two sides of<br />
the Atlantic, which would have important implications<br />
for bonds, spreads and currencies.<br />
Julia Coronado and Paul Mortimer-Lee 16 July 2010<br />
<strong>Market</strong> Mover<br />
6<br />
www.Global<strong>Market</strong>s.bnpparibas.com
US Housing: A Cold Summer<br />
• After the expiry of the first-time<br />
homebuyers’ tax credit at the end of April,<br />
housing starts in May plunged by 10.0% m/m,<br />
existing home sales declined by 2.2%, pending<br />
home sales fell 30.0%, and new home sales<br />
plummeted by 32.7%.<br />
• It is clear that much of the stabilisation in<br />
housing demand over the past year was a<br />
pulling forward of demand through low rates<br />
and the tax credit, leaving the outlook for<br />
housing highly uncertain.<br />
• Weekly data on mortgage applications to<br />
purchase indicate buyers’ interest declined<br />
further in June and early July after falling<br />
considerably in May – suggesting housing<br />
demand will remain depressed throughout the<br />
summer.<br />
2000<br />
1750<br />
1500<br />
1250<br />
1000<br />
750<br />
500<br />
Chart 1: Housing Starts to Remain Weak<br />
250<br />
May Aug Nov Feb May Aug Nov Feb May Aug Nov Feb May Aug Nov Feb May<br />
06 07 08 09 10<br />
Source: Reuters EcoWin Pro<br />
Building Permits (lagged 1 month, k)<br />
Housing Starts (k)<br />
Chart 2: Pending Home Sales Plunge in May<br />
• As we move into the second half of the year,<br />
residential investment is likely to weigh again<br />
on economic growth.<br />
• In Q2, part of this weakness should have<br />
been offset by strength in brokers’<br />
commissions, as total housing sales were better<br />
supported in April.<br />
• We have revised our forecast for residential<br />
investment down to 11.5% q/q AR for Q2 and to<br />
a decline of 5.0% in Q3.<br />
The recent data point to a notable softening in<br />
economic growth. Residential construction is<br />
one sector showing weakness<br />
Economic data softened notably in June, suggesting<br />
the recovery has lost some momentum. Housing<br />
demand has fallen more sharply than expected after<br />
the expiry of the homebuyers’ tax credit; the outlook<br />
for H2 is uncertain but likely to be a neutral at best<br />
for growth. Housing starts plunged by 66k (10% m/m)<br />
to 593k annualised units in May, erasing 80% of the<br />
gains recorded so far this year. Worryingly,<br />
weakness was concentrated in the single-family<br />
sector of the market, where builders broke ground on<br />
17.2% fewer projects in May compared to the<br />
previous month.<br />
Building permits fell for the second consecutive<br />
month in May, declining by 5.9% m/m after a 10.9%<br />
contraction in April, suggesting the pace of new<br />
construction is likely to remain depressed over the<br />
summer. Given that permits lead housing starts by<br />
Source: Reuters EcoWin Pro<br />
Chart 3: No Demand for New Homes<br />
Source: Reuters EcoWin Pro<br />
one to two months, the May decline in permits points<br />
to more weakness in new construction over the near<br />
term (Chart 1). Indeed, we expect housing starts to<br />
decline by another 13k to 580k in the June report<br />
next week. The weakness dovetails with a recent 5-<br />
point decline in the National Association of Builders<br />
Yelena Shulyatyeva 16 July 2010<br />
<strong>Market</strong> Mover<br />
7<br />
www.Global<strong>Market</strong>s.bnpparibas.com
confidence index, as builders reported that prospects<br />
for single family sales deteriorated in June.<br />
Existing home sales should drop sharply in June<br />
following a smaller decline the previous month. In<br />
May, existing home sales declined by 2.2% m/m and<br />
we expect they will drop by 12% in June as pending<br />
home sales plummeted 30% in May (Chart 2). New<br />
home sales plunged 32.7% m/m in May, supplying<br />
further evidence that prospective homebuyers pulled<br />
out of the market en masse after the government<br />
homebuyers’ tax credit expired in April. We expect<br />
new home sales to remain weak in June at 310k<br />
annualised units, rebounding by just 3.3% from the<br />
30-year low (Chart 3). Housing is slipping back into<br />
dangerous territory and a further extension of the tax<br />
credit could be beneficial. However, the recent failure<br />
of a stimulus bill that included aid to states and<br />
unemployment benefit extensions to pass the Senate<br />
highlights the lack of political will for further deficit<br />
spending.<br />
The bill signed into law on 2 July only extends<br />
the deadline for closing transactions<br />
The Homebuyer Assistance and Improvement Act of<br />
2010, signed by President Obama on 2 July,<br />
recognises that an estimated 180,000 prospective<br />
new homeowners were not able to meet the 30 June<br />
closing deadline for the tax credit that expired in April<br />
due to red tape involving mortgage lenders and<br />
guarantors. The new legislation extends the closing<br />
deadline from 30 June to 30 September for eligible<br />
homebuyers. The law thus provides any homebuyer<br />
who entered into a contract on a home by 30 April<br />
but was unable to go to closing within the required 60<br />
days, an additional 90 days to close and qualify for<br />
the credit. The legislation is great news for those<br />
homebuyers who were unable to close before 30<br />
June. However, it does not extend the deadline for<br />
homebuyers to sign a contract for a home. Therefore,<br />
while the new law will likely smooth the projected<br />
path of declines in existing home sales, it will not<br />
help revive the demand for housing.<br />
Mortgage applications have plunged recently,<br />
suggesting housing demand will remain subdued<br />
Mortgage applications to purchase a home declined<br />
by 22% m/m in May and another 11.5% in June, to<br />
their lowest level since 1996 – suggesting<br />
prospective buyers are already pulling back sharply<br />
and helping underpin our belief that housing demand<br />
will remain sluggish in the summer months (Chart 4).<br />
We have revised our forecast for residential<br />
investment down to 11.5% q/q AR for Q2 and to<br />
negative 5.0% in Q3<br />
We previously estimated more of a boost from the<br />
tax credit programme and the pullback to be more<br />
Chart 4: Mortgage Applications Plunged in May<br />
Source: Reuters EcoWin Pro<br />
Chart 5: Broker Commissions to Support<br />
Residential Investment in Q2<br />
Source: Reuters EcoWin Pro<br />
muted. We had projected residential investment to<br />
grow 17.0% q/q AR in Q2 and 5% in Q3. However,<br />
recent developments suggest less growth in Q2 and<br />
point to a contraction in Q3. In Q2, part of this<br />
weakness should have been offset by strength in<br />
brokers’ commissions, as total housing sales jumped<br />
by 8.5% m/m in April. The latest FOMC minutes<br />
made a note that “on net, the upswing in the volume<br />
of real estate transactions in recent months was<br />
likely to boost the brokers’ commissions component<br />
of residential investment in the second quarter”.<br />
Indeed, while new home sales plummeted by 32.7%<br />
m/m in May, demand for newly built homes currently<br />
accounts for a mere 5% of the market, while sales of<br />
previously owned homes dominate demand. In this<br />
respect, while existing home sales declined by 2.2%<br />
m/m to 5.66mn annualised units in May, the<br />
weakness was not enough to offset a healthy 8.0%<br />
gain in April. Brokers’ commissions on the sale of<br />
residential structures currently represent 18.6% of<br />
residential investment, and were supportive of overall<br />
growth (Chart 5). However, a 30% m/m plunge in the<br />
pending home sales index, which leads existing<br />
home sales by one to two months, points to less of a<br />
contribution from brokers’ commissions in Q2 than<br />
we previously estimated. Against this background,<br />
Yelena Shulyatyeva 16 July 2010<br />
<strong>Market</strong> Mover<br />
8<br />
www.Global<strong>Market</strong>s.bnpparibas.com
we expect residential investment to grow by 11.5%<br />
q/q AR and contract by 5.0% in Q3.<br />
Subdued outlook<br />
The Freddie Mac 30-year fixed mortgage rate hit a<br />
new low of 4.57% last week (Chart 6). Fresh lows in<br />
mortgage rates should provide some support to<br />
housing demand. However, the bigger effect should<br />
be on mortgage applications to refinance. We look<br />
for only a modest improvement in housing demand<br />
through the remainder of the year. Consequently,<br />
there is likely to be downward pressure on housing<br />
prices. As the FOMC minutes noted: “House prices<br />
declined somewhat in recent months, reversing some<br />
of the modest increases that occurred in the spring<br />
and summer of 2009”. Home prices will likely remain<br />
sluggish throughout this year.<br />
Chart 6: Mortgage <strong>Rate</strong>s at Historical Bottom<br />
Source: Reuters EcoWin Pro<br />
Yelena Shulyatyeva 16 July 2010<br />
<strong>Market</strong> Mover<br />
9<br />
www.Global<strong>Market</strong>s.bnpparibas.com
UK Inflation: Mind the Gap<br />
• Recent changes in the inflation measure<br />
used to index benefits and pensions have<br />
attracted attention to the difference between CPI<br />
and RPI inflation.<br />
Chart 1: Contributions to CPI-RPI Difference<br />
• We examine here exactly what drives the<br />
difference between CPI and RPI inflation and<br />
how the gap is likely to evolve.<br />
• We expect the gap to narrow temporarily<br />
over the coming year, before widening sharply<br />
during 2012 when Bank <strong>Rate</strong> begins to rise.<br />
The switch in the gauge of inflation that is used to<br />
benchmark private sector pension schemes has<br />
generated considerable attention in the differences<br />
between CPI and RPI inflation. The move, intended<br />
to boost consistency, follows the announcement in<br />
the Emergency Budget that public sector pensions<br />
and benefits will now rise in line with CPI inflation<br />
rather than RPI inflation. Given this, we have<br />
provided a guide to what the differences in the two<br />
indices are and secondly, how we expect the gap<br />
between the two to evolve.<br />
Difference between CPI and RPI<br />
The CPI and RPI are compiled using the same<br />
underlying price data. However, there are a number<br />
of differences:<br />
• The CPI excludes a number of RPI series, in<br />
particular, council tax, mortgage interest<br />
payments, housing depreciation and<br />
buildings insurance;<br />
• The CPI includes a number of series that are<br />
not included in the RPI. In particular,<br />
university accommodation fees, foreign<br />
students’ university fees and stockbrokers’<br />
charges;<br />
• The weights applied to some components of<br />
the CPI are a little different from the weights<br />
applied to the equivalent component of the<br />
RPI; and<br />
• The CPI uses the geometric mean to<br />
combine the individual prices while the RPI<br />
uses the arithmetic mean.<br />
Note that RPIX is the RPI excluding mortgage<br />
interest payments.<br />
Source: Reuters EcoWin Pro, <strong>BNP</strong> Paribas<br />
Recent developments in the CPI-RPI differential<br />
The experience of the last 18 months provides a very<br />
good illustration of what typically determines the<br />
differential between CPI and RPI inflation.<br />
By far the biggest difference between CPI and RPI<br />
inflation is the inclusion of housing related<br />
components in the RPI but not the CPI (Chart 1). In<br />
turn, mortgage interest payments (MIPs) and house<br />
price inflation tend to be the biggest contributors.<br />
By way of example, the gap between CPI and RPI<br />
inflation exploded to over 3 percentage points during<br />
2009. RPI inflation plunged to a low-point of<br />
-1.6% y/y while CPI inflation only slowed to 1.1%.<br />
RPI inflation slumped owing to a combination of<br />
falling house prices and interest rate cuts. More<br />
specifically, the BoE slashed Bank <strong>Rate</strong> from 5.75%<br />
to 0.5%. This caused the MIPs component to plunge<br />
by 45% y/y. Given a weight of around 5% in the RPI<br />
index, that subtracted over 2pp from RPI inflation.<br />
Similarly, the house price inflation component of the<br />
RPI slumped to a low point of -13% y/y. With a<br />
weight of 5% in the index, that subtracted over 0.5pp<br />
from headline RPI inflation.<br />
Over the last year the differential has reversed i.e.<br />
RPI inflation has gone from around 3pp below CPI<br />
inflation, to 2pp above CPI inflation. The bulk of that<br />
change has reflected an unwinding of the influences<br />
that provoked last year’s undershoot. More<br />
specifically, since mortgage rates are no longer<br />
falling, the near 45% y/y decline in the MIPs<br />
component has recovered to +5%. That 50pp move<br />
in itself has added almost 2.5pp to RPI inflation since<br />
the trough. Likewise, house price inflation has<br />
Alan Clarke 16 July 2010<br />
<strong>Market</strong> Mover<br />
10<br />
www.Global<strong>Market</strong>s.bnpparibas.com
ebounded from -13% y/y to +8%. That has added<br />
another percentage point to headline RPI inflation.<br />
These developments have neutralised the<br />
contribution from housing and explain why RPI<br />
inflation is no longer below CPI inflation, but not why<br />
RPI inflation is now above CPI inflation. There are<br />
two main reasons for the near 2pp overshoot of RPI<br />
inflation relative to CPI inflation.<br />
The first is the formula effect i.e. the different<br />
averaging technique used in calculating the index.<br />
This is pretty stable through time at around 0.5pp,<br />
though currently accounts for 0.8pp of the differential.<br />
The other key contributor to the current gap is<br />
differences in weights between the two series. A<br />
good example of this is alcohol and tobacco. In the<br />
CPI this component has a weight of 4%, while it is<br />
more than double that (9.1%) in the RPI. Alcohol and<br />
tobacco inflation has been accelerating much more<br />
quickly than average over the last year, which, given<br />
the higher weight in the RPI helps to explain why RPI<br />
inflation has risen by more than CPI inflation.<br />
Which way now?<br />
We expect the gap between RPI and CPI inflation to<br />
narrow over the next 12 months to almost zero<br />
before widening again during 2012. More specifically,<br />
we expect a slowdown in the components such as<br />
alcohol that have accounted for much of the current<br />
gap between RPI and CPI inflation. Similarly, slowing<br />
house price inflation should bear down on RPI<br />
inflation, also contributing to the narrowing gap with<br />
CPI inflation.<br />
Thereafter we expect interest rate hikes during 2012<br />
to drive a wedge between the two series. Given the<br />
extremely low level of mortgage rates, a small<br />
interest rate hike is likely to have a big effect on RPI<br />
inflation.<br />
By way of example, the current level of the average<br />
mortgage rate according to the BoE is around 3½%.<br />
If the BoE were to hike Bank <strong>Rate</strong> to 2% by end-<br />
2012 (i.e. in line with market expectations), given the<br />
typical 70% passthrough to mortgage rates, that<br />
would represent a 30% increase in the MIPs<br />
component. In turn, that would add around 1.5pp to<br />
RPI inflation.<br />
from the MIPs component and hence the gap<br />
between RPI and CPI inflation. Unless Bank <strong>Rate</strong><br />
continues to rise for ever, that contribution from rising<br />
mortgage rates should at some point begin to fade –<br />
2014 in our view. Although we would envisage the<br />
gap narrowing at that point the formula effect should<br />
ensure that the gap between CPI and RPI inflation<br />
stabilises at around 0.5-0.75pp.<br />
Changes to the index<br />
One potential additional influence on this gap is the<br />
inclusion of some measure of house price inflation in<br />
the CPI. When this does happen, it should help to<br />
narrow the gap between RPI and CPI inflation.<br />
However, this change has been a long time coming<br />
and we gather is unlikely before 2012.<br />
Conclusion<br />
Over the longer run, the gap between RPI and CPI<br />
inflation is likely to narrow relative to current levels to<br />
reside closer to 0.5pp y/y. However, over the shorter<br />
term, the gap is likely to remain variable not least<br />
when the BoE eventually begins to raise Bank <strong>Rate</strong>.<br />
While this presents a potential headache for private<br />
sector pension funds in adjusting to the new rules,<br />
the adoption of the CPI for indexing public sector<br />
pensions was a master stroke by the Chancellor. It is<br />
likely to save the government around GBP 6bn per<br />
year by 2014-15.<br />
Clearly, there has been some discontent expressed<br />
by those who will be receiving less from their state<br />
pensions. However, few (if any) have acknowledged<br />
that this year’s increase was well above RPI inflation.<br />
September is the reference month for public sector<br />
pensions and benefits. Last September, RPI inflation<br />
was around -1½% y/y. However, because of the<br />
2.5% floor applied to public sector pensions this<br />
year’s increase was 4pp above RPI inflation. The<br />
bottom line is that public sector pension payments<br />
may well miss out on the boost to RPI inflation (of up<br />
to 4pp) once Bank <strong>Rate</strong> begins to rise. However, we<br />
suspect a spell of amnesia will block out memories of<br />
the RPI increase awarded in April 2010.<br />
Alan Clarke 16 July 2010<br />
<strong>Market</strong> Mover<br />
11<br />
www.Global<strong>Market</strong>s.bnpparibas.com
Denmark: The Tide is Turning<br />
• Given excess liquidity in the eurozone,<br />
higher money market rates in Denmark led to an<br />
appreciation of the krone earlier in 2010.<br />
Chart 1: 3m Interbank & Official <strong>Rate</strong> Spreads<br />
• The krone, however, has been depreciating<br />
vis-à-vis the euro in recent weeks.<br />
• This seems to be driven by lower excess<br />
liquidity in the eurozone and thus higher money<br />
market rates.<br />
• Given these recent developments, we no<br />
longer expect rate cuts from the central bank.<br />
• There is some evidence that the Danish<br />
central bank already started to draw on its FX<br />
reserves to defend the currency.<br />
• We expect it to continue to do so as long as<br />
the weakening trend continues. Only if this<br />
proves unsuccessful and reserves fall too<br />
much, policy rates would be raised.<br />
Lower rates so far this year…<br />
Since the beginning of this year, the Danish central<br />
bank has cut its policy rate by a total of 15bp to<br />
1.05%. The interest rate on certificates of deposit has<br />
been cut even more, by 45bp to 0.5%. These<br />
reductions were a “consequence of further purchases<br />
of foreign exchange in the market”. The<br />
strengthening of the currency was a tightening of<br />
monetary conditions, with the accumulation of<br />
reserves an attempt to prevent this. But continued<br />
appreciation pressures had to be reflected in an<br />
easing in another aspect of monetary conditions,<br />
namely official interest rates.<br />
As we have highlighted before (see Denmark:<br />
Surprise, Surprise, <strong>Market</strong> Mover, 15 January 2010),<br />
as there is excess liquidity in the eurozone, the rate<br />
determining eurozone market rates is the deposit<br />
rate (0.25%) rather than the ECB’s refi rate (1%). On<br />
the other hand, the Danish central bank does not<br />
leave excess liquidity in the banking system. Instead,<br />
it supplies the liquidity banks want (full allotment) but<br />
then mops up with certificates of deposit (now at<br />
0.5%). This certificates of deposit/deposit rate<br />
differential, which explains higher money market<br />
rates in Denmark compared to the eurozone (Chart<br />
1), led to hot-money inflows. This in turn<br />
strengthened the Danish krone vis-à-vis the euro and<br />
prompted the Danish central bank to cut rates.<br />
…as the DKK gained ground<br />
The last two deposit rate cuts from the Danish central<br />
Source: Reuters EcoWin Pro<br />
Source: Reuters EcoWin Pro<br />
Chart 2: EUR/DKK<br />
bank (in May) were also driven by these factors.<br />
Given the intensification of stress in financial markets<br />
due to fiscal jitters in the eurozone, the ECB<br />
announced measures to enhance liquidity in the<br />
system. This also had implications for Denmark. For<br />
example, a eurozone bank with excess liquidity could<br />
put the money in Denmark at 0.7% (before the two<br />
rate cuts in May) rather than getting 0.25% in the<br />
eurozone.<br />
These rate differentials in turn led to an appreciation<br />
of the krone vis-à-vis the euro. In mid-June,<br />
EUR/DKK reached its lowest level since the<br />
beginning of 2005.<br />
But recently EUR/DKK has been moving higher<br />
very quickly…<br />
Since mid-June, however, EUR/DKK has been<br />
trending higher (Chart 2). On 13 July, EUR/DKK<br />
reached its highest level since October 2008, a<br />
period when the Danish central bank was increasing<br />
rates to bolster the krone.<br />
Gizem Kara 16 July 2010<br />
<strong>Market</strong> Mover<br />
12<br />
www.Global<strong>Market</strong>s.bnpparibas.com
At first glance, this latest development is puzzling. A<br />
current account surplus and changes in capital flows<br />
mean Denmark is still running a basic balance<br />
surplus, pointing to a stronger currency. Also, there is<br />
still a 25bp gap between the interest rate on<br />
certificates of deposit in Denmark and the ECB<br />
deposit rate – hence arbitrage opportunities continue.<br />
Chart 3: Use of Deposit Facility at the ECB &<br />
EUR/DKK<br />
So what is driving the recent depreciation of the DKK<br />
vis-a-vis the EUR?<br />
…driven by developments in the eurozone policy<br />
There seems to be a relationship between the use of<br />
the deposit facility at the ECB and developments in<br />
EUR/DKK over the past couple of months (Chart 3).<br />
The depreciation of the DKK could be partially driven<br />
by lower excess reserves in the eurozone, which<br />
could suggest lower flows into the DKK.<br />
Since the end of June, short-term money market<br />
rates in the euro area have also been drifting higher.<br />
The 1-week and 3-month Euribor rates have risen<br />
10-15bp over the past three weeks and are now back<br />
at their levels of June and August last year,<br />
respectively. The recent changes to refinancing<br />
operations at the ECB, including the expiry of the first<br />
1-year long-term refinancing operation, have reduced<br />
the excess liquidity in the system. This is pushing<br />
money market rates higher. Also, at the press<br />
conference after the rate decision last week, the ECB<br />
hinted at backing away from its unconventional<br />
measures. We believe the ECB should commit to<br />
take whatever action is necessary, given the<br />
problems in the eurozone sovereign debt markets<br />
and banks. But the ECB seems to be pushing on with<br />
the exit strategy, leading to expectations of higher<br />
rates (although the ECB has asserted that the<br />
increase in short-term rates should not be interpreted<br />
as a policy signal).<br />
In the meantime, Danish money market rates have<br />
been hovering around their all-time lows. With EUR<br />
rates now pushing up, money market spreads are<br />
trending lower. For example, given lower excess<br />
liquidity now in the eurozone, the Danish overnight<br />
rate spread vis-à-vis the eurozone has even turned<br />
negative (Chart 4). This is leading to outflows from<br />
the DKK into the EUR.<br />
The implications for Danish monetary policy<br />
We had expected the Danish central bank to cut its<br />
policy and deposit rates further as rate differentials<br />
with the eurozone were leading to an appreciation of<br />
the krone. But the recent depreciation of the DKK visà-vis<br />
the EUR suggests rate cuts are now unlikely,<br />
leading us to change our view.<br />
There is already some evidence that the central bank<br />
Source: Reuters EcoWin Pro<br />
Chart 4: O/N <strong>Rate</strong> Spread (%) & EUR/DKK (% y/y)<br />
Source: Reuters EcoWin Pro<br />
Chart 5: Foreign Exchange Reserves<br />
Source: Reuters EcoWin Pro<br />
started to draw on its FX reserves to defend the<br />
currency (EURDKK ticked down on 14 July and<br />
pushing lower at the time of writing).<br />
Our assumption is that the ECB will further extend its<br />
liquidity provision, although likely divisions on the<br />
Governing Council could delay the implementation of<br />
such policies. Given this, the Danish central bank is<br />
likely to continue to draw on its FX reserves in the<br />
short term to support the currency. Only if such<br />
action fails, and reserves fall too much, the bank will<br />
need to hike rates.<br />
Gizem Kara 16 July 2010<br />
<strong>Market</strong> Mover<br />
13<br />
www.Global<strong>Market</strong>s.bnpparibas.com
China: House Price Controls to Continue<br />
• Since April 17, China has tightened policy in<br />
order to control housing prices, focusing on<br />
suppressing investment and speculative<br />
demand.<br />
50<br />
45<br />
Chart 1: Property Investment Continues<br />
Accelerating (% YTD)<br />
• Housing transactions have fallen<br />
substantially but a significant correction in<br />
house prices has not yet taken place.<br />
• As China’s economic growth momentum<br />
has weakened significantly, the market is<br />
starting to speculate that housing policy will be<br />
relaxed while banks are starting again to extend<br />
mortgage loans for third houses and more.<br />
• Our argument that there will be no relaxation<br />
is underscored by government actions, with<br />
three authorities reiterating that the policies to<br />
rein in house prices are unchanged and that the<br />
objective of controlling prices is intact.<br />
• We expect the correction in house prices to<br />
gain momentum; the housing industry may have<br />
bottomed out by the end of the year.<br />
Commercial banks in Shanghai, Nanjing, Hangzhou,<br />
Shenzhen and Beijing are reported to have quietly<br />
resumed the extension of mortgage loans for third<br />
houses or more but with a deposit of more than 50%<br />
and at a rate of more than 110% of the policy rate.<br />
There has been much speculation that the authorities<br />
will relax house price controls given the general<br />
weakening in economic growth momentum and the<br />
government's increasing concerns of ‘overcooling’.<br />
The authorities said earlier this week that the<br />
measures to control prices are not being rescinded.<br />
The Ministry of Housing and Rural-Urban<br />
Development reiterated that the government will<br />
continue to implement the policies set out by the<br />
state council on 17 April, and remains determined to<br />
suppress investment and speculative demand in<br />
housing. The ministry, however, supports increased<br />
investment in the construction of ordinary and public<br />
housing.<br />
The CBRC, for its part, has clearly stated that there<br />
is no change in mortgage loan policy for second<br />
house and more, with all commercial banks required<br />
to strictly abide by financial rules and regulations.<br />
The State Asset Administration Commission (SAAC)<br />
denied the reports saying it was requiring property<br />
developers in state-owned enterprises (SOEs) to<br />
aggressively acquire more land, restating that the<br />
40<br />
35<br />
30<br />
25<br />
20<br />
15<br />
10<br />
5<br />
0<br />
04 05 06 07 08 09 10<br />
Source: NBS, <strong>BNP</strong> Paribas<br />
Residential property investment<br />
Property investment<br />
SAAC is demanding 76 central SOEs for which<br />
property development is not their core business to<br />
sell off their property development arms.<br />
House price controls to continue<br />
In fact, the objective of controlling house prices is far<br />
from being achieved. Since 17 April, when the state<br />
council announced its intention to stop housing<br />
prices from rising too far too fast in some cities,<br />
housing transaction have fallen substantially.<br />
However, in tier-1 cities in particular, the correction in<br />
house prices has not yet occurred – at most, it has<br />
just started. This can be seen from the indicators of<br />
property performance below.<br />
Property investment growth continues to accelerate:<br />
it came in at 39.6% y/y in Q2, up from 35.1% in Q1<br />
(H1: 38.1% y/y). Residential housing investment,<br />
which accounts for 69.3% of property investment,<br />
accelerated from 33% y/y in Q1 to 35.1% in Q2 (H1:<br />
34.4% y/y). Property space under construction<br />
increased by 28.7% y/y in H1, but newly started<br />
property space surged by 67.9% y/y. However,<br />
completed property space increased by only 18.2%<br />
y/y, and residential housing space completed rose by<br />
15.5% (Chart 1).<br />
Property transactions have fallen. Property sales<br />
amounted to 394 million sqm in H1 10, up by 15.4%<br />
y/y, but growth slowed from 35.8% y/y in Q1 to 5.4%<br />
in Q2. Residential housing sales rose 12.7% y/y in<br />
H1, but growth plunged from 34.2% in Q1 to 2.2%.<br />
Sale values rose 25.4% y/y in H1 10, but the growth<br />
rate also dropped sharply – from 57.7% y/y in Q1 to<br />
10.1%. Housing sales increased by 20.3%, with<br />
growth slowing to 4.4% in Q2 from 55.2% (Chart 2).<br />
Xingdong Chen 16 July 2010<br />
<strong>Market</strong> Mover<br />
14<br />
www.Global<strong>Market</strong>s.bnpparibas.com
But property prices have barely corrected…<br />
The property price index increased 11.4% y/y in June,<br />
compared to 12.4% in May, 12.8% in April and<br />
11.7% in March. The index actually dropped 0.1%<br />
m/m in June, the first m/m decline recorded for 17<br />
months. The housing price index was up 14.1% y/y in<br />
June, but was flat in m/m terms (Chart 3).<br />
…because property developers are not short of<br />
funding<br />
Property investment capital supply rose 45.6% y/y in<br />
H1. Capital supply is equivalent to 178% of property<br />
investment. Capital borrowed from banks increased<br />
by 34.5% y/y (compared to overall lending growth of<br />
19.2%), property developers’ self-raised funds<br />
surged by 50.9%, and other funds were up by 47.9%.<br />
Property developers are thus not under pressure to<br />
cut house selling prices for cash flow purposes<br />
despite housing inventory rising, even stepping up<br />
the pace of investment and construction (Charts 4<br />
and 5).<br />
Controlling house prices has become a political<br />
game between the central government and property<br />
developers. Local governments are waiting for the<br />
central government to change policy. In our view,<br />
house price controls will not be changed for the time<br />
being. If the government relaxes current policy in any<br />
way, house prices could start to rise again and the<br />
authorities would lose credibility.<br />
In fact, if the government relaxes controls at this<br />
stage, the property industry could in the longer term<br />
suffer even more than it would if policy is left<br />
unchanged. It is a critical time for both the<br />
government and property developers. As long as<br />
house prices fall by 10-15%, social expectation will<br />
be satisfied, the government will relax the controls<br />
and the property industry will be able to return to<br />
normal growth. If the government continues with its<br />
existing policies, the correction in house prices will<br />
gather momentum and the policy objective could be<br />
achieved in Q4 this year.<br />
In terms of policy, we expect the government to strike<br />
a better balance between propping up growth and<br />
economic restructuring at the upcoming summer<br />
meeting; we do not expect a general easing. Rather,<br />
we expect selective easing: a delay or scaling down<br />
of the measures to rectify local government financing<br />
vehicles; the easing of policies designed to tackle<br />
excessive capacity and pollution; and the alleviation<br />
of measures to tighten corporate liquidity.<br />
Chart 2: Property Transactions have Declined<br />
Substantially (% YTD)<br />
90<br />
80<br />
70<br />
60<br />
Property sales value<br />
50<br />
40<br />
30<br />
20<br />
10<br />
0<br />
Property sales volume<br />
-10<br />
-20<br />
-30<br />
00 01 02 03 04 05 06 07 08 09 10<br />
Source: NBS, <strong>BNP</strong> Paribas<br />
Chart 3: House Price Correction has Only Just<br />
Started<br />
114<br />
112<br />
110<br />
108<br />
106<br />
104<br />
102<br />
100<br />
(Dec 08 = 100)<br />
Property price index<br />
98<br />
Dec-08 Feb-09 Apr-09 Jun-09 Aug-09 Oct-09 Dec-09 Feb-10 Apr-10 Jun-10<br />
Source: NBS, <strong>BNP</strong> Paribas<br />
Chart 4: Housing Inventory is Rising (% YTD)<br />
70<br />
60<br />
50<br />
40<br />
30<br />
20<br />
10<br />
0<br />
-10<br />
Floor space completed<br />
Property sales volume<br />
-20<br />
00 01 02 03 04 05 06 07 08 09 10<br />
Source: NBS, <strong>BNP</strong> Paribas<br />
80<br />
70<br />
60<br />
50<br />
40<br />
30<br />
20<br />
Chart 5: Newly Started Property Space May<br />
have Peaked (% YTD)<br />
Floor space started<br />
Property sales volume<br />
10<br />
0<br />
-10<br />
-20<br />
00 01 02 03 04 05 06 07 08 09 10<br />
Source: NBS, <strong>BNP</strong> Paribas<br />
Xingdong Chen 16 July 2010<br />
<strong>Market</strong> Mover<br />
15<br />
www.Global<strong>Market</strong>s.bnpparibas.com
Japan: Post-Election Outlook for Tax Reform<br />
• The Kan Government’s election defeat was<br />
not due to its talk of a sales tax hike but to<br />
comments that tax hikes would boost growth.<br />
This smacked of ‘big government’ and put off<br />
independent voters.<br />
• Since the pro-reform camp within the DPJ is<br />
sure to be under pressure from the antireformists<br />
to take responsibility for the election<br />
defeat, fiscal reform will likely be stalled in the<br />
near term.<br />
• From a longer-term perspective, fiscal<br />
restructuring will stay on track because the two<br />
largest parties both recognise the need for<br />
reform (including tax rises).<br />
• Until the DPJ’s leadership election in<br />
September (when Kan’s fate as leader will be<br />
determined), we expect the Kan government to<br />
horse-trade with other parties to secure the<br />
cooperation or alliances needed for stable<br />
governance.<br />
Election setback was not due to tax hike talk<br />
Did the Kan government lose Sunday’s Upper House<br />
election (and with it, the ruling bloc’s majority in that<br />
chamber) because of its forward-looking stance on<br />
fiscal restructuring and a consumption tax hike? The<br />
LDP also advocated fiscal reform and a consumption<br />
tax hike, yet it gained seats. Clearly, much of the<br />
electorate now understands that unless fiscal reform<br />
also includes higher taxes, the nation’s public debt<br />
will snowball out of control. One reason voters chose<br />
the LDP over the DPJ is probably that Prime Minister<br />
Kan has been anything but forthcoming on the<br />
reason for the consumption tax hike.<br />
With Kan’s pre-election comments about a tax hike<br />
bolstering economic growth, many voters feared that<br />
the tax hike would not just be used to improve the<br />
state finance and reform social security but it would<br />
also go on new spending programmes under the<br />
guise of ‘growth strategies’. In other words, Kan’s<br />
comments smacked of ‘big government’, and this put<br />
off the majority of independent voters. In any event, if<br />
the prime minister sees a tax hike as a means of<br />
bolstering economic growth via greater state<br />
involvement (spending) in the private sector, he is<br />
grossly mistaken (see accompanying article, Japan:<br />
PM Kan’s Dubious <strong>Economics</strong>).<br />
Chart 1: Composition of Upper House<br />
Ruling <br />
110<br />
People's New<br />
Party and<br />
others (4)<br />
DPJ(106)<br />
Source: <strong>BNP</strong> Paribas<br />
LDP84)<br />
Total242<br />
Opposition<br />
132<br />
Others (18)<br />
New Komeito<br />
(19)<br />
Your Party<br />
(11)<br />
Short-term slowdown in pace of tax reform<br />
What is the outlook for fiscal restructuring following<br />
the government’s election setback? Will tax reform<br />
be sidetracked? One reason Japan’s long-term<br />
interest rate has edged lower this past month is<br />
because the two largest political parties, the ruling<br />
DPJ and the opposition LDP, were both advocating<br />
accelerated fiscal reform in their election campaigns<br />
(of course, the main reason was downward pressure<br />
on the global equilibrium real interest rate from<br />
weakening growth expectations for the US and EU).<br />
Now, with the pro-reform camp within the DPJ likely<br />
to be under pressure from the anti-reformists to take<br />
responsibility for the election defeat, the result will<br />
likely be a compromise in both the tempo and<br />
content of tax reform proposals at least until the<br />
DPJ’s leadership election in September.<br />
Consequently, there could be some increase in the<br />
fiscal risk premium. Even so, we doubt that the longterm<br />
rate will show any pronounced nominal increase<br />
because private sector demand for funds is unlikely<br />
to pick up owing to Japan’s deflation and falling<br />
growth expectations.<br />
Fiscal reform to stay on track over long haul<br />
From a longer-term perspective, however, we do not<br />
think that the latest election results will necessarily<br />
derail fiscal reform. As pointed out above, the DPJ<br />
and LDP both recognise the need for fiscal reform.<br />
Thus, even though the Diet will likely continue to be<br />
divided (the Upper House is controlled by the<br />
opposition, the Lower House by the ruling camp), it is<br />
important that a majority of lawmakers, regardless of<br />
party affiliation, now acknowledge the need for fiscal<br />
consolidation and tax reform. What is more, this shift<br />
in opinion in the Diet was brought about not because<br />
Ryutaro Kono 16 July 2010<br />
<strong>Market</strong> Mover<br />
16<br />
www.Global<strong>Market</strong>s.bnpparibas.com
political leaders persuaded the public but because<br />
politicians reacted to the public’s own realisation of<br />
the nation’s worsening fiscal predicament. Even if<br />
bickering within the ruling camp somewhat slows the<br />
pace of fiscal restructuring, the divided Diet will,<br />
ironically, ensure that reforms are not derailed<br />
entirely (this is one of the merits of the gradualistic,<br />
consensus-based decision making in a bicameral<br />
system).<br />
Fiscal reform has wide support<br />
Issues such as pension reform and fiscal reform are<br />
national problems, so a supra-partisan approach is<br />
certainly the best way to go. Indeed, the recent fiscal<br />
restructuring programmes of Germany and the UK<br />
were decided by coalition governments. It might<br />
therefore be fortunate that the Kan government’s<br />
recently unveiled fiscal management strategy only<br />
deals with the big picture (objectives, targeted<br />
timeframes). The lack of specifics should make it<br />
easier for parties to collaborate, as they are starting<br />
with a blank slate that can be filled in together –<br />
rather than a detailed programme that must be<br />
haggled over. Each party naturally has its own vision<br />
for Japan and the optimal tax system, but the<br />
country’s dire fiscal situation should make nonpartisan<br />
cooperation on reform possible.<br />
But hurdles exist<br />
That said, there are high hurdles that must be<br />
overcome in order to achieve cooperation with the<br />
opposition. The LDP has indicated that it is prepared<br />
to engage in multiparty talks on the tax reform issue,<br />
on the condition that the DPJ scrap spending<br />
programmes that it promised in its manifesto for last<br />
year’s Lower House election (e.g. child-rearing<br />
allowances). Many reform-minded DPJ lawmakers,<br />
including cabinet ministers, would probably be<br />
amenable to amending the campaign promises in<br />
order to advance discussions on tax reform. However,<br />
the camp (led by Ichiro Ozawa) that is lukewarm on<br />
tax reform is adamant that promises must be kept. If<br />
the reformists move to get their way by force,<br />
acceding to the demands to forgo campaign<br />
promises, there is a chance that the internal divisions<br />
in the DPJ could split the party in two.<br />
Link-ups with like-minded smaller parties?<br />
As for other opposition parties, the policy ideas of<br />
small parties such as New Komeito and Your Party<br />
are similar to those of the DPJ; incorporation into the<br />
ruling coalition is thus not inconceivable. New<br />
Komeito is the most like-minded in that it recognises<br />
the necessity of tax reform (including an increased<br />
consumption tax) in order to prop up the tottering<br />
social welfare systems.<br />
However, an outright link-up with the DPJ looks<br />
unlikely, as New Komeito fought fiercely against the<br />
party in the Upper House election campaign,<br />
slamming the DPJ for its money scandals (Hatoyama,<br />
Ozawa) and ineffective leadership, and arguing that<br />
the DPJ-led coalition should be kicked out of office.<br />
New Komeito, moreover, is still closely linked with<br />
the LDP (they cooperated in the recent election by<br />
not fielding candidates against each other).<br />
Meanwhile, Your Party, a newcomer on the scene<br />
(created in 2009 by LDP defectors) which emerged<br />
as the biggest winner in the Upper House election (it<br />
gained 10 seats), advocates fiscal restructuring via<br />
spending cuts and accelerated growth; it is opposed<br />
to raising taxes. The DPJ would therefore find it<br />
difficult to secure cooperation on tax reform from this<br />
party, although the two might be able to cooperate on<br />
other issues.<br />
Behind-the-scenes horse-trading until after DPJ’s<br />
leadership election<br />
At this juncture, it is hard to gauge what kind of<br />
framework the government will adopt in running the<br />
Diet and formulating policies, including tax reforms.<br />
The DPJ has indicated that it intends to engage in<br />
policy-based cooperation with other parties, but<br />
stronger links with a specific party will be needed for<br />
stable governance. On the surface, not much is likely<br />
to happen until after the DPJ’s leadership election in<br />
September (when Kan’s fate as leader will be<br />
decided), but behind the scenes the Kan government<br />
is likely to horse-trade with other parties to win closer<br />
cooperation, or an alliance.<br />
Ryutaro Kono 16 July 2010<br />
<strong>Market</strong> Mover<br />
17<br />
www.Global<strong>Market</strong>s.bnpparibas.com
Japan: PM Kan’s Dubious <strong>Economics</strong><br />
• Prime Minister Kan has said that tax hikes<br />
and increased government spending can boost<br />
economic growth. We fundamentally disagree<br />
with this assertion.<br />
• Kan might feel that there will be a relatively<br />
high fiscal multiplier if the government<br />
increases spending now, at a time when there<br />
are still substantial idle resources, on the<br />
assumption that taxes will be hiked when the<br />
economy is sustainably expanding. But that is<br />
just a case of macro-stabilisation, which can<br />
only temporarily support a falling growth rate.<br />
• There is little evidence that tax money spent<br />
by the government in the name of promoting<br />
growth is effective. In any event, because<br />
Japan’s huge public debt must be repaid some<br />
day, the fiscal multiplier should, from a longterm<br />
perspective, be deemed less than 1.<br />
• While many might support the proposition<br />
that tax hikes to increase government spending<br />
on healthcare and nursing would boost<br />
economic growth, the root problem in<br />
nursing/healthcare in Japan is not the lack of<br />
money but unnecessary regulation that prevents<br />
the provision of services that people want.<br />
• Although talks on tax hikes will probably<br />
stall over the short term now that the<br />
government has lost its Upper House majority,<br />
the Kan government needs to change its<br />
thinking on taxes and growth if history is not to<br />
judge its policies harshly.<br />
Kan’s strange contention<br />
Barely one month has elapsed since the Kan<br />
government was born and its de facto election mode<br />
from the very outset means its policies so far have<br />
just a generalised sense of direction and little<br />
content; this makes a critique all but impossible.<br />
Nevertheless, we comment here on something that<br />
troubles us: Kan’s contention that a tax hike<br />
(specifically the consumption tax) can lead to<br />
economic growth. Is the tax hike meant to repair the<br />
state finances or to reform the nation’s social welfare<br />
systems? Or is it to supply revenue for financing<br />
some other objective (a growth strategy)? Our<br />
apprehension springs from Kan’s vagueness on this<br />
point. If Kan sees a tax hike as a “growth strategy,”<br />
namely as a means of securing revenue to stoke<br />
domestic demand with more government spending,<br />
he is fundamentally mistaken in our view.<br />
Government has the correct three objectives<br />
but…<br />
When the Kan Government was inaugurated, the<br />
prime minister stated that the goal of his government<br />
would be to achieve a “strong economy, robust public<br />
finances and strong social security system”. At that<br />
time, we argued that, because these objectives are<br />
contingent upon each other, their simultaneous<br />
pursuit could indeed be the right path for achieving<br />
the ultimate objective of bettering the economic<br />
welfare of the Japanese people, or, in other words,<br />
achieving a higher level of consumption on the back<br />
of increased and sustainable income growth. We<br />
also warned, however, that focusing just on one<br />
objective, say social security, might lead to a<br />
momentary jump in consumption but the health of the<br />
economy and state finances would suffer because<br />
future generations would have to pay a larger bill.<br />
Admittedly, simultaneously pursuing all three<br />
objectives is easier said than done. But stopping the<br />
potential growth rate from falling, avoiding a debt<br />
crisis and correcting the defects in social security are<br />
all grave structural problems that Japan cannot<br />
ignore. Having long argued for the necessity of<br />
quickly addressing these problems, we lauded the<br />
Kan government for making them top priorities.<br />
Additionally, when the Kan government unveiled its<br />
strategy for fiscal restructuring with the Upper House<br />
election just weeks away, we saw it as both correct<br />
and courageous. The prime minister’s subsequent<br />
comments, however, have been less encouraging,<br />
especially those linking a tax hike with economic<br />
growth – which suggests that he deems the former as<br />
a means of bolstering the latter.<br />
One frequently hears about tax cuts, not hikes,<br />
bolstering economic growth. Indeed, such a view has<br />
long been advocated both in economic circles and by<br />
business. The contention is that cuts in income taxes<br />
boost work incentives, while lower corporate taxes<br />
improve profits ratios and encourage capital<br />
formation, both then translating into some degree of<br />
improvement in the potential growth rate. The basic<br />
argument here is that tax increases and/or heavy tax<br />
burdens stifle economic activity.<br />
Ryutaro Kono 16 July 2010<br />
<strong>Market</strong> Mover<br />
18<br />
www.Global<strong>Market</strong>s.bnpparibas.com
…average fiscal multiplier is 1, at best<br />
Prime Minister Kan did not say that taxes would be<br />
raised so that fiscal consolidation would bolster<br />
economic growth (non-Keynesian effect!). His<br />
assertion is that the government will hike taxes in<br />
order to increase public spending to boost economic<br />
growth. But does such rhetoric really hold up against<br />
logic and experience? First, logic tells us that<br />
economic entities whose income has been<br />
appropriated by the government via higher taxes will<br />
naturally cut back on spending. Assuming the<br />
government does not squander the money<br />
appropriated, the increased spending by the<br />
government will have zero effect (the plus of<br />
government spending will just offset the minus of<br />
reduced spending by the taxed economic entities).<br />
The balanced budget multiplier is 1. In truth, however,<br />
the multiplier is probably lower as the government’s<br />
ability to use tax money more efficiently than the<br />
private sector is questionable.<br />
Advocating more macro-stabilisation?<br />
Now, if the government increases spending at a time<br />
when there are substantial idle resources due to<br />
recession, with the assumption being that taxes will<br />
be hiked when the economy is expanding, the fiscal<br />
multiplier would be higher. This could be what Kan<br />
has in mind. But this is just a case of macrostabilisation,<br />
which can temporarily support a falling<br />
growth rate. Bolstering the potential growth rate is a<br />
different matter completely. The prime minister’s<br />
argument seems to mix up macro-stabilisation and<br />
policies to correct structural defects.<br />
Even if it is macro-stabilisation, there is little evidence<br />
that the tax money spent by the government with the<br />
aim of promoting economic growth is spent<br />
effectively. In any event, because Japan’s huge<br />
public debt must be repaid sometime in the future,<br />
the fiscal multiplier should, from a long-term<br />
perspective, be deemed less than 1. That is why we<br />
are so adamant that, except for emergencies, fiscal<br />
policy should never be used as economic stimulation.<br />
Since Japan’s growth rate is low not just for cyclical<br />
reasons but also because of structural problems,<br />
macro-stabilisation is not the right response. The<br />
lesson from Japan’s experience over the past twenty<br />
years, in our view, is that repeated use of macrostabilisation<br />
depresses the long-term performance of<br />
the economy.<br />
Will spending on social infrastructure bolster<br />
potential growth?<br />
Of course, the potential growth rate can be boosted if<br />
the government supplies the infrastructure that<br />
private economic entities cannot. In cases of market<br />
failure, if the government uses income appropriated<br />
from the private sector via tax hikes to complete<br />
needed social infrastructure, the potential growth rate<br />
can be raised thanks to the resulting improved<br />
convenience and return on capital for the private<br />
sector. But can such public investment projects really<br />
be implemented? Unfortunately, more often than not,<br />
the government errs in selecting projects, with the<br />
result that the authorities’ heavy meddling in the<br />
private sector leads to reduced return on capital for<br />
private economic entities – in turn weighing on the<br />
potential growth rate. There certainly are necessary<br />
public investment projects that are never<br />
implemented, but the reason seems not to be the<br />
lack of money. Consequently, there is no guarantee<br />
that tax hikes would actually translate into the<br />
creation of social infrastructure that bolsters potential<br />
growth.<br />
Will spending on nursing/healthcare yield greater<br />
economic growth?<br />
Rather than government spending in general, let’s<br />
consider the specific case of expenditure on<br />
nursing/healthcare. Most people would probably<br />
support the assertion that “tax hikes to increase<br />
government spending on healthcare and nursing<br />
would boost economic growth”. Since we have long<br />
argued that a big reason why Japanese save rather<br />
than spend is due to anxieties about the future,<br />
linked to Japan’s deficient social welfare systems, we<br />
do not want to reject this proposition outright. But we<br />
have one misgiving. The overriding problem in the<br />
nursing and healthcare sector is not the lack of<br />
money but unnecessary government regulation that<br />
prevents the provision of nursing and healthcare<br />
services that people want. Thus, since the problem is<br />
in the design of these systems, increasing<br />
government spending alone won’t result in the<br />
provision of better services. What is needed is<br />
deregulation. Without it, more government spending<br />
will just waste more money, while also weakening the<br />
nation’s economic welfare.<br />
Problem is unnecessary regulations, not the lack<br />
of resources<br />
Nursing and healthcare will not be growth industries<br />
if they become public services funded by tax money.<br />
Growth industries are born when service providers<br />
appear that supply the services people are willing to<br />
pay for. In the case of nursing/healthcare, only those<br />
actually consuming the service are in a position to<br />
know if they are getting value for money; the<br />
government should not make such decisions. If the<br />
problem is deemed to be insufficient resources and<br />
government spending is increased, as pointed out<br />
earlier, the economic effect will be zero, as the plus<br />
from increased spending in nursing/healthcare will<br />
just offset the minus of reduced spending by the<br />
economic entities that have had income taken away<br />
Ryutaro Kono 16 July 2010<br />
<strong>Market</strong> Mover<br />
19<br />
www.Global<strong>Market</strong>s.bnpparibas.com
through higher taxes. Given the problem of<br />
inefficiency whenever the government gets involved,<br />
the multiplier is surely less than 1. The same holds<br />
for the other sectors that the Kan government has<br />
identified in its growth strategy.<br />
Correct growth strategy is deregulation<br />
We have long been saying that the source of<br />
sustainable growth is the freedom to discover and<br />
innovate. Innovation leads to the goods and services<br />
that people are willing to pay for. At the same time,<br />
the value-added that is thereby created leads to<br />
improved labour productivity and a sustainable<br />
increase in income for the people involved.<br />
The most effective way to encourage innovation is<br />
free economic activity, not the expansion of the<br />
government’s sphere of influence. While there are<br />
areas where government involvement is needed to<br />
address market failure, the authorities should<br />
basically leave the private sector alone. Thus,<br />
deregulation is the most effective growth strategy.<br />
‘Policy failure’ can be more harmful than ‘market<br />
failure’<br />
History has shown that government intervention<br />
aimed at fostering the development of a particular<br />
industry will not only deprive other (growing)<br />
industries of valuable economic resources but it will<br />
also end up removing the ‘sheltered’ industry’s<br />
potential to grow by undermining all incentives to<br />
innovate. When government gives support to a<br />
company, industry or geographical area, it usually<br />
ends up depriving the recipient of its ability to stand<br />
on its own feet. Thus, people who support<br />
government involvement to address cases of market<br />
failure should not forget that ‘policy failure’ can have<br />
more damaging effects.<br />
Kan’s fundamentally flawed assertion<br />
To conclude, the Kan Government has lofty goals of<br />
achieving a “strong economy, robust public finances<br />
and strong social security system”. But if it deems tax<br />
hikes and increased government spending to be the<br />
way to boost economic growth, the nation’s potential<br />
to grow could be further damaged and improving<br />
Japan’s fiscal condition could be further delayed.<br />
With the DPJ having lost an Upper House majority, it<br />
now seems likely that the debate on tax hikes will<br />
slow, making it difficult for discussions on new<br />
spending to even begin (see accompanying article,<br />
Post-Election Outlook for Tax Reform). In any event,<br />
the Kan government should change this way of<br />
thinking to prevent its policies being harshly judged<br />
by history.<br />
Ryutaro Kono 16 July 2010<br />
<strong>Market</strong> Mover<br />
20<br />
www.Global<strong>Market</strong>s.bnpparibas.com
US: 10y Range Trade with a Receiver Fly<br />
• Investors are increasingly comfortable with<br />
the prospect of the 10y rate hovering around<br />
3% in the near term, without a strong<br />
directional trend.<br />
• The range trade lends itself to selling<br />
volatility, but there is a strong preference to<br />
limit the downside in any trade.<br />
Chart 1: 10y Swap <strong>Rate</strong> and the Breakeven<br />
Levels of the 3m10y Swaption Fly<br />
4.5<br />
4<br />
3.5<br />
• STRATEGY: Buy a 3m10y receiver fly,<br />
struck ATMF+15bp, ATMF-10bp, ATMF-35bp.<br />
The maximum payout ratio is 3.6:1.<br />
3<br />
2.5<br />
Breakeven levels<br />
2<br />
With the economic reports showing a slowdown in<br />
the pace of recovery lately, there is a broader<br />
acceptance of the spectre of low rates not just in<br />
terms of monetary policy but also in terms of term<br />
rates. With the risk of ever lower inflation down the<br />
road, it appears rather unlikely that rates will spike<br />
higher in the next few months. Nor is there much<br />
chance of a strong rally from current levels absent a<br />
flight-to-quality event, as investors find it difficult to<br />
stomach a sub-3% rate on 10s and sub-4% on 30s –<br />
after all, the deflationary mindset is slow to seep into<br />
the collective consciousness. This backdrop bodes<br />
well for range trades, and as an extension, for selling<br />
volatility.<br />
Being cognisant of the strong preference investors<br />
have for trades with a well-defined downside, we<br />
analyse swaption butterflies (rather than selling<br />
strangles, or 1x2 trades) to express the range-trading<br />
view. The idea is to buy a butterfly that brackets the<br />
most recent range of the underlying rate. Scouring<br />
the field for a good combination, we find that the 10y<br />
tail offers a good opportunity, especially with 3m and<br />
6m expiries. While the premise is the same and the<br />
6m trades have a higher expiry payout ratio, the 3m<br />
version is preferable in our opinion, thanks to the<br />
speed at which the payout can be realised over the<br />
next three months. More specifically, we recommend<br />
buying the ATMF+15bp, ATMF-10bp and ATMF-<br />
35bp 3m10y receiver fly (the centre leg, ATMF-10bp,<br />
is chosen to match 10y spot to mitigate any<br />
directional bias in the trade).<br />
Chart 1 shows the recent range of the 10y swap rate.<br />
The breakeven levels of the butterfly trade, also<br />
shown on the same chart, cover the range that had<br />
prevailed since the downward adjustment of the<br />
prognosis for US economic growth and inflation,<br />
along with rate hike expectations, began in June. It is<br />
clear from the chart that the upper breakeven level<br />
7/15/09<br />
8/15/09<br />
9/15/09<br />
Source: <strong>BNP</strong> Paribas<br />
10/15/09<br />
11/15/09<br />
12/15/09<br />
Chart 2: Performance of the Fly over Different<br />
Horizons (in bp)<br />
200<br />
150<br />
100<br />
50<br />
0<br />
-50<br />
-100<br />
sits at the bottom of the rate range before that<br />
change in outlook. More to the point, that level acted<br />
as a floor for rates when the economy was perceived<br />
as recovering handsomely. Given that the 10y rate<br />
has broken that support level and seems to have<br />
settled into a lower range, it is conceivable that it will<br />
break back up to the upside unless the macro picture<br />
changes materially.<br />
Chart 2 shows the PnL of the trade over different<br />
horizons, expressed in bp. At inception the cost of<br />
the structure is 48bp. For reference, at expiry the<br />
trade can generate about 171bp of profit, which<br />
translates to a 3.6:1 payout ratio.<br />
1/15/10<br />
-30 -20 -10 0 10 20 30<br />
Source: <strong>BNP</strong> Paribas<br />
2/15/10<br />
3/15/10<br />
4/15/10<br />
now<br />
2m<br />
5/15/10<br />
1m<br />
6/15/10<br />
expiry<br />
Bulent Baygun 16 July 2010<br />
<strong>Market</strong> Mover, Non-Objective Research Section<br />
21<br />
www.Global<strong>Market</strong>s.bnpparibas.com
US: TSY Switches for Yield/Duration Pick-Up<br />
• Many are envisioning a range-trading<br />
summer, setting the market up for a yield-grab<br />
as investors look to extend duration. We focus<br />
on specific switches that have cheapened<br />
recently.<br />
• A Z-score approach to ASWs helps identify<br />
RV opportunities between neighbouring Tsy<br />
issues in various sectors of the curve.<br />
• STRATEGY: Look to switch between<br />
relatively rich and cheap issues (or consider<br />
RV spread trades) as per the recommendations<br />
below.<br />
`<br />
We first examine 30, 60, and 90 day asset swap<br />
spread Z-scores, which represent the number of<br />
standard deviations from the mean. Rather than<br />
drawing broad conclusions about a particular sector’s<br />
rich/cheapness, we look for relative rich/cheapness<br />
between neighbouring issues. We also keep in mind<br />
that the goal is to generally extend duration and seek<br />
yield pick-up (although this isn’t always the case),<br />
while also limiting the directional/curve exposure.<br />
The resulting trades are spread across the maturity<br />
spectrum, as shown in Table 1. None of the issues<br />
listed in the Table appear to be trading special in<br />
repo, which would have partially explained their<br />
richness.<br />
4.375% Aug-12s vs 4.125% Aug-12s (Chart 1)<br />
This is a switch from an old 10yr to an old 5yr note,<br />
and with 15 days of curve. We estimate the fair value<br />
of the curve to be around 1.5bp in this sector, making<br />
the yield pick-up of 4.5bp look compelling (the Z-<br />
score methodology suggests this is 2.8bp too high).<br />
Chart 1 shows that the spread is also near the top<br />
end of its range.<br />
2.5% Mar-13s vs 1.75% Apr-13s (Chart 2)<br />
This is a switch from an old 5yr to an old 3yr note,<br />
and with 15 days of curve. Again we estimate the fair<br />
value of the curve to be around 1.5bp in this sector,<br />
and the yield pick-up of around 10bp is the highest<br />
amongst the various switches we show (although in<br />
this case there is no duration pick-up). Chart 2 shows<br />
that the spread is also near the top end of its range.<br />
Table 1: Selection of Switches That Look<br />
Attractive on Z-Score<br />
Rich Issue Relative To<br />
90d Z-Score<br />
Spread<br />
BP<br />
Cheapness<br />
Duration<br />
Pickup<br />
Yield<br />
Pickup<br />
4.375 08/15/12 4.125 08/31/12 0.3 2.8 0.04 4.5<br />
2.5 03/31/13 1.75 04/15/13 0.4 3.0 0.00 10.2<br />
3.25 05/31/16 5.125 05/15/16 0.7 3.2 0.29 -3.9<br />
2.75 02/15/19 3.125 05/15/19 0.9 2.2 0.27 7.1<br />
7.875 02/15/21 8.125 05/15/21 0.4 0.8 0.34 4.2<br />
Source: <strong>BNP</strong> Paribas<br />
7<br />
6<br />
5<br />
4<br />
3<br />
2<br />
1<br />
0<br />
-1<br />
Chart 1: 4.375% Aug-12s vs 4.125% Aug-12s<br />
-2<br />
-4<br />
Jul-09 Oct-09 Jan-10 Apr-10 Aug-10<br />
Source: <strong>BNP</strong> Paribas<br />
12<br />
11<br />
10<br />
9<br />
8<br />
7<br />
6<br />
Yield Spread<br />
Chart 2: 2.5% Mar-13s vs 1.75% Apr-13s<br />
5<br />
Apr-10 May-10 Jun-10 Jul-10<br />
Source: <strong>BNP</strong> Paribas<br />
ASW Diff (RHS)<br />
Yield Spread<br />
ASW Diff (RHS)<br />
5<br />
4<br />
3<br />
2<br />
1<br />
0<br />
-1<br />
-2<br />
-3<br />
11<br />
10<br />
9<br />
8<br />
7<br />
6<br />
5<br />
4<br />
3<br />
2<br />
3.25% May-16s vs 5.125% May-16s (Chart 3)<br />
In this case we are shortening the maturity by 15<br />
days, although there is still a duration pick-up.<br />
Instead of moving to a higher yield there is actually a<br />
Suvrat Prakash 16 July 2010<br />
<strong>Market</strong> Mover, Non-Objective Research Section<br />
22<br />
www.Global<strong>Market</strong>s.bnpparibas.com
give-up because we’re switching from an old 7yr to<br />
an old 10yr which will tend to trade richer. However<br />
as Chart 3 shows, the old 10yr has almost always<br />
traded richer than the current 4bp, and two months<br />
ago traded as rich as 10bp. (Z-score methodology<br />
suggests the spread should be 3.2bp lower)<br />
2.75% Feb-19s vs 3.125% May-19s (Chart 4)<br />
This switch is amongst the more liquid issues, since<br />
both are fairly recent 10y notes. In Chart 4 it looks as<br />
if this spread has gradually grinded higher so the<br />
mean-reversion qualities may not be as compelling<br />
(although Z-scores suggest the pick-up should be<br />
closer to 5bp than the current 7bp). Still, the current<br />
shape of the yield curve does not suggest that the<br />
spread could roll any higher, since the spread<br />
between older 10yr notes is fairly constant at 7bp.<br />
Chart 3: 3.25% May-16s vs 5.125% May-16s<br />
0<br />
1<br />
0<br />
-2<br />
-1<br />
-4<br />
-2<br />
-3<br />
-6<br />
-4<br />
-8<br />
-5<br />
-10 Yield Spread<br />
-6<br />
ASW Diff (RHS)<br />
-7<br />
-12<br />
-8<br />
Jul-09 Oct-09 Jan-10 Apr-10 Aug-10<br />
Source: <strong>BNP</strong> Paribas<br />
7.875% Feb-21s vs 8.125% May-21s (Chart 5)<br />
In the sector of old bonds, there is a fairly steep<br />
rolldown as old 30yrs roll into the 10y sector. This<br />
makes it attractive to extend maturity for those<br />
holding issues in the 10-11y sector. Chart 5 shows<br />
that the pick-up has risen to the top end of its range<br />
recently, and the current spread of 4bp appears to be<br />
rolling flat when compared to shorter-maturity old<br />
bonds.<br />
8<br />
7<br />
6<br />
5<br />
4<br />
3<br />
2<br />
1<br />
Chart 4: 2.75% Feb-19s vs 3.125% May-19s<br />
Yield Spread<br />
ASW Diff (RHS)<br />
6<br />
5<br />
4<br />
3<br />
2<br />
1<br />
0<br />
0<br />
-1<br />
-1<br />
-2<br />
-2<br />
-3<br />
Jul-09 Oct-09 Jan-10 Apr-10 Aug-10<br />
Source: <strong>BNP</strong> Paribas<br />
Chart 5: 7.875% Feb-21s vs 8.125% May-21s<br />
5<br />
5<br />
4<br />
4<br />
3<br />
3<br />
2<br />
2<br />
1<br />
Yield Spread<br />
1<br />
ASW Diff (RHS)<br />
0<br />
0<br />
Jul-09 Oct-09 Jan-10 Apr-10 Aug-10<br />
Source: <strong>BNP</strong> Paribas<br />
Suvrat Prakash 16 July 2010<br />
<strong>Market</strong> Mover, Non-Objective Research Section<br />
23<br />
www.Global<strong>Market</strong>s.bnpparibas.com
US: Corporate Issuance and Swap Spreads<br />
• Summer doldrums: USD high grade<br />
corporate bond issuance tends to be lowest in<br />
the months of July and August, averaging USD<br />
48bn (5.6%) and USD 58bn (6.7% of total<br />
issuance for the year), respectively, over the<br />
past five years (Chart 3). Despite predictions<br />
by some analysts of an increase in corporate<br />
issuance for the summer of 2010, July<br />
issuance so far is right on trend at USD 33<br />
billion, and will likely slow through the<br />
remainder of the month as US earnings season<br />
enters high gear.<br />
• Distortions in 2008 and 2009: Corporate<br />
issuance trends in 2008 and 2009 were deeply<br />
affected by (a) the burgeoning economic crisis,<br />
peaking with the failure of Lehman in Sept<br />
2008, which practically shut out financials from<br />
the market for a time; and (b) a huge rebound<br />
in issuance due to both FDIC guarantees<br />
(Chart 3) and a surge in Yankee bonds (Chart<br />
1) as a favourable move in the cross currency<br />
basis made the US markets more attractive.<br />
• 2010 trends: On a cumulative basis, 2010<br />
high grade corporate issuance appears in line<br />
with 2006 and 2007 (Chart 2). On a sector<br />
basis, Yankee bonds have dominated issuance<br />
YTD (Chart 1), having surged in January-April,<br />
while US financial issuance appears to be<br />
lagging. We expect a moderate pick-up in<br />
issuance as blackouts due to earnings season<br />
and summer wane. However, impending<br />
changes in debt and capital composition due<br />
to financial reform combined with only USD 34<br />
billion of USD 330 billion outstanding of FDIC<br />
guaranteed debt maturing through year-end<br />
may restrain offerings from the financials. We<br />
expect total high grade issuance for 2010 may<br />
hover around USD 850 billion.<br />
• STRATEGY: Expect swap spreads to be<br />
pressured tighter as issuance increases<br />
through the fall. Although corporate supply is<br />
typically a second-order effect on spreads,<br />
there has been a diminished influence of<br />
mortgage hedging and the slope of the yield<br />
curve in the current environment. This opens<br />
the door to corporate issuance possibly having<br />
an outsize effect.<br />
Swap spread regression models<br />
There is a rich and evolving academic literature on<br />
what drives swap spreads. Standard models are<br />
typically multivariate linear regressions which assess<br />
Chart 1: High Grade Corp Issuance (by sector)<br />
Amount (blns)<br />
1,400<br />
1,200<br />
1,000<br />
800<br />
600<br />
400<br />
200<br />
0<br />
163<br />
287<br />
86<br />
Yankees<br />
Financials<br />
Utilities<br />
Industrials<br />
238<br />
364<br />
248 242<br />
416 400<br />
166 199 205<br />
the correlations between swap spreads and the<br />
following known empirical driving factors (roughly in<br />
order of importance in the pre-crisis environment):<br />
• the slope of the yield curve and the level of rates;<br />
• the refinancability of the mortgage market (to<br />
capture the influence of mortgage hedging,<br />
understanding that this factor is of course correlated to<br />
the first two);<br />
• liquidity premium;<br />
• Treasury supply; and<br />
• corporate debt issuance (where fixed-rate debt is<br />
often rate-locked ahead of issuance and then<br />
swapped back to floating, resulting in a tightening bias<br />
on spreads).<br />
Technical note: most swap spread models are run on<br />
spreads only up to the 10-year. The 30-year swap<br />
spread across currencies has long been<br />
acknowledged as something of an anomaly, with a<br />
dominant factor being the hedging needs of exotics<br />
options desks and therefore volatility. It has only been<br />
with the recent use of the swap spread multifactor<br />
541<br />
375<br />
274<br />
270<br />
94<br />
87<br />
2005 2006 2007 2008 2009 YTD 2010<br />
Source: Informa Global <strong>Market</strong>s, <strong>BNP</strong> Paribas<br />
Chart 2: Corp Issuance (cumulative by year)<br />
Amount (in billions)<br />
1,400<br />
1,200<br />
1,000<br />
800<br />
600<br />
400<br />
200<br />
-<br />
2005<br />
2006<br />
2007<br />
2008<br />
2009<br />
2010<br />
~195b (16%) of<br />
2009 iss FDIC gtd<br />
JAN FEB MA R APR MAY JUN JUL AUG SEP OCT NOV DEC<br />
Source: Informa Global <strong>Market</strong>s, <strong>BNP</strong> Paribas<br />
Mary Beth Fisher 16 July 2010<br />
<strong>Market</strong> Mover, Non-Objective Research Section<br />
24<br />
www.Global<strong>Market</strong>s.bnpparibas.com
term structure models mentioned below that 30-year<br />
spread dynamics have been incorporated with some<br />
success into the standard framework.<br />
One of the drawbacks to linear regression models is<br />
that they can’t capture any tendency for the influence<br />
of the factors to vary over time or operate across<br />
different horizons. For example, the effect of corporate<br />
issuance on swap spreads acts as a rather short-term<br />
effect – e.g. the swapping of a fixed rate issue to<br />
floating exerts tightening pressure on spreads on the<br />
day the issue is swapped. Corporate issuance also<br />
tends to exhibit seasonal patterns, as evidenced in<br />
Chart 3. A pick-up in Treasury supply tends to be a<br />
more fundamental economic signal, and its “normal”<br />
tightening bias on swap spreads has been shown to<br />
act over longer periods of time.<br />
Of course the current economic environment has<br />
turned many of these “normal” factors on their heads.<br />
The enormous amount of Treasury supply hasn’t<br />
appeared to exert much pressure on front end<br />
spreads, and the impact of convexity hedging of<br />
mortgage portfolios – which used to be a dominant<br />
factor correlating 5y and 10y swap spreads to the level<br />
of rates – has dropped off dramatically.<br />
Swap spread term structure models<br />
These changes in the economic environment and<br />
clear alterations in the strength of various correlations<br />
have increased the use of full blown term structure<br />
models to analyse the term structure of swap spreads.<br />
These stochastic models attempt to capture the<br />
variability of economic factors, curve and volatilities on<br />
swap spreads over time.<br />
An excellent example of this approach is detailed in<br />
the December 2008 paper, “Modeling Swap Spreads<br />
in Normal and Stressed Environments”, by Vineer<br />
Bhansali, Yonathan Schwarzkopf and Mark Wise.<br />
Although a complete synopsis of this paper and their<br />
approach is beyond the scope of this article, it is worth<br />
repeating several of the conclusions.<br />
“...a robust model of swap spreads... should capture the key factors<br />
we know that describe the movement of swap spreads. These<br />
factors include the level and shape of the sovereign yield curves, the<br />
relative supply of risky to riskless debt, the activity of mortgage<br />
hedgers (convexity hedging), and the movements in credit spreads.<br />
(pg 2)<br />
It has been shown that one of the drivers of the swap spread is the<br />
slope of the yield curve. [The] value of the 10 year swap spread was<br />
regressed versus the yield curve slope for data spanning January<br />
1997 to August 2003. As the slope of the yield curve the author used<br />
the difference between the 10 year and 2 year rates and the linear<br />
regression coefficient was calculated to be −0.19. The negative<br />
value of the coefficient implies that the swap spread tightens as the<br />
curve steepens. This coincides with the intuition that as the yield<br />
curve steepens market players prefer to be the fixed-rate receiver in<br />
a swap and commercial banks will be less inclined to hedge their<br />
short term variable rate deposits reducing the demand to be a fixed<br />
rate payer. This will reduce the demand for swaps and as a result<br />
will decrease the swap rates and tighten the spread...<br />
<strong>Interest</strong>ingly, the negative dependence of the swap spread on the<br />
slope of the yield curve breaks down around the summer of 2007...<br />
Starting at around June 2007 the swap spread widens as the slope<br />
of the yield curve steepens. ... This behavior seems to be associated<br />
with a breaking of the usual dependence of the swap spread on the<br />
slope of the yield curve.”<br />
Corporate issuance and swap spreads<br />
As the paper points out and the markets have<br />
experienced, swap spreads traversed a period, and<br />
may still be in it, where the slope of the curve is not a<br />
dominant driver. Our experience over the past year,<br />
since the paper was published, also points to the<br />
diminishing effect of mortgage hedging activity and<br />
Treasury supply on spreads.<br />
So what’s left? Clearly the liquidity premium – which in<br />
some sense can become a “catch all” factor – appears<br />
to be dominating front end spread dynamics.<br />
Historically corporate issuance was a second-order<br />
influence on spreads. Now that corporate issuance<br />
patterns appear to be normalizing somewhat from the<br />
event-driven patterns of 2008 and 2009, it’s possible<br />
that the supply of risky debt may become more<br />
influential on spreads.<br />
Although we expect only a moderate pick-up in high<br />
grade issuance as we exit the summer doldrums, we<br />
think this might have a more concentrated than normal<br />
tightening effect on swap spreads – particularly in the<br />
front end – given the absence of influence from the<br />
other “normal” drivers.<br />
Chart 3: US High Grade Corporate Issuance (monthly, since 2005)<br />
Amount (in billions)<br />
180<br />
160<br />
140<br />
120<br />
100<br />
80<br />
60<br />
~30% in Jan09 FDIC gtd<br />
~20% FDIC gtd<br />
~36% FDIC gtd<br />
2005<br />
2006<br />
2007<br />
2008<br />
2009<br />
2010<br />
Lehman failed Sept 08<br />
~100b (86%) of Dec 08<br />
issuance w as FDIC guaranteed<br />
40<br />
20<br />
-<br />
JAN FEB MAR APR MAY JUN JUL AUG SEP OCT NOV DEC<br />
Source: Informa Global <strong>Market</strong>s, FDIC, <strong>BNP</strong> Paribas<br />
Mary Beth Fisher 16 July 2010<br />
<strong>Market</strong> Mover, Non-Objective Research Section<br />
25<br />
www.Global<strong>Market</strong>s.bnpparibas.com
MBS: Higher Coupons Could Speed Up Later<br />
• Refi risk in current coupon mortgages<br />
could cause them to trade to shorter empirical<br />
durations. Due to this factor, we maintain a<br />
neutral outlook on mortgages.<br />
• Higher coupon prepays could pick up over<br />
coming months as the credit impaired nature<br />
of such borrowers might have delayed<br />
processing.<br />
80%<br />
70%<br />
60%<br />
50%<br />
40%<br />
Chart 1: Empirical Durations<br />
4.0s Empr 4.0s Trader 4.5s Empr 4.5s Trader<br />
5.0s Empr 5.0s Trader 5.5s Empr 5.5s Trader<br />
30%<br />
20%<br />
As shown in Chart 1, mortgages had been trading to<br />
longer durations (empirical) through June, when the<br />
market rallied but recently these durations have<br />
declined. As the low-yield scenario persisted in June,<br />
the demand for incremental yield intensified, helping<br />
mortgage spreads to tighten in the rally, leading to<br />
longer durations. Another way of looking at this is<br />
that, since the market trend was mostly a one-way<br />
rally train in June and prepayments were expected to<br />
be low, mortgages were trading with positive<br />
convexity.<br />
In the selloff that came after (preceding the most<br />
recent rally), empirical durations started coming off.<br />
Wednesday’s rally however led mortgages to widen,<br />
continuing the declining duration trend despite a rally.<br />
We think that for lower coupons, the refi risk,<br />
especially in the 08 and also 09 vintages is<br />
considerable as demonstrated in the recent prepay<br />
report, and may be contributing to this trend; indeed,<br />
it may have been a game changer. Note how as we<br />
go up in coupon the empirical durations seem to be<br />
ticking up.<br />
We expect the continued market sentiment of a<br />
slower economic recovery to push yields lower. This<br />
could increase demand for incremental yield, helping<br />
mortgage spreads to tighten. But the sceptre of<br />
higher prepays in current coupons makes us neutral<br />
on the basis, and we may consider selling mortgages<br />
on strength, should they tighten considerably in a<br />
rally.<br />
Even after the mortgage primary rate reached<br />
another all time low last week, the refi index actually<br />
declined. Borrowers are clearly not getting the full<br />
benefit of low rates. But the newer lower coupons<br />
that define the current coupon mortgage basis as<br />
such are callable, even though the mortgage<br />
universe as a whole may not be all that much<br />
callable. It is from the basis perspective that we<br />
10%<br />
0%<br />
2-Apr-10 23-Apr-10 14-May-10 4-Jun-10 25-Jun-10<br />
Source: <strong>BNP</strong> Paribas<br />
ZV OAS<br />
Chart 2: Current Coupon OAS and ZV OAS<br />
85<br />
80<br />
75<br />
70<br />
65<br />
60<br />
55<br />
50<br />
03-May-10 24-May-10 14-Jun-10 05-Jul-10<br />
Source: Yield Book<br />
ZV OAS<br />
OAS<br />
expect 4s and 4.5s to trade to shorter durations in a<br />
rally.<br />
Since MBSPP proceeds are not reinvested,<br />
increased prepays increase the net supply to the<br />
market, which is negative for mortgages. Otherwise,<br />
the Fed put to bed any imminent expectations of<br />
MBS sales in its latest minutes and re-iterated that<br />
monetary tightening will take place first before assets<br />
sales begin. The Fed also left the door open to more<br />
accommodative policy if the economy gets worse,<br />
but extending mortgage purchases is only a<br />
probability at this point. Overall, these factors also<br />
favour a neutral outlook.<br />
Along the coupon stack we continue to like 5 and<br />
5.5s, which have not completely recovered from the<br />
levels before the Fed started its coupon swap<br />
activities. As we have mentioned in the past, the Fed<br />
was selling rolls so as to not force dealers to deliver.<br />
However, system-wide fails had persisted despite the<br />
selling of rolls, and should continue despite coupon<br />
16<br />
14<br />
12<br />
10<br />
8<br />
6<br />
4<br />
2<br />
0<br />
-2<br />
-4<br />
OAS<br />
Anish Lohokare/Olurotimi Ajibola 16 July 2010<br />
<strong>Market</strong> Mover, Non-Objective Research Section<br />
26<br />
www.Global<strong>Market</strong>s.bnpparibas.com
swaps. The overall volume of USD 9.2 bn was small<br />
compared to the system-wide fails. Granted, a chain of<br />
fails can show up as an artificially high number but the<br />
magnitudes are clearly a multiple. While convexity is a<br />
concern in these coupons, the limited response to lower<br />
rates and the reduced float will only serve to exacerbate<br />
the squeeze in the coupons.<br />
Could refi's on higher coupons pick up in coming<br />
months?<br />
In a pre-prepay note, we had discussed that banks<br />
may have processed applications quicker in June to<br />
save capital by converting loans to MBS. This may<br />
have caused elevated June supply, possibly causing<br />
prepays to come in higher than expected (June<br />
borrowing prepays from July). Prepays on lower<br />
coupons did come in faster than expected but those<br />
on higher coupons didn’t. However, if banks did<br />
indeed process applications quicker, those with<br />
cleaner credit would have likely been processed<br />
more easily. This may explain the sharp discrepancy<br />
in prepays in the coupon stack.<br />
In fact based purely on the relationship between the<br />
refi index and prepays (adjusted for business days),<br />
it appears that the lag between prepays and the refi<br />
index was shorter than the typical 45 days (Chart 3).<br />
This could have essentially been magnified in lower<br />
coupons at the expense of higher coupons.<br />
In Figure 4, we show how prepays ramped in late<br />
2008-early 2009. It shows that higher coupons took<br />
more time in ramping up than lower coupons. Chart 5<br />
shows that the acceleration of CPR for the 6.5%<br />
coupon is lagging the 5%, 5.5% and 6% coupons<br />
during the December 2008 spike. The best way to<br />
compare it is to use the following calculation:<br />
CPR_month_(t-1) – 2 x CPR_month_(t) +<br />
CPR_month_(t+1). As clearly shown in the table, the<br />
acceleration of CPR for 6.5% coupon is much lower<br />
in the month of December and it is the only positive<br />
one in January.<br />
Chart 3: 4-Week Moving Average Change in Refi<br />
Index for Different Lag Periods<br />
Refi Index( Chg)<br />
80%<br />
60%<br />
40%<br />
20%<br />
0%<br />
-20%<br />
-40%<br />
-60%<br />
Feb-09 May-09 Aug-09 Nov-09 Feb-10 May-10<br />
Source: Bloomberg, <strong>BNP</strong> Paribas<br />
45 Day Lag 4 Week Average<br />
30 Day Lag 4 Week Average<br />
Chart 4: Prepayment Speeds by Coupon<br />
CPRs<br />
40<br />
35<br />
30<br />
25<br />
20<br />
15<br />
10<br />
5<br />
0<br />
Nov-<br />
08<br />
Dec-<br />
08<br />
Source: eMBS, <strong>BNP</strong> Paribas<br />
Jan-<br />
09<br />
Feb-<br />
09<br />
Mar-<br />
09<br />
Apr-<br />
09<br />
May-<br />
09<br />
5<br />
5.5<br />
6<br />
6.5<br />
Jun-<br />
09<br />
Chart 5: Acceleration of Prepayment Speeds by<br />
Coupon (CPR_month_(t-1) – 2 x CPR_month_(t)<br />
+ CPR_month_(t+1))<br />
Coupon Feb-09 Jan-09 Dec-08<br />
5.0 -8.7 -4.6 8.9<br />
5.5 -9.9 -6.6 10<br />
6.0 -6.8 -4.1 6.3<br />
6.5 -7.6 2.8 3.8<br />
Source: eMBS, <strong>BNP</strong> Paribas<br />
This effect may be particularly magnified this time<br />
around, given that the GSEs seem to be pursuing<br />
reps and warrants, including the repurchase of loans<br />
not underwritten to their standards. Prepays on<br />
higher coupons may thus surprise to the upside over<br />
the coming months. Also note that negative<br />
seasonals come into play for delinquencies, a fact<br />
reflected better in the FG delinquency numbers last<br />
month.<br />
Anish Lohokare/Olurotimi Ajibola 16 July 2010<br />
<strong>Market</strong> Mover, Non-Objective Research Section<br />
27<br />
www.Global<strong>Market</strong>s.bnpparibas.com
EUR: Eonias to Push Up Further<br />
• Excess liquidity continues to fall. Along with<br />
less demand at the ECB’s liquidity providing<br />
operations, this is pushing eonias up.<br />
Chart 1: Liquidity Provided Started to Decline<br />
• Figures at the early stage of the current<br />
reserve period highlight further tensions ahead<br />
on eonias.<br />
• STRATEGY: Keep paying interest on eonias<br />
for the November and December ECB meetings.<br />
Liquidity continues to decline<br />
The expiry of the 1y tender had reduced liquidity<br />
provided by open market operations by around EUR<br />
200bn, from more than EUR 900bn to just above<br />
EUR 700bn. This was enough to trigger limited<br />
upward pressures on eonias. But liquidity has<br />
continued to fall. Demand at last week’s MRO was<br />
EUR 45bn below the total maturing. Demand this<br />
week fell again, with EUR 195.7bn allotted for EUR<br />
229bn expiring. The rise in demand at the 28day<br />
tender (up EUR 17.6bn) did not offset the EUR<br />
33.4bn drop at the MRO. As a result, liquidity<br />
provided by open market operations declined further<br />
and now stands at EUR 620.5bn, slightly more than<br />
EUR 50bn above average needs for the current<br />
reserve maintenance period. This is particularly low,<br />
especially at the early stage of the reserve period.<br />
Indeed, reserve requirements (EUR 214.3bn for the<br />
current reserve maintenance period from 14 July to<br />
10 August) are calculated as an average during the<br />
period. Usually, banks put significantly more in their<br />
current accounts at the ECB than this average at the<br />
start of the period, in order to be ahead of the<br />
required level. This allows banks to lower the level of<br />
reserves gradually during the period and therefore<br />
avoid the risk of having to find cash at the end of the<br />
period, which would fuel severe upward pressures on<br />
rates. For many months, liquidity was ample enough<br />
to allow banks to put more than EUR 100bn in<br />
excess reserves at the start of the period while<br />
keeping excess liquidity above EUR 100bn in the<br />
market. In that context, eonias were stuck to lows<br />
and immune from any upward pressures.<br />
Eonias to rise further<br />
As liquidity is now only EUR 50bn above needs,<br />
banks are unable to put significantly more than<br />
required in their current accounts. According to the<br />
ECB, current account holdings were at EUR 240bn<br />
the first day of the period, i.e. EUR 26bn above the<br />
average level. Such level of excess reserves is quite<br />
low compared to the levels seen for many months<br />
Source: <strong>BNP</strong> Paribas<br />
Chart 2: Eonias are Pushing Closer to the Refi<br />
Source: <strong>BNP</strong> Paribas<br />
(above EUR 100bn). And this reduces the available<br />
excess liquidity in the market to below EUR 25bn. At<br />
this level, it is impossible to see eonia easing to the<br />
levels prevailing at the start of recent reserve<br />
periods. The 0.444% for the first day is 10bp above<br />
the level the same day of the previous period.<br />
Moreover, the situation is far from being<br />
homogeneous. It is clear that fewer banks have stillcomfortable<br />
levels of excess liquidity and are putting<br />
far more than required in their accounts, while an<br />
increasing number of banks are probably short of<br />
cash. This means that tensions on eonias will not<br />
ease during the current period, and could even gain<br />
momentum: the upward trend for eonias is now<br />
established. This is far from being priced in by<br />
forwards for the end of the year, with ECB November<br />
and December meetings at 0.70% and 0.73%<br />
respectively.<br />
<strong>Strategy</strong>: Keep paying interest on eonias for the<br />
November and December ECB meetings.<br />
Patrick Jacq 16 July 2010<br />
<strong>Market</strong> Mover, Non-Objective Research Section<br />
28<br />
www.Global<strong>Market</strong>s.bnpparibas.com
EUR: Deflation Macro Hedge Via Options<br />
• The probability of a Japan-style collapse in<br />
forward rates and the term structure has<br />
increased in line with a 75bp drop in 5Y5Y since<br />
the start of this year.<br />
• STRATEGY: Buy 2.9%-2.0% 5Y5Y receiver<br />
spreads at zero cost and positive carry.<br />
The process of adjustment towards a lower<br />
equilibrium long-term rate has been ongoing since<br />
the start of this year. We have made the case for<br />
lower 5Y5Y rates in a series of research notes (e.g.<br />
“EUR: Long-Term Equilibrium <strong>Rate</strong>s”, 5 March, and<br />
“EUR: Equilibrium <strong>Rate</strong>s Revisited”, 4 June). Here,<br />
we provide ways to play this theme with controlled<br />
downside risk.<br />
Since the start of this year, EUR 5Y5Y has declined<br />
by 75bp, reflecting a combination of rallying Bunds<br />
and flatter term structure. Outright bullish strategies<br />
such as 2.50% 5Y5Y receivers have performed very<br />
well on the back of this underlying dynamic (+75%).<br />
The main argument for such a strategy is based on<br />
long-term fundamental projections (Table 1). Our<br />
macro scenario implies another 50-55bp of decline in<br />
5Y5Y rates (based on long-term average growth,<br />
inflation and term premium). However, if we<br />
substitute our forecast with realised inflation and<br />
growth in Japan from the 1992-2002 sample, the<br />
argument for receiving 5Y5Y rates is even more<br />
compelling, as the equilibrium rate declines to around<br />
1.4%. Note that JPY 5Y5Y ended 2002 at around<br />
1.5%.<br />
Chart 1: ECB and Long-Term <strong>Rate</strong>s<br />
4.50<br />
5.50<br />
4.00<br />
ECB (LHS)<br />
EUR 5Y5Y<br />
5.25<br />
3.50<br />
5.00<br />
3.00<br />
4.75<br />
2.50<br />
4.50<br />
2.00<br />
4.25<br />
1.50<br />
1.00<br />
4.00<br />
0.50<br />
3.75<br />
0.00<br />
3.50<br />
2003 2004 2005 2006 2007 2008 2009 2010<br />
Source: <strong>BNP</strong> Paribas<br />
Table 1: Estimating Equilibrium <strong>Rate</strong>s<br />
Equilibrium <strong>Rate</strong>s - <strong>BNP</strong> Paribas Scenario<br />
2010 2011 2012 2013 2014 2015 2016 2017 2018 2019 Average<br />
GDP 1.2 0.6 1.0 2.2 1.0 1.5 1.5 1.5 1.2 1.2 1.3<br />
CPI 1.6 1.4 0.7 1.8 1.5 1.5 1.5 1.5 1.5 1.5 1.5<br />
Term premium 0.5 0.5 0.5 0.5 0.5 0.5 0.5 0.5 0.5 0.5 0.5<br />
Long term rate equilibrium 3.24<br />
EUR 5Y5Y live 3.83<br />
Equilibrium <strong>Rate</strong>s - Japan 1992-2002 Scenario<br />
2010 2011 2012 2013 2014 2015 2016 2017 2018 2019 Average<br />
GDP 0.3 0.1 2.4 3.2 -0.3 -1.5 -0.2 2.6 -1.6 1.7 0.7<br />
CPI 1.0 0.7 -0.3 0.6 1.8 0.6 -1.1 -0.1 -1.1 -0.3 0.2<br />
Term premium 0.5 0.5 0.5 0.5 0.5 0.5 0.5 0.5 0.5 0.5 0.5<br />
Long term rate equilibrium 1.35<br />
EUR 5Y5Y live 3.83<br />
JPY 5Y5Y End 2002 1.50<br />
Source: <strong>BNP</strong> Paribas<br />
Chart 2: EUR 5Y5Y volatility<br />
90.0<br />
0.50<br />
EUR 5Y5Y ATM normal vol<br />
85.0 EUR 5Y5Y SABR Alpha (RHS)<br />
0.45<br />
80.0<br />
0.40<br />
<strong>Strategy</strong>: We propose two investment ideas based<br />
on the same underlying philosophy, i.e. a controlled<br />
downside macro deflation hedge:<br />
75.0<br />
70.0<br />
65.0<br />
0.35<br />
0.30<br />
0.25<br />
1) Buy EUR 5Y5Y 3.00% – 2.00% 1x1 receiver<br />
spread at the cost of 80 cents. Buying<br />
outright receivers is quite expensive due to<br />
the strong performance of 5Y5Y forwards.<br />
Also, the still-elevated level of ATMF vol and<br />
alpha (vol of vol) makes outright solutions<br />
relatively expensive (Chart 2).<br />
60.0<br />
0.20<br />
55.0<br />
0.15<br />
50.0<br />
0.10<br />
2003 2004 2005 2006 2007 2008 2009 2010<br />
Source: <strong>BNP</strong> Paribas<br />
2) Buy EUR 5Y5Y 2.90% – 2.00% 1x2 receiver<br />
spread at zero cost. <strong>Strategy</strong> delivers<br />
negative P&L only below 1.1% at expiry.<br />
<strong>Strategy</strong> has positive carry of 8 cents after<br />
one year and 30 cents after two years.<br />
Alessandro Tentori 16 July 2010<br />
<strong>Market</strong> Mover, Non-Objective Research Section<br />
29<br />
www.Global<strong>Market</strong>s.bnpparibas.com
EUR: Yet Another Volatility Deflation Trade<br />
• With the exception of severe dislocations at<br />
the height of the credit crisis, the 10y10y skew<br />
has undergone flattening and steepening<br />
pressures with rising rates and falling rates,<br />
respectively.<br />
• STRATEGY: Buy the EUR 10y10y<br />
3.50%-2.75%-1.00% swaption receiver ladder.<br />
Historically, there has been a negative relationship<br />
between the steepness of the swaption implied<br />
volatility skew and the level of rates. This makes<br />
intuitive sense: everything else being equal, at higher<br />
levels of rates, deep out-of-the-money swaption<br />
receivers are more attractive than deep out-of-themoney<br />
payers. The opposite holds when rates are<br />
low.<br />
2.0<br />
2.5<br />
3.0<br />
3.5<br />
4.0<br />
4.5<br />
5.0<br />
5.5<br />
Chart 1: Evolution of EUR 10y10y Pay/Rec<br />
Implied Volatility Spread<br />
10y swap<br />
6.0<br />
2003 2004 2005 2006 2007 2008 2009 2010<br />
Source: <strong>BNP</strong> Paribas<br />
200bp out Pay/Rec Implied Volatility Spread (RHS)<br />
Chart 2: EUR 10y10y Smile vs JPY 10y10y<br />
Smile<br />
6<br />
4<br />
2<br />
0<br />
-2<br />
-4<br />
-6<br />
Chart 1 plots the long-term evolution of the EUR<br />
200bp wide implied volatility spread against the<br />
10-year swap. With the exception of severe<br />
dislocations at the height of the credit crisis, the<br />
10y10y skew has undergone flattening and<br />
steepening pressures with rising rates and falling<br />
rates, respectively.<br />
It is worth comparing the current shape of the EUR<br />
10y10y smile with its Japanese counterpart. Both<br />
smiles are plotted in Chart 2: note the much steeper<br />
JPY smile! It is worth highlighting that the twentyyear<br />
range on the JPY 10y10y swap rate is between<br />
1.39% and 4.18%. The current rate at 2.42% is still in<br />
the first quartile. Clearly, if the Euro economy<br />
continues to head towards a deflationary state, we<br />
should expect the implied volatility skew to steepen<br />
ahead.<br />
Accordingly, in “EUR: Deflation Macro Hedge Via<br />
Options” in this issue of <strong>Market</strong> Mover, we show two<br />
downside macro deflation hedges via swaption<br />
receiver spreads which generate positive PnL in the<br />
event of a cheapening of the receiver skew.<br />
Alternatively, the deflation risk can be played via<br />
swaption receiver ladders which put additional weight<br />
on the dynamics of out-of-the-money receivers. Chart<br />
3 plots the terminal payoff of the EUR 10y10y<br />
3.50%-2.75%-1.00% swaption receiver ladder (the<br />
10y swap rate is currently around 2.89% versus the<br />
10y10y swap rate at 4.14%). The trade costs 38bp<br />
(indicative). At expiry, the trade generates losses if<br />
the 10y swap settles below 30bp! For comparison the<br />
JPY 10y swap attained its all-time low of 43bp mid-<br />
June 2003. More importantly, the position carries<br />
1.20%<br />
1.10%<br />
1.00%<br />
0.90%<br />
0.80%<br />
0.70%<br />
0.60%<br />
0.50%<br />
0.40%<br />
EUR 10y10y smile<br />
JPY 10y10y smile<br />
0.30%<br />
0% 1% 2% 3% 4% 5% 6% 7% 8% 9%<br />
Source: <strong>BNP</strong> Paribas<br />
7.0<br />
6.0<br />
5.0<br />
4.0<br />
3.0<br />
2.0<br />
1.0<br />
0.0<br />
-1.0<br />
-2.0<br />
-3.0<br />
Chart 3: Terminal Payoff of EUR 10y10y<br />
3.50%-2.75%-1.00% Receiver Ladder<br />
-4.0<br />
0.00 1.00 2.00 3.00 4.00 5.00<br />
Source: <strong>BNP</strong> Paribas<br />
positively with the expected total return over the<br />
coming year (next two years) estimated at around<br />
8% (22%). Exposure to the skew dynamics is<br />
reflected by SABR Rho around EUR 10,000.<br />
Terminal max pay-out ratio is 1:14.<br />
Matteo Regesta 16 July 2010<br />
<strong>Market</strong> Mover, Non-Objective Research Section<br />
30<br />
www.Global<strong>Market</strong>s.bnpparibas.com
EUR: SAS Diversification to Enhance Yields<br />
• In this analysis, we look at strategies to<br />
enhance yields in a low-rate environment. The<br />
steepness of SAS curves has increased<br />
recently, which is well-suited to our scenario.<br />
• STRATEGY: Sell KFW Apr 15 vs buy CADES<br />
Apr 20; Sell CADES Apr 12 vs buy Apr 15 or 20;<br />
Switch from NETHER Jul 20 to CADES Apr 20.<br />
70<br />
65<br />
60<br />
55<br />
50<br />
45<br />
Chart 1: Developments in 2/10s ASW<br />
40<br />
Assume a low interest rates, low inflation, low growth<br />
environment that lasts for more than a policy relevant<br />
period of two years. The relevant question for fixed<br />
income investors will be about maintaining a more or<br />
less constant risk/return profile. In order to achieve<br />
this goal, one possible strategy is to diversify funds<br />
across different types of AAA categories (e.g. from<br />
core EUR govvies into agencies). Another strategy,<br />
equally viable, is to ‘diversify’ into longer duration<br />
buckets. This strategy is especially suitable in a<br />
steep yield curve environment. We analyse this<br />
second strategy, concentrating on SAS space (we<br />
have already discussed the issue of duration<br />
extension on the swap curve in previous research).<br />
Analysis<br />
As Chart 1 shows, we are in a particularly steep<br />
curve environment. Thus, now is a good time to enter<br />
longer-duration trades.<br />
CADES has the steepest curve of the main three<br />
agencies, hence offering the best pick-up for<br />
duration-extension strategies (Chart 2).<br />
For example, CADES 2/5s is worth 39bp and 2/10s is<br />
68bp. By comparison, similar curve segments on EIB<br />
are worth 37bp and 59bp, respectively. The KFW<br />
curve is the flattest of the three analysed here,<br />
sporting 2/5s at 32bp and 2/10s at 52bp.<br />
However, the KFW curve merits some RV<br />
considerations. As Chart 2 shows (circled), there are<br />
some distortions on the KFW curve, which should<br />
only be temporary (we don’t see any fundamental<br />
reasons behind them). In particular, there is a 25bp<br />
ASW differential between KFW Jul 14 (cheap) and<br />
KFW Jun 13 (rich).<br />
Trade Ideas<br />
1) Investors holding KFW should consider switching<br />
into CADES for a better pick-up: sell KFW Apr 15 vs<br />
buy CADES Apr 20 (49bp).<br />
2) The slope of the CADES curve is at historical<br />
highs over the 1y horizon (Chart 2): sell CADES Apr<br />
12 vs buy CADES Apr 15 or 20.<br />
35<br />
30<br />
Aug 09 Oct 09 Dec 09 Feb 10 Apr 10 Jun 10<br />
KFW EIB CADES<br />
Source: <strong>BNP</strong> Paribas<br />
Chart 2: CADES Offer the Steepest Curve<br />
40<br />
30<br />
20<br />
10<br />
0<br />
0y 2y 4y 6y 8y 10y 12y<br />
-10<br />
-20<br />
-30<br />
-40<br />
KFW<br />
EIB<br />
CADES<br />
Source: <strong>BNP</strong> Paribas<br />
Chart 3: CADES versus Govvies (asw Space)<br />
40<br />
35<br />
30<br />
25<br />
20<br />
15<br />
10<br />
5<br />
0<br />
Feb 10 Mar 10 Apr 10 May 10 Jun 10 Jul 10<br />
CADES 4 1/4 04/20 FRTR3 1/2 04/25/20 NETHER 3 1/2 07/20<br />
Source: <strong>BNP</strong> Paribas<br />
3) The cheapening of French government bonds<br />
relative to Netherlands since the start of the year<br />
pushed the 10y ASW differential of CADES versus<br />
Netherlands government bonds to a significantly high<br />
level (Chart 3): switch from NETHER Jul 20 into<br />
CADES Apr 20 for a high pick-up (24bp).<br />
Camille de Courcel 16 July 2010<br />
<strong>Market</strong> Mover, Non-Objective Research Section<br />
31<br />
www.Global<strong>Market</strong>s.bnpparibas.com
JGBs: Fiscal Austerity – Not an Easy Task<br />
• Since Kan’s “third way to growth” that puts<br />
emphasis on the social welfare is nothing more<br />
than “big government”, markets will worry<br />
about the growing fiscal burden of an ageing<br />
population.<br />
• Now that the Upper House elections are<br />
over, financial markets will again take note of<br />
the various difficulties in restructuring<br />
government finances. The JGB market’s<br />
attempts to test the upside have ended and<br />
steepening pressures are growing.<br />
LDP<br />
84<br />
New<br />
Komeito<br />
19<br />
Chart 1: Parties’ Diet Standings<br />
The Upper<br />
House<br />
242 seats<br />
Source: <strong>BNP</strong> Paribas<br />
Your Party 11<br />
DPJ<br />
106<br />
LDP<br />
116<br />
The Lower<br />
House<br />
480 seats<br />
New Komeito 21<br />
DPJ<br />
306<br />
Fiscal restructuring remains difficult<br />
The DPJ suffered a crushing defeat in the 11 July<br />
Upper House elections, losing the majority it held<br />
with its coalition ally NPP. As a result, the DPJ will<br />
need to collaborate with the New Komeito Party and<br />
Your Party, on each economic policy measure. Thus<br />
it has become difficult for the DPJ to pursue fiscal<br />
austerity independently. A consumption tax hike has<br />
become a politically delicate subject, particularly<br />
now, since the election defeat is deemed due to PM<br />
Kan’s comments on a hike in the rate.<br />
Under the current circumstances, fiscal restructuring<br />
remains difficult, even with the ten seats won by Your<br />
Party, which is the only party that respects the<br />
market mechanism. Instead, the left wing of the DPJ<br />
that stresses correcting economic disparities — the<br />
Kan-Edano policy line — has become even more<br />
prominent and their policy affinity with the New<br />
Komeito is growing. Since Kan’s “third way to growth”<br />
that puts emphasis on the social welfare is nothing<br />
more than “big government,” markets will worry about<br />
the growing fiscal burden of an ageing population.<br />
Not easy to implement the Scandinavian model<br />
The Scandinavian model that combines significant<br />
welfare benefits with a sizeable tax burden is being<br />
re-evaluated, in part because of the stable economic<br />
performance of northern European nations. However,<br />
other factors have also played a role in their success:<br />
small populations of several million individuals help<br />
explain the high average levels of education, high<br />
labour mobility and great trust in governments. It<br />
would not prove easy to implement successfully this<br />
model in Japan, a nation with a rapid rise in the<br />
average age of the population of 130 million.<br />
Incidentally, consumption tax (VAT) rates are around<br />
25% in northern European countries. If Japan were<br />
to raise its consumption tax rate incrementally from<br />
the current 5% to 25%, this would take twenty years<br />
if the rate was hiked by 1% per annum or ten years if<br />
increased 2% annually. Since memories of the<br />
sizeable impact that past consumption tax hikes have<br />
had on the Japanese economy are still fresh, it is<br />
unrealistic to hike this tax continuously without regard<br />
to the state of the economy. This implies that once<br />
the government has started to go down the road of<br />
raising the consumption tax, it will find the going long<br />
and hard.<br />
Steepening pressures are growing<br />
Now that the Upper House elections are over,<br />
financial markets will again take note of the various<br />
difficulties in restructuring government finances: 1)<br />
talk of hiking the consumption tax has again proven<br />
to be a headwind for the ruling bloc and the<br />
consumption tax ‘trauma’ will linger among<br />
lawmakers; 2) despite PM Kan’s stress on fiscal<br />
discipline, a coalition government makes it hard to<br />
implement all policy measures; and 3) apart from<br />
future consumption tax changes, the government has<br />
to start the compilation of the FY2011 budget.<br />
The JGB market’s attempts to test the upside have<br />
ended and steepening pressures are growing. Not<br />
only will uncertainty over the eurozone financial<br />
system abate but implementing fiscal austerity will<br />
not be an easy task. After the Upper House election<br />
and bank stress tests, we should focus on the real<br />
economy. With the economy resilient, the earnings<br />
environment for financial institutions is not<br />
unfavourable. Hence we recommend that investors<br />
carefully evaluate the fundamentals rather than<br />
rushing into the market.<br />
Koji Shimamoto 16 July 2010<br />
<strong>Market</strong> Mover, Non-Objective Research Section<br />
32<br />
www.Global<strong>Market</strong>s.bnpparibas.com
Global Inflation Watch<br />
June CPI in Focus<br />
The final release of the eurozone HICP for July<br />
showed a marginal rise in core inflation (from 0.85%<br />
y/y to 0.92%) offset by a slowdown in energy<br />
inflation, as a modest fall in energy prices over the<br />
month (-0.4%) was exacerbated by base effects. The<br />
modest acceleration in prices of clothing and<br />
recreational items probably reflects the impact of the<br />
weaker euro. Spanish data also revealed some passthrough<br />
from the VAT hike. We expect more in July<br />
but, with the main retailers announcing that they have<br />
not transferred it to their customers, the overall<br />
impact of the tax hike should remain limited (we<br />
assume a 40% pass-through, implying a boost to<br />
Spanish core inflation of around 0.6pp).<br />
All in all, neither the euro weakening nor the VAT<br />
increases implemented in some countries appears to<br />
be sufficient to halt the underlying downward trend in<br />
core inflation that we expect to resume from July,<br />
with aggressive discounts putting downward pressure<br />
on the prices of goods such as clothing and furniture.<br />
The picture was slightly different in the UK, where the<br />
CPI/RPI releases surprised once again to the upside.<br />
Upward pressures were seen in a number of servicerelated<br />
components, with core CPI inflation matching<br />
its all-time high of 3.1% y/y. We remain of the view<br />
that inflation will slow over the next few months, as<br />
the impact of the GBP weakness fades, while growth<br />
in disposable income slows from the robust pace<br />
seen recently. Recent data and some creep in<br />
inflation expectations (Chart 2) highlight the risk that<br />
the downward trend turns out to be slower than we<br />
currently anticipate.<br />
The next focus is Friday’s release of the US CPI. The<br />
headline CPI is expected to fall by 0.1% m/m. Pump<br />
prices fell throughout June – the lagged response to<br />
weaker crude oil prices in May. As a result, after<br />
seasonal adjustment, the energy CPI should fall by<br />
1.4% m/m in June. The core CPI, meanwhile, should<br />
be unchanged m/m, pulling the y/y rate down to<br />
0.85% from 1.0% y/y previously – closer to its 1961<br />
all-time low of 0.7% y/y. If there is a risk, it is that<br />
state and local governments raise taxes on tobacco<br />
and other goods to help redress budget deficits – as<br />
they did in May. However, the clear trend in US core<br />
inflation is downwards. Indeed, one of the key trends<br />
in the US since the start of the year has been the<br />
broadening of disinflationary trends within core<br />
inflation.<br />
Chart 1: Eurozone HICP (% y/y)<br />
Source: Reuters EcoWin Pro, <strong>BNP</strong> Paribas<br />
Chart 2: UK Inflation Expectations vs. CPI<br />
Source: Reuters EcoWin Pro<br />
Chart 3: US Core CPI (% y/y)<br />
Source: Reuters EcoWin Pro, <strong>BNP</strong> Paribas<br />
Luigi Speranza/Eoin O’Callaghan 16 July 2010<br />
<strong>Market</strong> Mover<br />
33<br />
www.Global<strong>Market</strong>s.bnpparibas.com
Table 1: <strong>BNP</strong> Paribas' Inflation Forecasts<br />
Eurozone<br />
France<br />
US<br />
Headline HICP Ex-tobacco HICP<br />
Headline CPI<br />
Ex-tobacco CPI<br />
CPI Urban SA CPI Urban NSA<br />
Index % m/m % y/y Index % m/m % y/y Index % m/m % y/y index % m/m % y/y Index % m/m % y/y Index % m/m % y/y<br />
2009 108.1 - 0.3 107.9 - 0.2 119.3 - 0.1 118.0 - 0.1 214.5 - -0.3 214.5 - -0.4<br />
2010 (1) 109.9 - 1.6 109.5 - 1.5 121.2 - 1.6 119.9 - 1.6 218.2 - 1.7 218.2 - 1.7<br />
2011 (1) 111.5 - 1.5 111.1 - 1.4 123.0 - 1.4 121.5 - 1.4 220.4 - 1.0 220.4 - 1.0<br />
Q3 2009 108.0 - -0.4 107.8 - -0.5 119.4 - -0.4 118.1 - -0.4 215.4 - -1.6 215.7 - -1.6<br />
Q4 2009 108.6 - 0.4 108.4 - 0.3 119.7 - 0.4 118.4 - 0.3 216.8 - 1.5 216.2 - 1.4<br />
Q1 2010 108.6 - 1.1 108.3 - 1.0 120.3 - 1.3 119.0 - 1.2 217.6 - 2.4 217.0 - 2.4<br />
Q2 2010 (1) 110.0 - 1.5 109.7 - 1.4 121.3 - 1.6 120.0 - 1.5 217.3 - 1.8 218.2 - 1.8<br />
Q3 2010 (1) 109.9 - 1.8 109.6 - 1.7 121.4 - 1.7 120.1 - 1.7 218.5 - 1.4 218.8 - 1.4<br />
Q4 2010 (1) 110.9 - 2.1 110.6 - 2.1 121.8 - 1.8 120.5 - 1.8 219.5 - 1.2 218.8 - 1.2<br />
Q1 2011 (1) 110.7 - 2.0 110.4 - 1.9 122.2 - 1.6 120.8 - 1.5 219.8 - 1.0 219.2 - 1.0<br />
Q2 2011 (1) 111.6 - 1.5 111.2 - 1.4 123.1 - 1.4 121.6 - 1.4 220.1 - 1.3 221.0 - 1.3<br />
Jan 10 108.1 -0.8 1.0 107.75 -0.8 0.9 119.7 -0.2 1.1 118.32 -0.2 1.0 217.6 0.2 2.7 216.69 0.3 2.6<br />
Feb 10 108.4 0.3 0.9 108.10 0.3 0.8 120.4 0.6 1.3 118.99 0.6 1.2 217.6 0.0 2.2 216.74 0.0 2.1<br />
Mar 10 109.4 0.9 1.4 109.09 0.9 1.3 120.9 0.5 1.6 119.58 0.5 1.5 217.7 0.1 2.4 217.63 0.4 2.3<br />
Apr 10 109.9 0.5 1.5 109.58 0.4 1.4 121.3 0.3 1.7 119.90 0.3 1.6 217.6 -0.1 2.2 218.01 0.2 2.2<br />
May 10 110.0 0.1 1.6 109.71 0.1 1.5 121.4 0.1 1.6 120.04 0.1 1.6 217.2 -0.2 2.0 218.18 0.1 2.0<br />
Jun 10 (1) 110.0 0.0 1.4 109.70 0.0 1.3 121.4 0.0 1.5 120.02 0.0 1.4 217.1 0.0 1.2 218.27 0.0 1.2<br />
Jul 10 (1) 109.5 -0.4 1.6 109.19 -0.5 1.6 121.0 -0.3 1.7 119.68 -0.3 1.6 217.9 0.3 1.4 218.50 0.1 1.5<br />
Aug 10 (1) 110.0 0.4 1.7 109.62 0.4 1.6 121.7 0.5 1.7 120.32 0.5 1.6 218.5 0.3 1.4 218.74 0.1 1.3<br />
Sep 10 (1) 110.3 0.3 2.0 109.98 0.3 1.9 121.6 -0.1 1.9 120.24 -0.1 1.8 219.0 0.2 1.4 219.03 0.1 1.4<br />
Oct 10 (1) 110.7 0.4 2.1 110.37 0.4 2.0 121.7 0.1 1.9 120.37 0.1 1.8 219.3 0.1 1.4 219.23 0.1 1.4<br />
Nov 10 (1) 110.9 0.1 2.1 110.53 0.1 2.1 121.8 0.1 1.8 120.43 0.1 1.8 219.5 0.1 1.2 218.95 -0.1 1.2<br />
Dec 10 (1) 111.2 0.4 2.2 110.92 0.4 2.1 122.0 0.2 1.7 120.65 0.2 1.7 219.7 0.1 1.1 218.28 -0.3 1.1<br />
Jan 11 (1) 110.3 -0.9 2.0 109.89 -0.9 2.0 121.7 -0.3 1.7 120.22 -0.4 1.6 219.7 0.0 1.0 218.82 0.2 1.0<br />
Feb 11 (1) 110.6 0.3 2.1 110.28 0.3 2.0 122.3 0.5 1.6 120.88 0.5 1.6 219.8 0.0 1.0 219.01 0.1 1.0<br />
Mar 11 (1) 111.3 0.6 1.8 110.97 0.6 1.7 122.7 0.3 1.4 121.23 0.3 1.4 219.9 0.0 1.0 219.86 0.4 1.0<br />
Apr 11 (1) 111.6 0.2 1.6 111.23 0.2 1.5 123.0 0.2 1.4 121.54 0.3 1.4 220.0 0.1 1.1 220.43 0.3 1.1<br />
May 11 (1) 111.7 0.1 1.5 111.29 0.1 1.4 123.1 0.1 1.4 121.68 0.1 1.4 220.1 0.1 1.3 221.02 0.3 1.3<br />
Jun 11 (1) 111.7 0.0 1.5 111.23 -0.1 1.4 123.1 0.0 1.5 121.69 0.0 1.4 220.3 0.1 1.4 221.42 0.2 1.4<br />
Updated<br />
Next<br />
Release<br />
Jul 15<br />
Jul HICP Flash (Jul 30)<br />
Jul 14<br />
Jul CPI (August 13)<br />
Jul 08<br />
Jun CPI (Jul 16)<br />
Source: <strong>BNP</strong> Paribas, (1) Forecasts<br />
Chart 4: Eurozone HICP (% y/y)<br />
Chart 5: US Shelter Prices Drive Core CPI Down<br />
Source: Reuters EcoWin Pro<br />
Core inflation is forecast to continue grinding lower, as excess<br />
capacity and the ongoing structural adjustment in a number of<br />
economies limit firms’ pricing power.<br />
Source: Reuters EcoWin Pro<br />
Inflation in core goods has eased sharply in recent months,<br />
following a temporary boost from a series of tobacco tax hikes and<br />
a sharp contraction in vehicle inventories. As a result, the<br />
moderation in core inflation has broadened significantly.<br />
Luigi Speranza/Eoin O’Callaghan 16 July 2010<br />
<strong>Market</strong> Mover<br />
34<br />
www.Global<strong>Market</strong>s.bnpparibas.com
Table 2: <strong>BNP</strong> Paribas' Inflation Forecasts<br />
Japan<br />
UK<br />
Sweden<br />
Core CPI SA<br />
Core CPI NSA<br />
Headline CPI RPI<br />
CPI CPIF<br />
Index % m/m % y/y Index % m/m % y/y Index % m/m % y/y Index % m/m % y/y Index % m/m % y/y Index % m/m % y/y<br />
2009 100.3 - -1.3 100.3 - -1.3 110.8 - 2.1 213.7 - -0.5 299.7 - -0.3 191.2 - 1.9<br />
2010 (1) 99.3 - -1.0 99.3 - -1.0 114.3 - 3.1 223.4 - 4.5 303.9 - 1.4 195.0 - 2.0<br />
2011 (1) 98.9 - -0.3 98.9 - -0.3 116.5 - 2.0 229.7 - 2.8 310.6 - 2.2 197.7 - 1.3<br />
Q3 2009 99.9 - -2.3 100.1 - -2.3 111.3 - 1.5 214.4 - -1.4 299.5 - -1.2 191.6 - 1.6<br />
Q4 2009 99.7 - -1.8 99.9 - -1.8 112.1 - 2.1 216.9 - 0.6 301.3 - -0.4 193.2 - 2.3<br />
Q1 2010 99.7 - -1.3 99.3 - -1.2 112.9 - 3.2 219.3 - 4.0 301.2 - 1.0 194.0 - 2.6<br />
Q2 2010 (1) 99.2 - -1.3 99.2 - -1.3 114.4 - 3.4 223.5 - 5.1 302.8 - 1.1 194.9 - 2.1<br />
Q3 2010 (1) 98.9 - -1.0 99.2 - -0.9 114.5 - 2.9 224.6 - 4.8 303.6 - 1.4 194.8 - 1.7<br />
Q4 2010 (1) 99.2 - -0.5 99.4 - -0.5 115.2 - 2.7 226.0 - 4.2 308.1 - 2.2 196.4 - 1.7<br />
Q1 2011 (1) 99.0 - -0.7 98.6 - -0.7 115.5 - 2.3 227.3 - 3.7 306.7 - 1.8 195.8 - 0.9<br />
Q2 2011 (1) 98.9 - -0.3 98.9 - -0.3 116.5 - 1.8 229.2 - 2.6 309.4 - 2.2 197.5 - 1.3<br />
Jan 10 99.6 -0.1 -1.3 99.2 -0.6 -1.3 112.4 -0.2 3.4 217.9 0.0 3.7 299.8 -0.6 0.6 193.0 -0.2 2.6<br />
Feb 10 99.8 0.2 -1.2 99.2 0.0 -1.2 112.9 0.4 3.0 219.2 0.6 3.7 301.6 0.6 1.2 194.2 0.6 2.7<br />
Mar 10 99.8 0.0 -1.2 99.5 0.3 -1.2 113.5 0.5 3.4 220.7 0.7 4.4 302.3 0.2 1.2 194.7 0.3 2.5<br />
Apr 10 99.3 -0.5 -1.5 99.2 -0.3 -1.5 114.2 0.6 3.7 222.8 1.0 5.3 302.4 0.0 1.0 194.8 0.0 2.2<br />
May 10 99.3 0.0 -1.2 99.3 0.1 -1.2 114.4 0.2 3.3 223.6 0.4 5.1 302.9 0.2 1.2 195.0 0.1 2.1<br />
Jun 10 (1) 99.1 -0.2 -1.1 99.2 -0.1 -1.1 114.5 0.1 3.2 224.1 0.2 5.0 303.0 0.0 0.9 195.0 0.0 1.9<br />
Jul 10 (1) 98.9 -0.2 -1.1 99.0 -0.2 -1.1 114.2 -0.3 3.0 223.8 -0.1 4.9 302.7 -0.1 1.3 194.2 -0.4 1.6<br />
Aug 10 (1) 98.9 0.0 -0.9 99.2 0.2 -0.9 114.7 0.5 3.0 225.0 0.5 4.9 302.2 -0.2 0.9 194.5 0.1 1.5<br />
Sep 10 (1) 98.9 0.0 -0.9 99.3 0.1 -0.9 114.7 0.0 2.9 225.1 0.1 4.6 305.9 1.2 1.9 195.8 0.7 1.8<br />
Oct 10 (1) 99.2 0.3 -0.5 99.6 0.3 -0.5 114.8 0.1 2.8 225.5 0.2 4.4 308.3 0.8 2.4 196.5 0.3 1.8<br />
Nov 10 (1) 99.3 0.1 -0.5 99.4 -0.2 -0.5 115.0 0.2 2.7 225.8 0.1 4.2 307.2 -0.4 2.1 196.5 0.0 1.8<br />
Dec 10 (1) 99.1 -0.2 -0.6 99.2 -0.2 -0.6 115.6 0.5 2.7 226.7 0.4 4.0 308.6 0.5 2.3 196.3 -0.1 1.5<br />
Jan 11 (1) 99.0 -0.1 -0.6 98.6 -0.6 -0.6 115.2 -0.4 2.5 226.3 -0.2 3.9 305.0 -1.2 1.7 195.0 -0.7 1.0<br />
Feb 11 (1) 99.0 0.0 -0.8 98.4 -0.2 -0.8 115.6 0.3 2.4 227.4 0.5 3.7 307.3 0.8 1.9 195.8 0.4 0.8<br />
Mar 11 (1) 99.0 0.0 -0.8 98.7 0.3 -0.8 115.8 0.2 2.0 228.1 0.3 3.4 307.7 0.2 1.8 196.7 0.5 1.0<br />
Apr 11 (1) 99.0 0.0 -0.3 98.9 0.2 -0.3 116.2 0.3 1.8 228.7 0.2 2.7 309.4 0.5 2.3 197.3 0.3 1.3<br />
May 11 (1) 98.9 -0.1 -0.4 98.9 0.0 -0.4 116.6 0.3 1.9 229.4 0.3 2.6 309.2 -0.1 2.1 197.5 0.1 1.3<br />
Jun 11 (1) 98.8 -0.1 -0.3 98.9 0.0 -0.3 116.6 0.1 1.8 229.5 0.1 2.4 309.5 0.1 2.2 197.6 0.0 1.3<br />
Updated<br />
Next<br />
Release<br />
Jun 25<br />
Jun CPI (Jul 30)<br />
Jul 13<br />
Jul CPI (Aug 17)<br />
Jul 08<br />
Jul CPI (Aug 12)<br />
Source: <strong>BNP</strong> Paribas, (1) Forecasts<br />
Chart 6: Japanese CPI (% y/y)<br />
Chart 7: UK CPI (% y/y)<br />
Source: Reuters EcoWin Pro<br />
Prices are expected to continue falling but the pace of decline is<br />
easing as the economy recovers.<br />
Source: Reuters EcoWin Pro, <strong>BNP</strong> Paribas<br />
We expect inflation to remain above target for the remainder of the<br />
year, although trending down.<br />
Luigi Speranza/Eoin O’Callaghan 16 July 2010<br />
<strong>Market</strong> Mover<br />
35<br />
www.Global<strong>Market</strong>s.bnpparibas.com
Table 3: <strong>BNP</strong> Paribas' Inflation Forecasts<br />
Canada Norway Australia<br />
CPI Core CPI Headline CPI Core<br />
CPI<br />
Core<br />
Index % q/q % y/y Index % q/q % y/y Index % q/q % y/y Index % q/q % y/y Index % q/q % y/y Index % q/q % y/y<br />
2009 114.4 0.3 113.6 1.8 125.7 2.2 118.4 2.6 167.8 - 1.8 - - 3.7<br />
2010 (1) 116.5 1.8 115.8 1.9 128.8 2.4 120.2 1.6 173.2 - 3.2 - - 2.8<br />
2011 (1) 118.6 1.8 117.8 1.7 131.1 1.8 122.3 1.7 179.0 - 3.3 - - 2.9<br />
Q3 2009 114.7 0.5 -0.9 113.9 1.2 1.6 125.8 0.0 1.8 118.5 0.0 2.4 168.6 1.0 1.3 - - 3.5<br />
Q4 2009 114.9 0.6 0.8 114.4 1.9 1.6 126.6 0.6 1.4 119.3 0.7 2.3 169.5 0.5 2.1 - - 3.4<br />
Q1 2010 115.4 2.0 1.6 114.9 1.6 1.9 128.4 1.4 2.9 119.4 0.1 2.0 171.0 0.9 2.9 - - 3.1<br />
Q2 2010 (1) 116.3 3.0 1.5 115.6 2.7 1.9 129.1 0.6 2.6 120.3 0.8 1.5 172.3 0.8 3.2 - - 2.7<br />
Q3 2010 (1) 116.9 2.2 1.9 116.2 2.0 2.1 128.5 -0.5 2.1 120.3 0.0 1.5 174.2 1.1 3.3 - - 2.6<br />
Q4 2010 (1) 117.4 1.5 2.2 116.6 1.2 1.9 129.2 0.6 2.1 120.9 0.4 1.3 175.2 0.5 3.5 - - 2.7<br />
Q1 2011 (1) 117.8 1.6 2.1 117.0 1.6 1.9 129.6 0.3 1.0 121.1 0.2 1.4 176.7 0.9 3.3 - - 2.7<br />
Q2 2011 (1) 118.3 1.7 1.7 117.5 1.7 1.6 131.0 1.0 1.5 122.4 1.0 1.7 178.0 0.8 3.3 - - 2.8<br />
Updated<br />
Next<br />
Release<br />
Jun 22<br />
Jun CPI (Jul 23)<br />
Jul 09<br />
Jul CPI (Aug 10)<br />
Jun 17<br />
Q2 CPI (Jul 28)<br />
Source: <strong>BNP</strong> Paribas, (1) Forecasts<br />
Chart 8: Canadian Total vs. Core CPI<br />
Chart 9: Australian CPI (% y/y)<br />
Source: Reuters EcoWin Pro, <strong>BNP</strong> Paribas<br />
Wage pressures appear subdued, suggesting underlying inflation<br />
should remain close to the BoC's 2% target.<br />
Source: Reuters EcoWin Pro, <strong>BNP</strong> Paribas<br />
Near-term inflation pressures should be muted but, with the limited<br />
spare capacity in the labour market being eroded, underlying<br />
inflation is likely to settle near the top of the RBA's target range.<br />
CPI Data Calendar for the Coming Week<br />
Day GMT Economy Indicator Previous<br />
<strong>BNP</strong>P<br />
F’cast<br />
Consensus Comment<br />
Fri 16/07 12:30 US CPI m/m : Jun -0.2% -0.1% -0.1%<br />
12:30 CPI y/y : Jun 2.0% 1.2% 1.2%<br />
12:30 Core CPI m/m : Jun 0.1% 0.0% 0.1% Subdued core<br />
12:30 Core CPI y/y : Jun 0.9% 0.9% 0.9%<br />
Release dates and forecasts as at c.o.b. prior to the date of publication: See Daily Economic Spotlight for any revision<br />
Source: <strong>BNP</strong> Paribas<br />
Luigi Speranza/Eoin O’Callaghan 16 July 2010<br />
<strong>Market</strong> Mover<br />
36<br />
www.Global<strong>Market</strong>s.bnpparibas.com
Inflation: Sell 30y in the UK & US<br />
• GLOBAL: Stocks are hot but CPIs are not.<br />
Chart 1: OATei22/20 Too Steep vs OATei & OAT<br />
• EUR: Long OATei22/20 RY Spd. Short Vol.<br />
30<br />
OATEI22 / OATEI20 Real<br />
OATEI40 / OATEI20 Nominal Rhs<br />
90<br />
• USD: 10/20y to react to nominals & supply.<br />
85<br />
• GBP: Short UKTi-40 BE post CPI reform<br />
and into supply.<br />
25<br />
80<br />
75<br />
20<br />
70<br />
EUR: The OATei auction went well: EUR 1.8bn was<br />
issued (top of the range), of which 0.6bn of OATi-19<br />
(premium of 15 cents, bid cover of 2.4) and 1.2bn of<br />
OATei-22 (18c premium, 1.9 b/c). We entered a long<br />
OATei-22 / OATei-20 real yield flattener at 26.5bp,<br />
targeting 19bp by the end of the month. The spread<br />
looks steep in the real and nominal curves (Chart 1)<br />
while the trade should benefit from the payment of<br />
the 10bn BTANei-10, 4bn of coupons and the 0.4y<br />
index extension at the end of the month. Overall, we<br />
keep a neutral/negative bias on breakevens into<br />
BTPei supply, favouring 5 and 10y maturities<br />
(benchmarks) over 2 and 30y. In addition, inflation<br />
volatility is starting to come off, after having reached<br />
and traded at expensive levels last week. Today, the<br />
10y inflation swap breakeven is still at 2% while<br />
clients can sell 10y 0% y/y EURxt floor for a premium<br />
of 350bp (against 600bp last week). Chart 2<br />
compares the annualised premium to current inflation<br />
forwards and <strong>BNP</strong>P’s long-term inflation forecasts.<br />
The trade is attractive for clients who can deal with<br />
volatility in P&L.<br />
USD: The market has benefited from the strong<br />
results of the 10y TIPS auction and the recovery in<br />
stocks and oil in July. However, ahead of CPI and<br />
post weak PPI, 10y real yields are back to their<br />
historical low, which should slow, if not reverse, the<br />
rally in breakevens. The focus will gradually switch<br />
towards the auction of the 30y TIPS on 23 August,<br />
i.e. only 11 days before the tap of the 10y TIPS. This<br />
accumulation of supply at this level of real yield has<br />
little chance of being well received by dealers, who<br />
are probably still long from the largest auction ever.<br />
We still prefer 2 and 10y maturities to 5 and 20y+<br />
ones. For a time, the 10/20y real yield spread looked<br />
rather steep versus nominal but this is no longer the<br />
case (Chart 3) and we expect 20y+ breakevens to<br />
underperform versus 10y in the coming weeks.<br />
GBP: The switch from the RPI to CPI seems to have<br />
triggered more fuss amongst analysts than fund<br />
managers. Indeed, after initially dropping by up to<br />
15bp, 30y cash breakevens have recovered fully and<br />
are actually above 7 July levels, i.e. the close before<br />
Mr Webb’s announcement, and we saw a reasonable<br />
15<br />
14-May 29-May 13-Jun 28-Jun 13-Jul<br />
Chart 2: 10y 0% y/y EURxt Inflation Floor<br />
Premium vs Inflation Forwards & Forecasts<br />
%<br />
2.5<br />
2<br />
1.5<br />
1<br />
0.5<br />
0<br />
-0.5<br />
0 1 2 3 4 5 6 7 8 9 10<br />
ZC Fwds<br />
GBP 1.2bn auction of the UKTI-22 with a 1.5bp<br />
premium. As detailed in the following article “GBP:<br />
<strong>Market</strong> Downplays Shift to CPI”, on the one hand the<br />
reform should affect 40 to 80% of members of<br />
defined benefit pension funds and the RPI/CPI<br />
spread is volatile while the DMO still has to issue<br />
around GBP 25bn of RPI-linked UKTi before April<br />
2011. On the other hand, breakevens are relatively<br />
low and there is no obvious alternative market for<br />
pent-up LDI demand, which could also benefit from<br />
falling deficits. Still, we think there is enough material<br />
to send breakevens through the bottom of their<br />
recent range and we entered a short UKTI-40<br />
breakeven at 3.40%, targeting 3.20% or below into<br />
supply.<br />
<strong>BNP</strong><br />
Floor<br />
Chart 3: TIPS 10/20y Real & Nominal Spreads<br />
80<br />
75<br />
70<br />
65<br />
60<br />
55<br />
50<br />
45<br />
40<br />
35<br />
TIIJAN19 / TIIJAN29 Real<br />
30<br />
15-Apr 16-Jul 16-Oct 16-Jan 18-Apr 19-Jul 19-Oct<br />
Source: <strong>BNP</strong> Paribas, Bloomberg<br />
TIIJAN19 / TIIJAN29 Nominal Rhs<br />
65<br />
60<br />
105<br />
100<br />
95<br />
90<br />
85<br />
80<br />
75<br />
70<br />
Herve Cros / Shahid Ladha 16 July 2010<br />
<strong>Market</strong> Mover, Non-Objective Research Section<br />
37<br />
www.Global<strong>Market</strong>s.bnpparibas.com
P ric in g D a te<br />
Repo <strong>Rate</strong><br />
EUR DRI<br />
FRF DRI<br />
S e tt. D a te<br />
Table 1: <strong>BNP</strong> Paribas Carry Analysis<br />
EUR<br />
15-Jul-10<br />
Term 1<br />
Term 2<br />
3m<br />
6m<br />
12m<br />
0.48%<br />
0.51%<br />
0.56% 0.67%<br />
0.82%<br />
109.65968<br />
109.71000<br />
109.70000 109.45618<br />
110.46848<br />
111.26655<br />
119.98581<br />
120.04000 120.02000<br />
120.07228<br />
120.40630<br />
121.62372<br />
20-Jul-10<br />
01-Aug-10<br />
01-Sep-10<br />
20-O ct-10<br />
20-Jan-11<br />
20-Jul-11<br />
Real BE Real BE Real BE Real BE Real BE Real BE<br />
BTPEI Sep-10 1.30% -0.45% 58.8 54.2 333.0 310.7 #VALUE! #VALUE! - - - -<br />
O ATEI Jul-12 -0.65% 1.48% 0.4 -0 .2 -5 .4 -7 .7 -2 8 .3 -3 2 .7 4.2 -1 .8 -3 .2 -1 .9<br />
BTPEI Sep-12 0.75% 1.20% 2.6 0.3 3.1 -5 .2 -7 .7 -2 6 .1 47.6 8.7 121.2 26.1<br />
BO BLEI Apr-13 0.02% 0.84% 1.2 0.7 -0.9 -2.6 -13.4 -16.8 18.5 13.8 37.2 35.7<br />
BTPEI Sep-14 1.54% 1.19% 2.1 0.0 4.0 -3 .2 1.5 -14.2 33.8 2.0 72.3 3.5<br />
O ATEI Jul-15 0.59% 1.29% 1.0 0.0 0.9 -2 .8 -4 .0 -1 1 .8 15.9 0.5 31.5 1.5<br />
BUNDEI Apr-16 0.60% 1.23% 0.9 0.0 0.9 -2 .3 -3 .4 -1 0 .1 13.9 1.0 26.9 2.4<br />
BTPEI Sep-17 2.22% 1.36% 1.6 -0 .2 3.6 -2 .6 3.6 -9 .7 24.9 -1 .8 50.5 -4 .3<br />
BTPEI Sep-19 2.53% 1.48% 1.4 -0 .2 3.4 -2 .2 3.8 -8 .1 21.8 -2 .2 43.7 -4 .3<br />
BUNDEI Apr-20 1.01% 1.57% 0.7 -0 .1 1.1 -2 .0 -0 .9 -7 .3 10.7 -1 .9 20.3 -3 .8<br />
O ATEI Jul-20 1.20% 1.79% 0.8 -0 .2 1.3 -2 .2 -0 .3 -7 .9 11.7 -3 .2 22.6 -6 .5<br />
BTPEI Sep-23 2.76% 1.75% 1.1 -0 .3 2.7 -2 .2 3.3 -7 .1 17.0 -3 .8 33.5 -8 .2<br />
G G BEI Jul-25 8.69% 1.24% 3.0 -0 .5 9.5 -3 .4 17.8 -10.1 47.3 -9 .7 97.6 -18.1<br />
G G BEI Jul-30 6.92% 3.14% 1.9 -1 .6 5.8 -6 .9 10.3 -17.0 29.2 -26.7 59.3 -53.9<br />
O ATEI Jul-32 1.32% 2.19% 0.4 -0 .3 0.8 -1 .8 0.0 -5 .5 6.4 -4 .1 12.2 -8 .2<br />
BTPEI Sep-35 2.51% 2.54% 0.6 -0 .5 1.4 -2 .4 1.6 -6 .6 9.1 -7 .2 17.5 -14.8<br />
O ATEI Jul-40 1.36% 2.23% 0.3 -0 .3 0.6 -1 .5 0.0 -4 .3 4.7 -3 .8 8.8 -7 .5<br />
BTPEI Sep-41 2.79% 2.32% 0.6 -0 .4 1.5 -2 .1 1.8 -5 .8 8.8 -6 .3 16.9 -12.5<br />
FRF<br />
O ATI Jul-11 -0.43% 1.06% 1.3 0.7 -10.0 -11.9 -23.6 -26.3 -41.2 -30.8 - -<br />
O ATI Jul-13 -0.15% 1.29% 0.8 -0 .1 -2 .0 -4 .9 -4 .1 -1 0 .1 -2 .8 -1 3 .6 19.1 1.0<br />
O ATI Jul-17 0.72% 1.66% 0.8 -0 .3 0.7 -3 .0 1.7 -6 .2 5.9 -9 .6 21.5 -8 .9<br />
O ATI Jul-19 0.99% 1.79% 0.7 -0 .3 0.9 -2 .7 2.1 -5 .6 6.3 -9 .0 20.2 -9 .7<br />
O ATI Jul-23 1.20% 2.07% 0.6 -0 .3 0.9 -2 .3 2.0 -4 .8 5.6 -7 .8 16.4 -9 .5<br />
O ATI Jul-29 1.19% 2.29% 0.4 -0 .3 0.7 -2 .1 1.5 -4 .4 4.2 -7 .4 12.3 -10.1<br />
USD<br />
P ric in g D a te<br />
Repo <strong>Rate</strong><br />
USD DRI<br />
S e tt. D a te<br />
15-Jul-10<br />
218.09077<br />
16-Jul-10<br />
Term 1<br />
0.22%<br />
218.17800<br />
01-Aug-10<br />
Term 2<br />
0.22%<br />
218.26695<br />
01-Sep-10<br />
3m<br />
6m<br />
12m<br />
0.22% 0.23%<br />
0.31%<br />
218.63089<br />
219.07293<br />
220.75389<br />
18-O ct-10 18-Jan-11 18-Jul-11<br />
Yield BE Real BE Real BE Real BE Real BE Real BE<br />
TIPS Jan-11 0.37% -0.17% 10.2 10.4 26.8 27.7 117.3 120.4 - -<br />
TIPS Apr-11 0.37% -0.08% 6.7 6.3 16.2 15.0 58.5 55.6 218.1 209.1 - -<br />
TIPS Jan-12 -0.12% 0.56% 1.8 1.1 2.8 0.7 13.0 8.8 27.7 17.8 161.6 138.9<br />
TIPS Apr-12 0.00% 0.47% 1.8 1.2 3.3 1.3 13.0 8.7 27.2 17.3 123.1 101.2<br />
TIPS Jul-12 -0.14% 0.67% 1.3 0.6 1.9 -0 .2 9.1 4.7 18.0 8.2 79.1 57.8<br />
TIPS Apr-13 -0.09% 0.89% 1.0 0.0 1.5 -1 .3 6.7 0.7 12.7 -0 .4 46.6 18.0<br />
TIPS Jul-13 -0.01% 0.96% 1.1 -0 .1 1.8 -1 .6 7.0 0.0 13.4 -1 .5 46.0 13.1<br />
TIPS Jan-14 0.19% 0.99% 1.1 -0 .1 2.3 -1 .5 7.6 -0 .3 14.7 -1 .9 45.3 8.9<br />
TIPS Apr-14 0.12% 1.17% 1.0 -0 .3 1.9 -1 .9 6.5 -1 .5 12.3 -4 .6 37.9 1.4<br />
TIPS Jul-14 0.22% 1.13% 1.0 -0 .3 2.2 -1 .9 6.8 -1 .4 13.2 -4 .0 39.1 2.0<br />
TIPS Jan-15 0.42% 1.18% 1.1 -0 .3 2.5 -1 .8 7.3 -1 .6 14.1 -4 .4 39.3 -0 .2<br />
TIPS Jul-15 0.47% 1.28% 1.1 -0 .4 2.4 -2 .0 6.8 -2 .1 13.2 -5 .3 36.0 -3 .3<br />
TIPS Jan-16 0.57% 1.38% 1.1 -0 .5 2.5 -2 .1 6.7 -2 .6 13.1 -6 .1 34.7 -5 .8<br />
TIPS Jul-16 0.61% 1.47% 1.0 -0 .6 2.4 -2 .3 6.4 -2 .9 12.5 -6 .8 32.5 -7 .7<br />
TIPS Jan-17 0.75% 1.51% 1.1 -0 .5 2.5 -2 .2 6.6 -2 .9 12.7 -6 .7 32.5 -8 .0<br />
TIPS Jul-17 0.77% 1.55% 1.0 -0 .6 2.4 -2 .2 6.2 -2 .9 12.0 -6 .6 30.4 -8 .3<br />
TIPS Jan-18 0.89% 1.59% 1.0 -0 .5 2.4 -2 .1 6.1 -2 .8 11.9 -6 .4 29.5 -8 .3<br />
TIPS Jul-18 0.91% 1.69% 0.9 -0 .6 2.3 -2 .3 5.8 -3 .3 11.2 -7 .3 27.6 -10.5<br />
TIPS Jan-19 1.02% 1.75% 1.0 -0 .5 2.4 -2 .0 6.0 -2 .9 11.6 -6 .4 28.1 -8 .8<br />
TIPS Jul-19 1.06% 1.84% 0.9 -0 .6 2.3 -2 .3 5.7 -3 .4 11.1 -7 .4 26.7 -11.1<br />
TIPS Jan-20 1.12% 1.81% 0.9 -0 .6 2.2 -2 .2 5.5 -3 .4 10.7 -7 .5 25.6 -11.5<br />
TIPS Jan-25 1.56% 1.93% 0.8 -0 .7 2.0 -2 .3 4.8 -3 .8 9.4 -8 .0 21.5 -13.6<br />
TIPS Jan-26 1.61% 1.95% 0.8 -0 .6 1.9 -2 .1 4.6 -3 .5 8.9 -7 .3 20.3 -12.4<br />
TIPS Jan-27 1.66% 1.93% 0.7 -0 .6 1.9 -2 .0 4.5 -3 .4 8.8 -7 .1 20.0 -12.1<br />
TIPS Jan-28 1.69% 1.96% 0.7 -0 .6 1.8 -2 .0 4.2 -3 .5 8.1 -7 .4 18.4 -12.7<br />
TIPS Apr-28 1.75% 1.96% 0.8 -0 .5 2.0 -1 .7 4.8 -2 .7 9.2 -5 .8 20.6 -9 .4<br />
TIPS Jan-29 1.71% 2.03% 0.7 -0 .6 1.8 -1 .9 4.2 -3 .1 8.2 -6 .5 18.6 -11.0<br />
TIPS Apr-29 1.77% 1.97% 0.8 -0 .5 2.0 -1 .7 4.6 -2 .7 9.0 -5 .7 20.1 -9 .4<br />
TIPS Apr-32 1.77% 2.02% 0.7 -0 .5 1.7 -1 .8 4.0 -3 .0 7.8 -6 .2 17.3 -10.7<br />
TIPS Feb-40 1.78% 2.19% 0.5 -0 .5 1.3 -1 .6 2.9 -2 .8 5.6 -5 .9 12.6 -10.4<br />
GBP<br />
P ric in g D a te<br />
15-Jul-10 Term 1 Term 2<br />
3m<br />
6m<br />
12m<br />
Repo <strong>Rate</strong><br />
0.54%<br />
0.55%<br />
0.61%<br />
0.64%<br />
0.74%<br />
S e tt. D a te<br />
16-Jul-10<br />
01-Aug-10 01-Sep-10 18-O ct-10<br />
17-Jan-11<br />
18-Jul-11<br />
Yield BE Real BE Real BE Real BE Real BE Real BE<br />
UKTi Aug-11 -0.09% 0.66% 9.9 9.7 -5 .2 -5 .7 36.4 38.5 110.6 135.2 - -<br />
UKTi Aug-13 -1.25% 2.46% 1.8 0.6 -7.1 -10.6 0.1 -6.8 2.6 -11.8 20.9 -9 .6<br />
UKTi Jul-16 0.19% 2.37% 2.0 0.4 -0 .4 -5 .3 6.8 -2.8 15.3 -4 .3 40.0 -0 .2<br />
UKTi Nov-17 0.37% 2.62% 2 .5 0 .9 5.6 0.6 7 .5 -2.4 14.7 -5 .3 36.7 -4 .0<br />
UKTi Apr-20 0.76% 2.63% 1.6 0.0 0.6 -4 .2 6.1 -3.3 13.2 -5 .8 31.3 -7 .0<br />
UKTi Nov-22 0.93% 2.75% 1.8 0.3 4.2 -0 .2 6.0 -2.7 11.7 -5 .7 27.4 -7 .4<br />
UKTi Jul-24 1.14% 2.77% 1.3 -0 .1 0.8 -3 .3 5.2 -3.0 10.9 -5 .4 25.5 -7 .0<br />
UKTi Nov-27 1.01% 3.06% 1.3 0.1 3.0 -0 .7 4.4 -3.0 8.5 -6 .1 19.6 -9 .5<br />
UKTi Jul-30 0.96% 3.21% 1.0 -0 .1 0.5 -2 .8 3.8 -2.7 8.0 -4 .9 18.6 -7 .0<br />
UKTi Nov-32 0.90% 3.27% 1.0 -0 .1 2.3 -1 .0 3.3 -3.2 6.4 -6 .4 14.8 -10.8<br />
UKTi Jan-35 0.88% 3.32% 0.7 -0 .3 0.3 -2 .7 2.8 -3.3 5.8 -6 .1 13.4 -10.0<br />
UKTi Nov-37 0.79% 3.40% 0.8 -0 .2 1.9 -1 .1 2.6 -3.2 5.1 -6 .4 11.6 -11.0<br />
UKTi Nov-42 0.72% 3.47% 0.7 -0 .3 1.5 -1 .2 2.1 -3.3 4.0 -6 .6 9.1 -11.7<br />
UKTi Nov-47 0.64% 3.54% 0.6 -0 .3 1.3 -1 .2 1.8 -3.2 3.4 -6 .4 7.9 -11.5<br />
UKTi M ar-50 0.63% 3.55% 0.5 -0 .3 1.2 -1 .3 1.6 -3.2 3.1 -6 .4 7.1 -11.6<br />
UKTi Nov-55 0.58% 3.58% 0.5 -0 .3 1.1 -1 .1 1.6 -3.0 3.0 -5 .9 6.9 -10.6<br />
JPY<br />
P ric in g D a te<br />
Repo <strong>Rate</strong><br />
JPY DRI<br />
S e tt. D a te<br />
15-Jul-10<br />
99.235<br />
21-Jul-10<br />
Term 1 Term 2<br />
0.12%<br />
0.12%<br />
99.300<br />
99.200<br />
10-Aug-10<br />
10-Sep-10<br />
3m<br />
0.12%<br />
99.071<br />
21-O ct-10<br />
6m<br />
0.13%<br />
12m<br />
0.14%<br />
99.529 98.900<br />
21-Jan-11<br />
21-Jul-11<br />
Yield BE Yield BE Yield BE Real BE Real BE Real BE<br />
JG BI-1 M ar-14 1.13% -0.93% 4.5 4.4 4.1 3.8 4.7 4.1 26.4 25.2 27.0 24.6<br />
JG BI-2 Jun-14 1.35% -1.13% 4.5 4.4 4.7 4.3 5.9 5.2 27.8 26.3 32.6 29.4<br />
JG BI-3 Dec-14 1.17% -0.88% 3.7 3.5 3.5 2.9 4.0 3.0 21.6 19.5 21.9 17.3<br />
JG BI-4 Jun-15 1.36% -1.01% 1.5 1.2 1.5 0.9 2.5 1.2 21.3 18.7 21.6 16.0<br />
JG BI-5 Sep-15 1.34% -0.98% 3.4 3.1 3.5 2.8 4.4 3.1 20.2 17.5 22.6 16.8<br />
JG BI-6 Dec-15 1.25% -0.86% 3.2 2.9 3.1 2.3 3.7 2.3 18.2 15.4 19.1 13.0<br />
JG BI-7 M ar-16 1.34% -0.93% 3.1 2.8 3.2 2.4 4.0 2.5 18.3 15.4 20.2 13.8<br />
JG BI-8 Jun-16 1.41% -0.96% 3.1 2.7 3.2 2.4 4.1 2.6 18.2 15.0 20.6 13.9<br />
JG BI-9 Sep-16 1.40% -0.92% 3.0 2.6 3.1 2.2 3.9 2.3 17.4 14.1 19.5 12.6<br />
JG BI-10 Dec-16 1.38% -0.87% 2.8 2.5 2.9 2.0 3.7 2.0 16.5 13.1 18.2 10.9<br />
JG BI-11 M ar-17 1.46% -0.92% 2.8 2.4 3.0 2.1 3.9 2.1 16.6 13.0 19.1 11.4<br />
JG BI-12 Jun-17 1.54% -0.96% 2.8 2.4 3.1 2.1 4.1 2.2 16.6 12.8 19.6 11.7<br />
JG BI-13 Sep-17 1.44% -0.82% 2.6 2.2 2.8 1.7 3.6 1.6 15.3 11.3 17.3 8.9<br />
JG BI-14 Dec-17 1.45% -0.79% 2.5 2.1 2.7 1.6 3.5 1.4 14.8 10.7 16.7 8.0<br />
JG BI-15 M ar-18 1.48% -0.78% 2.5 2.0 2.7 1.6 3.5 1.4 14.6 10.4 16.6 7.7<br />
JG BI-16 June-18 1.61% -0.87% 2.5 2.0 2.8 1.7 3.8 1.6 15.1 10.7 18.1 8.7<br />
Source: <strong>BNP</strong> Paribas<br />
Herve Cros / Shahid Ladha 16 July 2010<br />
<strong>Market</strong> Mover, Non-Objective Research Section<br />
38<br />
www.Global<strong>Market</strong>s.bnpparibas.com
GBP: <strong>Market</strong> Downplays Shift to CPI<br />
• Government’s shift to CPI indexation in<br />
pensions causes uncertainty over impact on<br />
private schemes given their complexity.<br />
• Limited market impact given underlying<br />
ALM gap. But changes are material enough to<br />
trigger a significant correction in our view.<br />
• STRATEGY: Sell 30y BE at 3.40% into 30y<br />
syndication – Target 3.10%. Favour 10/30y cash<br />
BE flatteners.<br />
DWP Statement on moving to CPI for Pensions<br />
“On 8 July the Minister of State for Pensions, Steve<br />
Webb MP, made a Written Ministerial Statement to<br />
Parliament which announced the Government’s<br />
intention to move to using the Consumer Price Index<br />
(CPI) as the measure of price inflation for the<br />
purposes of regulating occupational pension<br />
schemes. A statutory minimum requirement will<br />
continue to apply to the revaluation and indexation of<br />
pension rights.<br />
The proposed changes will affect how many deferred<br />
pensions are revalued in future, and how pensions in<br />
payment are increased. The changes apply to<br />
defined benefit rights in occupational pension<br />
schemes, and certain defined contribution rights in<br />
occupational pension schemes. The changes will<br />
affect the statutory minimum requirement for<br />
revaluation and indexation; occupational pension<br />
schemes will still have the freedom to pay more than<br />
the statutory minimum.<br />
In broad terms, a revaluation order is made each<br />
year which sets out the minimum rate at which<br />
occupational pension schemes should generally<br />
revalue deferred pension rights and pay increases on<br />
pensions in payment.<br />
For deferred pension rights, the order tabulates an<br />
overall revaluation percentage relating to each<br />
possible number of complete years between the end<br />
of someone’s pensionable service and their normal<br />
pension age. The order that is in use for any year will<br />
use data on price inflation up to September of the<br />
previous year. For example, the order in use for 2010<br />
uses data on price inflation to the year ending 30<br />
September 2009 based on RPI. The order which will<br />
be in use in 2011 will use data on price inflation to<br />
the year ending 30 September 2010 based on CPI.<br />
The overall percentage that will apply to deferred<br />
pension rights which have been deferred for at least<br />
two complete years, where the relevant years<br />
straddle the change from RPI to CPI, will therefore<br />
be calculated as a combination of percentages based<br />
on RPI and then CPI.<br />
The order in use for 2011 will also be used to<br />
calculate annual increases on pensions in payment<br />
for 2011, and these will be in line with CPI. The<br />
Government expects to publish the order in<br />
November or December 2010.<br />
The Government will bring forward legislation at the<br />
earliest opportunity to ensure that other references to<br />
price inflation in pensions law are consistent with<br />
using CPI as the measure of price inflation from 2011<br />
or as soon thereafter as Parliamentary time allows.<br />
For example, the Guaranteed Minimum Pension<br />
Increase Order that will come into effect in 2011 will<br />
be made on the basis of the CPI figures for the year<br />
to 30 September 2010.<br />
Examples:<br />
The following generalised simplified examples are<br />
provided for illustrative purposes only.<br />
These examples illustrate how these changes could<br />
apply to future calculations of the revaluation and<br />
indexation applying to pension rights, if a pension<br />
scheme adopted the statutory minimum approach.<br />
They would not affect pension payments already<br />
received. They do not deal with issues arising from<br />
contracting out from the State Second Pension. The<br />
detailed rules on revaluation and indexation vary<br />
between pension schemes and can be higher than<br />
the minimum. They also depend on when the<br />
pensionable service took place. Other factors may<br />
affect an individual’s pension entitlement depending<br />
on that scheme’s rules.<br />
A is a pensioner member of a pension scheme. His<br />
pension has been in payment for three years, and he<br />
has been receiving increases related to RPI. From<br />
2011 his future increases will be calculated in relation<br />
to CPI. This does not affect his previous increases.<br />
B is a deferred member of a pension scheme. She<br />
left pensionable service five years ago. When she<br />
reaches normal pension age, her rights will be<br />
revalued in relation to RPI in respect of the first five<br />
years after she left pensionable service, and then in<br />
relation to CPI until normal pension age. Once her<br />
pension has been put into payment, she will receive<br />
annual increases calculated in relation to CPI.<br />
Herve Cros/Shahid Ladha 16 July 2010<br />
<strong>Market</strong> Mover, Non-Objective Research Section<br />
39<br />
www.Global<strong>Market</strong>s.bnpparibas.com
C is an active member of a pension scheme. He is<br />
continuing to accrue new rights. If he continues in<br />
pensionable service until he reaches normal pension<br />
age in (for example) 2015, revaluation will not apply.<br />
Once his pension is in payment, he will receive<br />
annual increases calculated in relation to CPI.<br />
D is an active member of a pension scheme. She will<br />
leave pensionable service in 2013, and will reach her<br />
normal pension age in 2020 and begin to receive her<br />
pension at that time. From 2013 to 2020 her rights<br />
will be revalued in relation to CPI. Once her pension<br />
is put into payment, she will receive annual increases<br />
calculated in relation to CPI.”<br />
Limited market impact of public pension<br />
indexation change…<br />
Public pension funds are believed to be in the order<br />
of around GBP 1trn (on a gilt-discounted basis) and,<br />
to the extent they are largely unfunded and<br />
unhedged, have limited impact on the RPI market<br />
with future PF obligations paid from public coffers.<br />
Local authorities, in contrast, do hold assets against<br />
their PF liabilities but are much smaller (20%) whilst<br />
their index-linked holdings are thought to be relatively<br />
small (< GBP 10bn). Future inflation hedging demand<br />
by these entities will most likely manifest itself in CPI<br />
space, not RPI.<br />
… But complexity over impact on private PFs<br />
The statutory minimum indexation benefit for PF<br />
members, also known as ‘general level of prices in<br />
Great Britain’ – published annually will use CPI not<br />
RPI from September 2010. The impact (on private<br />
pension fund solvency and RPI linked assets) is<br />
highly uncertain as different indexation rules apply to<br />
deferred pensions, pensioners and Guaranteed<br />
Minimum Pensions. Chart 1 illustrates the distribution<br />
of member types according to the Pensions<br />
Regulator. Equally important is the precise proportion<br />
of private sector defined-benefit (DB) pension funds<br />
that are linked to the ‘general level of prices’ without<br />
explicit reference to RPI (or LPI) which is currently<br />
unknown. Individual corporate pension funds will<br />
likely be examining their trust deeds and potentially<br />
holding trustee meetings to analyse the impact of the<br />
proposed changes on their members’ benefits and<br />
solvency levels.<br />
The DWP communiqué on 12 July does provide<br />
some clarity following Steve Webb’s written<br />
statement to the House of Commons regarding the<br />
shift to CPI. It illustrates that, with respect to deferred<br />
members, the proposed changes will only apply to<br />
future valuations. A report by actuaries Lane, Clarke<br />
& Peacock suggests most deferred pensions refer to<br />
the ‘general level of prices’ and thus would be<br />
impacted by the switch to CPI indexation but this is<br />
subject to reference in the Trust Deed. Pensioners<br />
Chart 1: Distribution of Member Types<br />
Pensioners,<br />
36%<br />
Active<br />
Members, 21%<br />
Deferred<br />
Members, 43%<br />
Active Members<br />
Deferred Members<br />
Pensioners<br />
Chart 2: Aggregate Private PF Assets,<br />
Liabilities, Surplus (PPF7800) and Potential<br />
Impact of Legislative Change<br />
200000<br />
150000<br />
100000<br />
50000<br />
0<br />
-50000<br />
-100000<br />
-150000<br />
-200000<br />
Surplus<br />
Assets £m Rhs<br />
Liabilities £m Rhs<br />
Potential Range<br />
of Impact on<br />
Agg. PF Surplus<br />
-250000<br />
Jan-03 Jan-04 Jan-05 Jan-06 Jan-07 Jan-08 Jan-09 Jan-10 Jan-11<br />
Sources: Purple Book 2009 The Pensions Regulator, <strong>BNP</strong> Paribas<br />
1200000<br />
1000000<br />
800000<br />
600000<br />
400000<br />
200000<br />
will switch to CPI indexation as soon as the law is<br />
implemented (likely start in 2011 based on Sep-10<br />
CPI y/y) if there is no explicit reference to RPI (or LPI<br />
linkage) in the trust deed which is not thought to be<br />
the average case. Active members’ liabilities are<br />
linked to salaries, which are typically modelled as<br />
RPI + x% and the proposed legislation does not<br />
change this unless there is a consensual move to<br />
CPI + y% (which may introduce basis risk). At<br />
retirement or deferment, PFs are treated as<br />
described above. We do not purport to provide a<br />
complete overview of pension fund legislation<br />
changes here and would suggest affected<br />
counterparties consult professional legal and pension<br />
fund advice. In this context, we have used a report<br />
titled ‘Red Views – Changes to Pension Indexation’<br />
by Reddington (Consultants) as an information<br />
source.<br />
As of end June-10, aggregate Private PF assets<br />
totalled GBP 901bn vs. liabilities of GBP 923bn,<br />
leaving PF in an aggregate deficit of GBP 21.8bn<br />
based on PPF7800 data – Chart 1. The PPF’s Purple<br />
Book 2009 found the aggregate funding position<br />
would deteriorate by 0.9-1% for each 0.1% rise in<br />
inflation – See Table 1. The RPI/CPI spread is<br />
volatile and very cyclical due to the housing<br />
components, specifically MIPS and Housing<br />
depreciation (Chart 3), whilst RPI’s arithmetic<br />
0<br />
Herve Cros/Shahid Ladha 16 July 2010<br />
<strong>Market</strong> Mover, Non-Objective Research Section<br />
40<br />
www.Global<strong>Market</strong>s.bnpparibas.com
averaging introduces sizable upside bias (0.5%)<br />
relative to the ‘geometric’ CPI. Over 10 years, we find<br />
the RPI/CPI spread averages 71bp vs. 54bp over the<br />
past 20 years but is very sensitive to the start<br />
date/period. Assuming CPI is 0.75% below RPI (on<br />
average) and all private sector pension funds switch<br />
to CPI (unlikely) – we see a maximum impact on the<br />
net funding position in the region of £70bn (which<br />
would be similar to the benefit from PPF’s actuarial<br />
changes in Oct-09). With many private pension funds<br />
unlikely to be included in CPI indexation bracket, at<br />
least in the current state of legislation, the use of<br />
AER (instead of SVR) in MIPS and the encapsulation<br />
of housing related prices eventually in CPI suggest<br />
the gap could be lower over time (subject to a likely<br />
lower bound of 0.50% from formula effect). We<br />
expect the realised impact on aggregate PFs’ net<br />
asset/liability to be closer to half this amount (around<br />
£30-40bn). However, optionality in indexation of<br />
pensions (caps and floors) and maximum of (CPI,<br />
RPI and cap) in cases where the Trust Deed<br />
specifies RPI but is subject to the statutory minimum<br />
requirement (CPI), complicates the issue and under<br />
certain assumptions could even increase pension<br />
fund liabilities (according to Redington).<br />
<strong>Market</strong> downplays Risk of Switch to CPI<br />
Understandably, the announcement from Steve<br />
Webb triggered a correction in (long-end)<br />
breakevens. Uncertainty over the impact on private<br />
sector PFs could cause LDI programmes to be<br />
scaled back or placed on hold, weighing further on<br />
breakevens (and liquidity) near-term as sovereign<br />
supply continues. That said, greater net asset/liability<br />
positions (lower deficits/higher surpluses) tend to<br />
encourage LDI hedging and as a consequence are<br />
associated with higher long-end breakeven levels –<br />
Chart 4. In fact, certain LDI related counterparties<br />
have actually increased RPI exposure following the<br />
initial setback against our expectations although<br />
flows are reversing after the UKTi-22 auction.<br />
In Table 2, we estimate LDI demand using the<br />
duration gap (or shortfall) between aggregate PF<br />
assets and liabilities (from PPF data) using typical<br />
actuarial assumptions and liabilities. With respect to<br />
supply, we duration-weight the total market<br />
capitalisation of GBP sovereign and corporate bonds<br />
for both nominal and index-linked markets. Finally,<br />
we combine our demand/supply analysis to gauge<br />
the adequacy of inflation supply to meet pension<br />
funds’ requirements. Relative to the market<br />
capitalisation of outstanding GBP linkers (all RPIlinked),<br />
demand outstrips outstanding market<br />
capitalisation by more than 3 times (compared to<br />
1.15 for nominals). We estimate at least GBP 110bn<br />
(or 57%) of the GBP linker market (by market<br />
capitalisation) is held by DB pension funds (at end-<br />
March 2009) based on Purple Book 2009 – Table 3.<br />
Table 1: Sensitivities of PF Deficits to Changes<br />
in Assumptions & <strong>Market</strong> Prices<br />
20<br />
15<br />
10<br />
5<br />
0<br />
-5<br />
-10<br />
Change in Asumption<br />
Impact (as of Mar-09)<br />
Approximate Cash<br />
Impact on Deficit<br />
↑ Longevity by 2y ↑ 5% in Liabilities ~ £45bn<br />
↑ Inflation by 0.1% ↑ 1% in Liabilities ~ £9bn<br />
↓ Discount Yield by 0.1% ↑ 2% in Liabilities ~ £18bn<br />
↓ Discount Yield by 0.1% ↑ 0.4% in Assets ~ £3.5bn<br />
↓ Equities by 1% ↓ 0.4% in Assets ~ £4.4bn<br />
1% ? Discount Yield = 40% ? in Equities<br />
Chart 3: UK RPI – CPI y/y vs. Housing RPI<br />
% RPI-CPI yoy<br />
%<br />
25<br />
4<br />
RHS<br />
RPI Housing yoy<br />
-15<br />
Jan-90 Jan-93 Jan-96 Jan-99 Jan-02 Jan-05 Jan-08<br />
Chart 4: Aggregate Private PF Surplus vs. 15y+<br />
UK Cash Breakeven<br />
200000<br />
160000<br />
120000<br />
80000<br />
40000<br />
0<br />
-40000<br />
-80000<br />
-120000<br />
-160000<br />
-200000<br />
Aggregate PF Surplus (PPF, 7800)<br />
15y+ Gilt BE<br />
-240000<br />
Mar-03 Mar-04 Mar-05 Mar-06 Mar-07 Mar-08 Mar-09 Mar-10<br />
Table 2: UK PF ALM Gap vs. Bond <strong>Market</strong><br />
UK Private Pension A/L Structure<br />
Assets (£, bn) Liabilities (£, bn) Surplus / (Deficit) (£, bn)<br />
Duration 5 18<br />
Nominal (bn) 901 923 -21.8<br />
Risk 4507 16619<br />
Duration Gap -12112<br />
Hedge 20y Equivalent 673<br />
Mkt Cap 20y Equiv. (Nominal)<br />
Demand/Supply Ratio<br />
582<br />
(Sov + Corp Nominal Bonds)<br />
116%<br />
Mkt Cap 20y Equiv. (Linkers)<br />
Demand/Supply Ratio<br />
212<br />
(Sov + Corp Index-linked Bonds)<br />
318%<br />
Table 3: PF Asset Allocation & <strong>BNP</strong>P Estimates<br />
Asset Allocation 2007 2008 2009<br />
Equities 59.5% 53.6% 46.4%<br />
Gilts & Fixed <strong>Interest</strong> 29.6% 32.9% 37.1%<br />
Insurance Policies 0.8% 1.1% 1.4%<br />
Cash & Deposits 2.3% 3.0% 3.9%<br />
Property 5.2% 5.6% 5.2%<br />
Other Investments 2.5% 3.8% 4.5%<br />
Detail Equity & Bond Holdings<br />
Weighted Average Share<br />
(2009)<br />
Approximate<br />
Holdings<br />
3<br />
2<br />
1<br />
0<br />
-1<br />
-2<br />
-3<br />
-4<br />
4.0<br />
3.6<br />
3.2<br />
2.8<br />
2.4<br />
2.0<br />
Proportion of<br />
Mkt Cap.<br />
Gilts & Fixed <strong>Interest</strong><br />
UK Gilts 29.0% 98.6 16.8%<br />
Corporate Bonds 38.3% 130.2 28.2%<br />
Index-linked Gilts 32.6% 110.8 57.1%<br />
Equities<br />
UK Equities 44.2%<br />
Overseas Equities 53.8%<br />
Sources: Purple Book 2009, The Pensions Regulator, <strong>BNP</strong> Paribas<br />
Herve Cros/Shahid Ladha 16 July 2010<br />
<strong>Market</strong> Mover, Non-Objective Research Section<br />
41<br />
www.Global<strong>Market</strong>s.bnpparibas.com
The legislative changes to CPI indexation from<br />
RPI could potentially impact 80% of defined<br />
benefit pension fund members but is likely to be<br />
much lower due to explicit RPI indexation in trust<br />
deeds (40%?). The market impact of the news has<br />
been very limited with 30y cash breakevens now<br />
close to/above levels seen on 7 th July. We expect to<br />
see breakeven weakness in the summer as the<br />
implications of the legislative change to CPI are<br />
calculated and supply continues. Nevertheless, there<br />
is no liquid UK inflation hedging alternative to RPI<br />
currently – RPI/CPI basis quoted at -5/-50bp (-30bp<br />
mid) following the announcement. Furthermore,<br />
given the size of the remaining ALM gap with respect<br />
to inflation, we do not expect LDI demand for RPIlinked<br />
assets to fall dramatically. Rather, the nature<br />
of future UK inflation hedging demand will likely<br />
evolve over time and become index specific<br />
assuming the creation of a CPI-linked market.<br />
Sell 30y BE, but i-40s Supply will be the Real Test<br />
Beyond structural uncertainties, mid-summer months<br />
typically exhibit limited LDI demand, particularly<br />
August with (long) 30y BE total returns negative for<br />
each of the past five years – Table 4. That said, 2010<br />
is not a typical year given the abnormally poor Q2<br />
performance of breakevens. Summer discounting<br />
should limit the potential for further upside surprises<br />
to UK inflation data, although June RPI surprised to<br />
the upside yet again.<br />
Ongoing uncertainty may limit appetite for RPI-linked<br />
assets while the UK DMO still has to issue £26bn of<br />
RPI linkers this fiscal year. With long-end breakevens<br />
returned to their levels pre-announcement, we see a<br />
material risk of a long-end breakeven correction<br />
ahead. We expect a break below their 3.30-3.80%<br />
‘normal’ range on 30y cash (Chart 6), if not targeting<br />
3% (range is typically 20bp higher in swap). We enter<br />
a new trade: Sell UKTi-40 breakeven at 3.40%<br />
targeting 3.10% with a stop at 3.46%. Carry<br />
of-0.6/-2.2/-3.2bp at 1/2/3m. The syndicated UKTi-40<br />
issue in the second half of July will be the main test.<br />
This said with GBP 34bn every year, the UK DMO<br />
can build up a CPI-linked programme, in addition to<br />
its RPI lines. RPI-linked assets remain the only<br />
available liquid solution and the correlation between<br />
RPI and CPI, whilst unstable, is 70% since 1990.<br />
Finally, real yields are historically low but the same is<br />
true for nominal yields and (at least) cash inflation<br />
breakevens compare relatively well with past history<br />
on RPI and long-term inflation expectations from our<br />
economists (both around 3% y/y). At 2.60-70%, 10y<br />
breakevens look even cheaper after the concession<br />
into the decent £1.2bn UKTi-22 tap and we like<br />
10/30y BE flatteners into 30y supply – Chart 7.<br />
Real/nominal ASW discounts have proved volatile<br />
and the very flat/inverted discount surface suggest<br />
most value up to 20y maturities (Chart 8).<br />
3.46<br />
3.44<br />
3.42<br />
3.40<br />
3.38<br />
3.36<br />
3.34<br />
5: 30y UKTi RY & BE around Announcement<br />
3.32<br />
01-<br />
Jul<br />
02-<br />
Jul<br />
30y UKTi BE<br />
30y UKTi RY<br />
03-<br />
Jul<br />
04-<br />
Jul<br />
05-<br />
Jul<br />
06-<br />
Jul<br />
Steve Webb CPI<br />
Announcement<br />
07-<br />
Jul<br />
08-<br />
Jul<br />
09-<br />
Jul<br />
10-<br />
Jul<br />
DWP provides<br />
more details<br />
Table 4: 30y BE Total Return (Dur-adj) by Qtr<br />
11-<br />
Jul<br />
12-<br />
Jul<br />
13-<br />
Jul<br />
14-<br />
Jul<br />
15-<br />
Jul<br />
0.84<br />
0.82<br />
0.8<br />
0.78<br />
0.76<br />
0.74<br />
0.72<br />
0.7<br />
0.68<br />
0.66<br />
0.64<br />
16-<br />
Jul<br />
UKTI35 BE Tot Ret<br />
Dur Adj<br />
Apr May Jun Jul Aug Sep Oct Nov Dec<br />
2003 0.3% -1.4% 2.4% 1.7% -1.0% 0.0% 2.0% -0.3% 1.4%<br />
2004 2.7% 1.1% -1.3% -1.5% -1.1% -0.8% -1.5% -1.1% 1.7%<br />
2005 -3.2% -2.9% -0.3% 1.1% -1.0% 2.1% 0.6% -2.0% -0.9%<br />
2006 2.1% -1.6% 2.5% 0.3% -1.9% -0.7% -0.7% 0.6% 1.9%<br />
2007 1.1% 1.4% 4.5% -3.2% -1.0% 2.2% -2.1% -0.1% -0.5%<br />
2008 3.3% 3.7% 6.3% -6.1% -1.6% -4.4% -5.7% -12.0% -5.6%<br />
2009 4.2% 10.0% -3.8% 1.2% -9.5% -1.5% 5.2% -1.2% 8.3%<br />
2010 -3.6% -5.8% -3.8%<br />
5y Avg (ex. 2010) 1.5% 2.1% 1.8% -1.3% -3.0% -0.5% -0.6% -2.9% 0.6%<br />
4.40<br />
4.00<br />
3.60<br />
3.20<br />
2.80<br />
2.40<br />
110<br />
100<br />
90<br />
80<br />
70<br />
60<br />
50<br />
40<br />
30<br />
20<br />
10<br />
0<br />
70<br />
60<br />
50<br />
40<br />
30<br />
20<br />
10<br />
% of + ve Ret 80% 60% 60% 60% 0% 40% 40% 20% 40%<br />
2.00<br />
1.60<br />
1.20<br />
0.80<br />
0.40<br />
Chart 6: 30y UKTi RY, NY & BE<br />
30y Generic UK RY<br />
30y Generic UK NY<br />
30y Generic UK BE<br />
0.00<br />
Jan-05 Jan-06 Jan-07 Jan-08 Jan-09 Jan-10<br />
Chart 7: UKTi Real, Nom ASW & Discount<br />
20<br />
10<br />
0<br />
-10<br />
-20<br />
-30<br />
-40<br />
-50<br />
UKTI22 / UKTI37 Real<br />
UKTI22 / UKTI37 Nominal Rhs<br />
UKTI22 / UKTI37 Breakeven<br />
-60<br />
Apr-09 Jul-09 Oct-09 Jan-10 Apr-10 Jul-10 Oct-10<br />
8: Front, 10y & 30y Real/Nom ASW Discount<br />
0<br />
Jan-10 Feb-10 Mar-10 Apr-10 May-10 Jun-10 Jul-10<br />
Sources: <strong>BNP</strong> Paribas<br />
UKTI13 R/N ASW Discount<br />
UKTI22 R/N ASW Discount<br />
UKTI37 R/N ASW Discount<br />
5.20<br />
4.80<br />
4.40<br />
4.00<br />
3.60<br />
3.20<br />
70<br />
60<br />
50<br />
40<br />
30<br />
20<br />
10<br />
0<br />
Herve Cros/Shahid Ladha 16 July 2010<br />
<strong>Market</strong> Mover, Non-Objective Research Section<br />
42<br />
www.Global<strong>Market</strong>s.bnpparibas.com
Europe ITraxx Credit Indices<br />
• Outright: MAIN remains wide vs. equity and<br />
volatility and 110 acts as a strong resistance. It<br />
could be broken if the earnings’ season is<br />
sufficiently strong to make bears throw the<br />
towel; not a done deal given the poor outlook<br />
given by the latest macro numbers. Best<br />
strategy for the moment: play the 110-120 range.<br />
• SUB vs. SEN: This strategy remains quite<br />
hazardous for us but the very short-term could<br />
help FIN SEN to further outperform MAIN. To<br />
play the outperformance of Banks vs. MAIN, we<br />
propose a basket of four SUB CDS (BACR,<br />
RABO, ACAFP and ISPIM) against MAIN; the<br />
trade has a more upside, less downside and<br />
same carry.<br />
• SUB vs. SEN: There is no momentum in this<br />
trade but 1/ our expectation that systemic risk<br />
will further decrease and 2/ the street position<br />
on (callable) LT2 make us expect further<br />
decompression FIN SEN / SUB. We keep our<br />
“Long risk FIN SEN x1.5 / Short risk FIN SUB”.<br />
• HVL vs. MAIN: We stick to our view that<br />
there is little to do with HVL. For those who want<br />
to play ‘free’ options on Cyclicals, prefer playing<br />
it via our basket of single-names vs. MAIN or<br />
NON-FIN indices which did not underperform<br />
this week despite the rally.<br />
• XO vs. MAIN: Nothing to do here except for<br />
bulls who can play long risk XO / short risk<br />
MAIN with an aggressive ratio (2 or 3); bears<br />
should stay away from the pair-trade and buy<br />
protection on XO outright.<br />
• Curves: Indices’ curves continue to steepen<br />
and offer now limited value beyond the carry,<br />
which remains substantial; the only exception is<br />
FIN SEN, which is trading 3-4bp too flat relative<br />
to the 5y. We keep all our 5/10 steepeners on.<br />
Outright:<br />
Although we are ending this week not far from where<br />
we were at the end of last week, we managed to test<br />
110, the bottom of the recent range in the middle of<br />
the week but never managed to close tighter 113.<br />
Actually, buyers emerged every time we approached<br />
what could become soon a strong resistance level.<br />
Relative to equities, MAIN has shown a stronger<br />
enthusiasm to follow equities on the bearish side<br />
than on the bullish one.<br />
Table 1: Curves’ levels and changes<br />
5y 5/10y 1W Chg 1M Chg<br />
MAIN s13 113 +4.5 +1.5 +6<br />
MAIN s12 109 +9 +2 +6<br />
SEN s13 132 +4 +1 +4<br />
SEN s12 129 +6 +3 +2<br />
SUB s13 203 +2 +2 +6<br />
SUB s12 198 +3 +2 +3<br />
HVL s13 171 +6 +11 -2<br />
HVL s12 152 +10 +15 -3<br />
XO s13 514 -15 +10 +15<br />
XO s12 476 -10 +15 +10<br />
Source: <strong>BNP</strong> Paribas<br />
Chart 1: MAIN vs. EUROSTOXX 600 since 1-Apr<br />
140<br />
130<br />
120<br />
110<br />
100<br />
iTraxx MAIN<br />
EUROSTOXX 600<br />
90<br />
Start of the<br />
decoupling<br />
80<br />
Establishment of the<br />
110 resistance.<br />
70<br />
1/4 15/4 29/4 13/5 27/5 10/6 24/6 8/7<br />
Source: <strong>BNP</strong> Paribas<br />
Chart 2: MAIN vs. model (SXXP; V2X)<br />
155<br />
145<br />
135<br />
125<br />
115<br />
105<br />
95<br />
85<br />
75<br />
65<br />
15/4 29/4 13/5 27/5 10/6 24/6 8/7<br />
Source: <strong>BNP</strong> Paribas<br />
Diff. traded index - model<br />
Model (Eq + Vol) with static coefficients (3M)<br />
MAIN<br />
Over a longer timeframe, MAIN remains quite wide<br />
relative to both the EUROSTOXX 600 and VSTOXX<br />
indices. On a 3-months basis, it is 5bp wider than the<br />
level suggested by an equity + volatility model (chart<br />
2); on a 6-months basis, the cheapness of MAIN is of<br />
c.20bp.<br />
232<br />
237<br />
242<br />
247<br />
252<br />
257<br />
262<br />
267<br />
272<br />
20<br />
15<br />
10<br />
5<br />
-<br />
-5<br />
-10<br />
-15<br />
-20<br />
Pierre Yves Bretonniere 16 July 2010<br />
<strong>Market</strong> Mover, Non-Objective Research Section<br />
43<br />
www.Global<strong>Market</strong>s.bnpparibas.com
The question is whether the 110 resistance can<br />
be broken on a sustainable basis; for us, it could<br />
only happen if a majority of bears throw the towel<br />
after a strong rally in equities. Can it happen in the<br />
current macro environment? We have some doubts<br />
and even if the tone of the earnings season<br />
remains on the positive side (so far, the three blue<br />
chips which reported, Alcoa, Intel and JPM, came<br />
above forecasts), the outlook can not be<br />
promising enough to trigger an equity rally that<br />
sends MAIN below 100.<br />
What’s the call? The only strategy which makes<br />
sense to us for the moment is to play the 110-120<br />
range.<br />
MAIN vs. FIN SEN<br />
The context remains favourable to FIN indices, SEN<br />
in particular, given the decrease in systemic risk and<br />
the progressive switch of the focus onto the earnings<br />
and the macro economic data. FIN SEN continues to<br />
outperform MAIN on a beta-adjusted basis as<br />
indicated on chart3. That being said, the newsflow on<br />
sovereigns –we had this week the downgrade by<br />
Moody’s of Portugal and of 8 Portuguese financials<br />
institutions – continues to have a bigger impact on<br />
FIN indices than on MAIN.<br />
What’s the call?<br />
Playing FIN SEN vs. MAIN remains for us throwing a<br />
coin in the air given the number of moving parts; in<br />
the very short term, we nonetheless feel two factors<br />
could play in favour of FIN SEN: 1/ upcoming results<br />
of the stress tests than could allow some further<br />
performance of Financials and 2/ stronger<br />
“psychological” support on MAIN at 110 than on FIN<br />
SEN at 130.<br />
In this backdrop, we would rather play a basket of the<br />
strongest banks that trade wide on a historical basis<br />
vs. MAIN. For example, the basket (2 x BACR SUB,<br />
1 x ACAFP SUB, 2.5 x RABO SUB and 1.5 x ISPIM<br />
SUB) vs. 10 x MAIN offers 1/ similar pick-up and 2/<br />
more upside in a rally and 3/ less downside in the<br />
sell-off.<br />
Chart 3: FIN SEN vs. MAIN since 1/1/10<br />
FIN SEN<br />
230<br />
210<br />
190<br />
170<br />
150<br />
130<br />
110<br />
90<br />
70<br />
50<br />
FIN SEN Wide<br />
Source: <strong>BNP</strong> Paribas<br />
FIN SEN Tight<br />
y = 1.6645x - 42.21<br />
R 2 = 0.9541<br />
50 75 100 125 150<br />
MAIN<br />
Chart 4: Basket FIN vs. MAIN<br />
-<br />
40<br />
30<br />
20<br />
10<br />
-10<br />
-20<br />
-30<br />
7/09 8/09 9/09 10/09 11/09 12/09 1/10 2/10 3/10 4/10 5/10 6/10 7/10<br />
Source: <strong>BNP</strong> Paribas<br />
Chart 5: FIN SEN - MAIN<br />
-<br />
70<br />
60<br />
50<br />
40<br />
30<br />
20<br />
10<br />
-10<br />
-20<br />
07/09 08/09 09/09 10/09 11/09 12/09 01/10 02/10 03/10 04/10 05/10 06/10<br />
Source: <strong>BNP</strong> Paribas<br />
Last<br />
Pierre Yves Bretonniere 16 July 2010<br />
<strong>Market</strong> Mover, Non-Objective Research Section<br />
44<br />
www.Global<strong>Market</strong>s.bnpparibas.com
SEN vs. SUB<br />
There has been no strong move in SUB/SEN ratio<br />
this week; at the time of writing FIN SEN and SUB<br />
indices are both tighter by 5bp w-o-w, signalling<br />
some decompression. In cash, the move is very<br />
similar with iBoxx Financials SEN and LT2 both<br />
tighter by 6bp. See chart 7 and 8. In financials, the<br />
major move has been the outperformance of T1<br />
(+1.9pt in price or 71bp of spread tightening) and to a<br />
lower extent UT2 (+0.7pt in price or 23bp in the<br />
spread).<br />
What’s the call?<br />
As already mentioned above, the potential for further<br />
tightening in FIN is probably fairly limited but it should<br />
benefit from the further decrease in systemic risk; we<br />
see the potential even more limited for the SUB<br />
index, less systemic, and still subject to the long<br />
position of dealers on callable LT2 and to the<br />
attractive level of basis on both bullet and callable<br />
bonds.<br />
For this reason, we think there is more<br />
decompression SUB/SEN to come should the market<br />
remain constructive (less systemic, more basis<br />
players).<br />
HVL vs. MAIN<br />
There has been no momentum at all in the HVL /<br />
MAIN relationship this week; the ratio between the 2<br />
indices stands at 1.49 for more than a week now.<br />
Our view remains that the different categories of<br />
names within HVL (consumer/retail, PIIGS-related<br />
and highly-cyclical credits) make the call on the index<br />
hazardous, unless being very bearish or very bullish<br />
on the market.<br />
What’s the call?<br />
Our medium-term view remains Constructive on HVL<br />
PIIGS-related names (which are Utilities and<br />
Telecoms) vs. market, Neutral on HVL<br />
consumer/retail vs. market and bearish on HVL<br />
highly-cyclical names vs. market; these 3 diverging<br />
views make us Neutral on HVL vs. MAIN.<br />
Chart 6: SUB/SEN ratio for iTraxx CDS indices<br />
2.00<br />
1.90<br />
1.80<br />
1.70<br />
1.60<br />
1.50<br />
iTraxx Sub / Sen (s13)<br />
Q1 (6m)<br />
Median (6m)<br />
Q3 (6m)<br />
1.40<br />
7/09 8/09 9/09 10/09 11/09 12/09 1/10 2/10 3/10 4/10 5/10 6/10 7/10<br />
Source: <strong>BNP</strong> Paribas<br />
Chart 7: SUB/SEN ratio for iBoxx Cash indices<br />
2.40<br />
2.30<br />
2.20<br />
2.10<br />
2.00<br />
1.90<br />
1.80<br />
1.70<br />
1.60<br />
1.50<br />
7/09 8/09 9/09 10/09 11/09 12/09 1/10 2/10 3/10 4/10 5/10 6/10<br />
Source: <strong>BNP</strong> Paribas<br />
Chart 8: HVL vs. MAIN history<br />
220<br />
200<br />
180<br />
160<br />
140<br />
120<br />
100<br />
80<br />
60<br />
iBoxx LT2/SEN ratio (OAS)<br />
1/09 3/09 5/09 7/09 9/09 11/09 1/10 3/10 5/10 7/10<br />
Source: <strong>BNP</strong> Paribas<br />
DJITX13 MST DISCONT<br />
DJITX13 HVL DISCONT<br />
490<br />
440<br />
390<br />
340<br />
290<br />
240<br />
190<br />
140<br />
90<br />
Note that our basket short Mittal / Lafarge / Holcim /<br />
Akzo / Schneider vs. NON-FIN has not lost a single<br />
bp this week despite the tightening of the market and<br />
is still a very good option for us.<br />
Pierre Yves Bretonniere 16 July 2010<br />
<strong>Market</strong> Mover, Non-Objective Research Section<br />
45<br />
www.Global<strong>Market</strong>s.bnpparibas.com
XO vs. MAIN<br />
Last week, we were bullish MAIN and XO, although<br />
for different reasons (decrease in systemic risk /<br />
bullish market for MAIN and search for Yield / bullish<br />
market for XO) and the 2 indices performed roughly<br />
in line with their 1-month beta (4x)…marginal<br />
compression though. In cash, the compression trend<br />
is identical and the ratio between the spreads of the<br />
High-Yield cash index (OAS+724) and the High-<br />
Grade Non-financials one (OAS+143) has dropped to<br />
an historical low (5.1). Also, note that in terms of<br />
cash price, the High-Yield index gained 1.9pt this<br />
week while iBoxx Non-financials lost 0.1pt.<br />
What’s the call?<br />
Chart 9: XO / MAIN ratio history<br />
7.50<br />
XO / MAIN (DISCONT SERIES)<br />
7.00<br />
6.50<br />
6.00<br />
5.50<br />
5.00<br />
4.50<br />
4.00<br />
3.50<br />
7/09 8/09 9/09 10/09 11/09 12/09 1/10 2/10 3/10 4/10 5/10 6/10 7/10<br />
Source: <strong>BNP</strong> Paribas<br />
Chart 10: MAIN 5/10y bang in line with its 5y<br />
The XO/MAIN is likely to be very directional from<br />
here; MAIN could struggle to break 110 while XO has<br />
ample room to tighten further should 1/ the earnings<br />
continue to print above expectations, 2/ equities<br />
perform well and 3/ the new High-Yield new issue<br />
market stomach the pipeline.<br />
5/10y<br />
20<br />
10<br />
0<br />
-10<br />
60<br />
80<br />
100<br />
120<br />
140<br />
5y<br />
Bulls should play long risk XO / short risk MAIN with<br />
an aggressive ratio (2 or 3).<br />
Bears should stay away from this pair trade and buy<br />
protection on XO outright.<br />
Those who believe decompression is going to be the<br />
name of the game can also consider a<br />
decompression option strategy via receivers (page<br />
9).<br />
Update on Curves<br />
This week, all 5/10y curves massively steepened,<br />
sending all High-grade curves (MAIN, HVL, FIN SEN<br />
and SUB) in the positive territory; XO s13 and s12<br />
curves remain inverted (by 15bp and 10bp) but have<br />
well performed since the trough experienced 10 days<br />
ago (-50bp in s13).<br />
Most 5/10s look now fairly consistent with the level of<br />
the 5y; the only exception is FIN SEN which could<br />
trade 3bp steeper, i.e. at 7bp for an outright 5y at<br />
132. See charts 10 and 11.<br />
-20<br />
5/10Y MAIN (lhs)<br />
180<br />
5Y MAIN (rhs inverted)<br />
-30<br />
200<br />
3/09 5/09 7/09 9/09 11/09 1/10 3/10 5/10 7/10<br />
Source: <strong>BNP</strong> Paribas<br />
Chart 11: FIN SEN 5/10y too flat by c.3.5bp<br />
5/10y<br />
17<br />
60<br />
15<br />
80<br />
13<br />
11<br />
100<br />
9<br />
120<br />
7<br />
5<br />
140<br />
3<br />
160<br />
1<br />
180<br />
-1<br />
5/10Y FIN SEN (lhs)<br />
-3<br />
5Y FIN SEN (rhs inverted)<br />
200<br />
3/09 5/09 7/09 9/09 11/09 1/10 3/10 5/10 7/10<br />
Source: <strong>BNP</strong> Paribas<br />
160<br />
5y<br />
What’s the call?<br />
The positive momentum is unlikely to make curves<br />
diverge from their steepening trend; there are not any<br />
more screaming buys when compared to the outright<br />
(at the exception of FIN SEN) but remain good carry<br />
trades with limited downside.<br />
For references, the monthly carry (in breakeven)<br />
provide by MAIN, FIN SEN, SUB and XO is of 1.5bp,<br />
1.6bp, 2.3bp and 6.9bp.<br />
We keep all our steepeners open.<br />
Pierre Yves Bretonniere 16 July 2010<br />
<strong>Market</strong> Mover, Non-Objective Research Section<br />
46<br />
www.Global<strong>Market</strong>s.bnpparibas.com
Technical Analysis – <strong>Interest</strong> <strong>Rate</strong>s & Commodities<br />
Bond & Short-Term Contracts<br />
• Europe: Still a bottoming/up tone around key 2.559 (LT falling wedge sup) sustained by doji bottom reversal<br />
• US: Wide bottom H&S scenario remains possible from 2.90 area but needs to break above ST falling wedge<br />
• Short-term contracts u0: MT toppish tone on Euribor (Top H&S?) while ED is still above its ST 61.8%<br />
Equities & Commodities<br />
• WTI (Cl1): Stalling below 78.12/40 (LT rising channel support/ST 61.8%) & 79.38 top, keys to resume MT rise<br />
• Equity markets: <strong>Market</strong>s remain consolidative MT but with a ST up bias still developing improving MT picture<br />
US 10y: Down within ST falling wedge but bottoming on 2.90 support area MT Trend: Consolidative Range: 2.95/3.15<br />
Last correction since 4.01 April top sent it 2.458 3.311<br />
below 3.104 (Oct ’09 low) & 3.022 (LT 50%),<br />
opening the way for further weakness within<br />
the current ST falling wedge (2.774/3.049)<br />
towards the key 2.789 (LT 61.8%) level.<br />
However, if a ST rise now develops from the<br />
current 2.879 low, this could be analysed as<br />
the potential 2 nd shoulder’s low of a wide LT<br />
bottom Head & Shoulders with a potential<br />
neckline at 3.97.<br />
First negative step would be a break above<br />
3.049 (ST falling wedge res), with<br />
resistances then at 3.213 (61.8%), 3.311,<br />
3.444 & 3.578 (ST 38.2, 50 & 61.8%).<br />
Tech Snapshot<br />
- Within a ST falling wedge<br />
- Perhaps building LT Head & Shoulders<br />
<strong>Strategy</strong>: Aggressive could retry small<br />
short on 2.90 to play H&S. S/L 2.84.<br />
Aggressive will sell ST wedge resistance<br />
break<br />
UK/EUR 10y bond: Bias weak below 83.5/86.4 area for 63/66 MT Trend: Toppish/weak Range: 68.0/80.0<br />
Break above 81.4 (weekly LT triangle res) in 45.7 103.2<br />
February opened the way up for 115.8 (2005<br />
top) but it stalled on critical 103.2 (LT<br />
61.8%) and LT rising channel resistance<br />
(now 114.8) & bearish divergences printed<br />
on weekly RSI then favoured weakness.<br />
The risk still seems to extend current<br />
consolidation given 83.5/86.4 (2-dip neckline<br />
& ST rising channel support) break within a<br />
possible falling wave “4” for a move towards<br />
73.9 (weekly LT rising channel support) and<br />
perhaps then 59.3/63.0 (MT 38.2% & & 2-<br />
dip theoretical target). However, watch slight<br />
rising divergences appearing which could<br />
favour a ST rebound now.<br />
Tech Snapshot<br />
- Stalled on LT 61.8%<br />
- Back below LT triangle resistance<br />
- LT weekly rising channel support tested<br />
- Top 2-dip neckline at 83.5 broken<br />
STRATEGY: Bearish sold 83.5/85.3 with ½<br />
covered 70 & ½ for 66 & S/L 77 now<br />
Christian Sené 16 July 2010<br />
<strong>Market</strong> Mover, Non-Objective Research Section<br />
47<br />
www.Global<strong>Market</strong>s.bnpparibas.com
Germany 10y: Weekly/daily bottom doji reversals still favour upside MT Trend: Down/Bottoming Range: 2.60/2.80<br />
Decisive break below 2.849 (2009 low) in 2.389 3.00<br />
May allowed it to reach LT falling wedge<br />
support at 2.559 around which it has been<br />
bottoming for a few weeks.<br />
The bottom doji reversal drawn on weekly &<br />
daily charts still allows an attempt to develop<br />
a ST rising bias towards 2.95/2.977 (ST<br />
61.8% & MT 38.2%). First step would be a<br />
decisive break above 2.61 (ST falling wedge<br />
res) with intermediates then on 2.778/2.787<br />
(ST 38.2% & last top) & 2.864 (ST 50%).<br />
However, the MT bias will remain down<br />
oriented below 3.00 (LT falling wedge res).<br />
Tech Snapshot<br />
- Within MT & LT falling wedges<br />
- Daily/weekly doji bottom reversal printed<br />
<strong>Strategy</strong>: Retried small short on 2.55 area,<br />
S/L 2.495, for 2.80/90. Bearish could add<br />
short on 2.61 breakout<br />
UK 10y: Key MT 61.8% now broken slightly but has ST bottoming tone MT Trend: Down/bottoming Range: 3.35/3.55<br />
<strong>Market</strong> stalled in February below 4.38 (LT<br />
61.8%) and then fell sharply with a break<br />
seen first below the top Head & Shoulders<br />
neckline & then below the LT rising wedge.<br />
3.456 (LT 61.8% & H&S target) has now<br />
been broken slightly with 3.354 (October<br />
low) reached, around which it is trying to<br />
bottom with a doji bottom reversal drawn & a<br />
possible daily 2-bottom to be drawn with a<br />
neckline at 3.404. Rising divergences on<br />
2.933 3.805<br />
daily RSI still support such a ST<br />
bottoming/up scenario. A neckline break<br />
would call for 3.50 area initially.<br />
Tech Snapshot<br />
- Bottoming below LT 61.8% (3.465)<br />
- Doji bottom reversal & rising divergences<br />
<strong>Strategy</strong>: Bearish sold small 3.30/35, S/L<br />
3.26, for 3.50/60. Add above 3.404<br />
S&P: ST rebound to extend if ST falling wedge is now broken MT Trend: Consolidative Range: 1065/1140<br />
The S&P remains consolidative on a MT 1008/10
Trade Reviews<br />
Options, Money <strong>Market</strong> and Bond Trades – Tactical & Strategic Trades<br />
This page summarises our main tactical (T) and strategic (S) trades. The former focus on short-term horizons (a few weeks)<br />
allowing one to play any near-term corrections within a defined trend, while the latter rely on a medium-term assumed trend.<br />
For each trade we provide the expected target and the recommended stop loss.<br />
Current* Targets Stop Entry<br />
Closed Strategies<br />
USD Spread Fly Sell 3y ASW Buy 5y ASW Sell 10y ASW<br />
Trade closed (12/7). PnL: EUR +21k.<br />
28.0 6.0 13.1<br />
(06-Jul)<br />
Carry<br />
/ mth<br />
Risk**<br />
P/L<br />
(ccy/Bp)<br />
10k/01 USD +26k<br />
+2.6bp<br />
New Strategies<br />
USD Spread Fly Buy 3Y ASW Sell 5Y ASW Buy 7Y ASW<br />
Auction trends indicate that this spread fly has a strong downward bias in the days<br />
after the 3y auction. From an RV perspective, the fly is also at the high end of its<br />
recent range.<br />
10.5<br />
(T)<br />
7.0 13.0 10.125<br />
(13-Jul)<br />
10k/01 USD -4k<br />
-0.4bp<br />
Sell 30y UK Breakeven<br />
We expect a break below the 3.30-3.80% ‘normal’ range on 30y cash BE following<br />
the switch from RPI to CPI indexation for pension funds and ahead of 30y supply.<br />
We target 3.10%.<br />
OATEI Flattener Buy OATei 1.1% 2022 Sell OATei 2.25% 2020<br />
Spread is steep relative to OAT & OATei curves. We expect a correction in the<br />
coming two weeks.<br />
340.0<br />
(T)<br />
23.0<br />
(T)<br />
310.0 346.0 340.0<br />
(15-Jul)<br />
19.0 29.0 26.5<br />
(15-Jul)<br />
-0.6bp<br />
10k/01 GBP +0k,<br />
+0bp<br />
+0.2bp 20k/01 EUR +70k<br />
+3.5bp<br />
Existing Strategies<br />
Yield Curves<br />
EUR Flattener Receive EUR 1M-fwd 2s10s<br />
Asymmetric near-term response to "gradual" phasing out of unconventional<br />
policy/liquidity measures.<br />
150.8<br />
(T)<br />
115.0 200.0 184.8<br />
(04-Mar)<br />
-3bp 10k/01 EUR<br />
+340k<br />
+34bp<br />
Money <strong>Market</strong>s<br />
OIS Steepener Receive 9M3M OIS Pay 12M3M OIS<br />
Even though our macro call is not for rate hikes any time soon, we see this as a way<br />
to fade cycle-low yields in the front end, but with more limited downside and no<br />
negative carry/roll. In the event appetite recovers, this is a 'cheap short' with an<br />
option-like payout.<br />
13.6<br />
(T)<br />
28.0 8.0 14.1<br />
(02-Jul)<br />
25k/01 USD -<br />
12.5k<br />
-0.5bp<br />
Euribor Basis Buy ERU0 Basis<br />
Protection trade into the ECB.<br />
35.5<br />
(S)<br />
50.0 30.0 37.0<br />
(10-Jun)<br />
5k/01 EUR -7.5k<br />
-1.5bp<br />
Options<br />
Euribor Fly Buy ERU0 9862/75/87 P<br />
Cheap downside strategy, playing the normalisation of Eonia. The position<br />
complements with the upside fly (no-normalisation strategy).<br />
1.5<br />
(S)<br />
12.5 0.0 1.5<br />
(13-Jan)<br />
10k/01 EUR 0k<br />
0c<br />
Euribor Fly Buy ERU0 9912/25/37 C<br />
Upside protection in case of liquidity spillover post June. Rolldown trade.<br />
1.5<br />
(S)<br />
12.5 0.0 1.5<br />
(12-Jan)<br />
10k/01 EUR 0k<br />
0c<br />
Sterling Fly Buy L Z0 9900/25/50 C<br />
Rolldown strategy for unchanged MPC through 2010.<br />
12.5<br />
(S)<br />
25.0 0.0 3.5<br />
(05-Jan)<br />
5k/01 GBP +45k<br />
+9c<br />
*Tactical (T) and strategic (S) trades. **Risk: vega, gamma for options, or ΔDV01 for futures, bonds and swaps.<br />
<strong>Interest</strong> <strong>Rate</strong> <strong>Strategy</strong> 16 July 2010<br />
<strong>Market</strong> Mover, Non-Objective Research Section<br />
49<br />
www.Global<strong>Market</strong>s.bnpparibas.com
Returning to EURAUD Bearish Strategies<br />
• Initial signs of a slowdown in the Chinese<br />
and US economies are being met by a<br />
commitment to maintain (or even extend) loose<br />
policy…<br />
• …suggesting that investor confidence will<br />
be maintained. Hence we maintain our positive<br />
view on commodity currencies.<br />
• We recommend taking advantage of the<br />
euro’s current recovery to establish short<br />
EURAUD positions once again.<br />
• Indeed, we believe that the euro’s recent<br />
recovery is coming to an end as optimism<br />
regarding European rescue packages and<br />
stress tests starts to fade.<br />
Percent<br />
Chart 1: Chinese Iron Ore Imports (% y/y)<br />
versus AUDUSD<br />
70<br />
60<br />
50<br />
40<br />
30<br />
20<br />
10<br />
0<br />
-10<br />
AUDUSD<br />
(RHS)<br />
Chinese Imports of Iron Ore<br />
05 06 07 08 09 10<br />
1.00<br />
0.95<br />
0.90<br />
0.85<br />
0.80<br />
0.75<br />
0.70<br />
0.65<br />
0.60<br />
Commodity currencies still favoured<br />
Equity markets rallied following the positive start to<br />
the earnings reporting season in the US, which has<br />
provide a broader boost to global investor optimism,<br />
allowing commodity currencies to resume gains.<br />
Indeed, is interesting to note that commodity-related<br />
currencies were the top performers over the past<br />
week among the major currencies and we expect this<br />
trend to continue in the near term, with long AUD<br />
positions still our favoured strategy for the medium<br />
term.<br />
Source: Reuters EcoWin Pro<br />
Chart 2: Chinese IP Looks Vulnerable to<br />
De-Stocking<br />
The AUD is also benefiting from positive domestic<br />
conditions as was highlighted by the solid<br />
employment report. Although the RBA has signalled<br />
a pause in the tightening cycle, the strength of data<br />
anticipated in the coming months will probably<br />
prompt further rate hikes before the end of the year<br />
in our view. But, the real driving force for the AUD<br />
over the medium term will remain China and Chinese<br />
domestic demand in particular.<br />
Chinese data slow…<br />
The overall growth picture from China remains<br />
positive despite administrative tightening measures<br />
to cool overheating sectors of the economy (as China<br />
attempts to slow the economy to a more sustainable<br />
pace). However, some warning signs are developing,<br />
suggesting that a more cautious approach to the<br />
‘China proxy’ trade may be required in the future.<br />
One area that warrants close attention currently is<br />
Chinese demand for raw materials and commodities.<br />
While China’s trade surplus has continued to widen<br />
(the trade surplus widened to USD 20.02bn in June<br />
from USD 19.53bn in May), it is interesting to note<br />
Source: Reuters EcoWin Pro<br />
that the main driver of this increase was a sharp<br />
slowdown of Chinese imports, which could be<br />
symptomatic of a broader slowing in Chinese<br />
domestic demand. At the headline level, the pace of<br />
growth in imports moderated to 34.1% y/y in June,<br />
from the 48.3% gain in May.<br />
However, of more significance is the fact that iron ore<br />
imports declined in both value and volume terms, as<br />
did coal and coal ore imports. This has also been<br />
reflected in the Australian trade data. Although the<br />
Australian trade data show exports increasing, this is<br />
a function of the rise in commodity prices, with<br />
exports in volume terms stagnating. The fact that<br />
there has been a decline in Chinese iron ore imports<br />
Ian Stannard 16 July 2010<br />
<strong>Market</strong> Mover, Non-Objective Research Section<br />
50<br />
www.Global<strong>Market</strong>s.bnpparibas.com
should not come as a complete surprise given the<br />
attempts by the authorities to remove some of the tax<br />
incentives put in place for steel exporters since June<br />
of last year.<br />
…as administrative measures cool overheating…<br />
Effective from 15 July, the Chinese Ministry of<br />
Finance will abolish a 9% tax rebate on exports, such<br />
as hot and cold rolled coils, and long steel, which are<br />
primarily used in the construction sector. This could<br />
discourage Chinese makers from aggressively<br />
expanding steel production, which in turn would not<br />
bode well for Australia’s iron ore exports. If these<br />
developments start to be reflected in a slowdown of<br />
Australian exports, the AUD would become<br />
vulnerable to at least a corrective setback of recent<br />
gains.<br />
Our Asian economics team have lowered their<br />
Chinese growth forecast for 2010 to 9.8% from<br />
10.50% previously, and forecast a further growth<br />
slowdown in 2011 to 8.4%, anticipating further policy<br />
tightening via a mixture of quantitative credit controls<br />
and regulation of local government investment.<br />
Indeed, the authorities appear to be steadfast in their<br />
policies to tame speculative investments via curbs on<br />
loans to multi-home buyers in the property market,<br />
an area which has been a source of concern for<br />
some time.<br />
…but global policy will remain supportive<br />
Although the risk of a slowdown in China and the US<br />
has been clearly identified, it is encouraging that<br />
monetary authorities have responded. The latest<br />
FOMC minutes show a significant shift in tone, taking<br />
on a more dovish stance, suggesting that liquidity will<br />
be left in the system for longer than the market was<br />
initially anticipating. Some members of the FOMC<br />
have also put the case for further measures to be<br />
taken if the outlook deteriorates further. Furthermore,<br />
the Chinese authorities have reaffirmed their<br />
commitment to using an active fiscal policy together<br />
with a moderately accommodative monetary policy to<br />
maintain sustained growth. In an environment of<br />
continued ample global liquidity, we would expect<br />
asset markets to remain supported and investor<br />
confidence to be maintained, which will provide a<br />
favourable backdrop for the commodity and procyclical<br />
currencies.<br />
The risk of a sharper slowdown in Europe<br />
Along with many other central banks, Chinese<br />
officials have recently expressed concern over the<br />
external demand picture (namely Europe). As a<br />
producer of intermediate goods which are then<br />
finished and exported to the rest of the world, the<br />
largest destination being Europe, these concerns are<br />
not surprising. Chart 3 suggests that, in nominal<br />
60<br />
50<br />
40<br />
30<br />
20<br />
10<br />
0<br />
-10<br />
-20<br />
-30<br />
Chart 3: Chinese Exports (% y/y)<br />
00 01 02 03 04 05 06 07 08 09<br />
Source: Reuters EcoWin Pro<br />
1.4<br />
1.5<br />
1.6<br />
1.7<br />
1.8<br />
1.9<br />
2.0<br />
EU<br />
annual terms, the growth of Chinese exports to<br />
Europe is peaking. So far, relative strength in core-<br />
European countries has, to some extent, provided a<br />
cushion to a significantly weaker growth profile in the<br />
peripheral eurozone countries. But that might be<br />
about to change.<br />
Both the survey and ‘hard’ activity data in Germany<br />
point to a noticeable acceleration in GDP growth over<br />
the second quarter, driven to a large extent by the<br />
export-sensitive manufacturing sector. But, looking<br />
forward, we anticipate that growth will slow in the<br />
second half of the year as tighter fiscal policy makes<br />
its presence felt. Indeed, leading growth indicators on<br />
the German front are already flagging such an<br />
outcome with the likes of the new-orders-to-inventory<br />
ratio in the manufacturing PMI survey turning sharply<br />
lower. We favour short EURAUD positions<br />
US<br />
Chart 4: EURAUD versus German Ifo<br />
Expectations. (Inversely) Hand in Hand?<br />
2.1<br />
94 96 98 00 02 04 06 08 10<br />
Source: Reuters EcoWin Pro<br />
EURAUD (Inverted)<br />
German IFO Index<br />
115<br />
110<br />
105<br />
100<br />
95<br />
90<br />
85<br />
80<br />
Ian Stannard 16 July 2010<br />
<strong>Market</strong> Mover, Non-Objective Research Section<br />
51<br />
www.Global<strong>Market</strong>s.bnpparibas.com
We continue to favour bullish AUD strategies as long<br />
as the overall growth picture in China is maintained<br />
and global liquidity remains ample, as currently looks<br />
to be the case. However, we would now favour short<br />
EURAUD positions to participate in anticipated<br />
further AUD gains as the EUR’s recent corrective<br />
rebound appears to be coming to an end.<br />
Chart 4 shows that, historically, there has been a<br />
close inverse correlation between the German Ifo<br />
expectations index and EURAUD. This can be<br />
explained by Australia’s status as a net exporter of<br />
commodities, and Europe’s as a net importer.<br />
Typically the Ifo index has been a timely indicator of<br />
turning points in EURAUD. However, we do not<br />
expect this simple historical correlation to continue to<br />
hold in the same way. The current environment is<br />
very different with the focus on fiscal consolidation.<br />
Hence, the current turn lower in the Ifo is unlikely to<br />
disrupt the longer-term down trend in EURAUD in our<br />
view.<br />
EURAUD rebound nearing completion<br />
We recently established a tactical long position to<br />
take advantage of a short-term corrective rebound in<br />
EURAUD as the unwinding of extreme euro short<br />
positions generated a recovery. Indeed, data from<br />
the last commitment of traders report (as of Tuesday<br />
6 July) showed a huge scaling back of short euro<br />
positions. The net euro short position declined to<br />
38,909, a hefty 34,761 drop in contracts on the week,<br />
which was the second-biggest short covering in EUR<br />
in recent years. This position adjustment is nearing<br />
completion, implying a return to strategic short euro<br />
positions is now possible. Hence, we would look to<br />
use any further EURAUD corrective gains over the<br />
coming week, which could see EURAUD rebound<br />
towards the 1.48 area, to establish renewed short<br />
positions targeting the 1.20 area by the end of the<br />
year.<br />
Chart 5: Australian Business and Consumer<br />
Confidence<br />
130<br />
Consumer Confidence<br />
125<br />
120<br />
115<br />
110<br />
105<br />
100<br />
(RHS)<br />
95<br />
90<br />
85<br />
Business Confidence<br />
(RHS)<br />
80<br />
75<br />
02 03 04 05 06 07 08 09 10<br />
Source: Reuters EcoWin Pro<br />
Chart 6: EURAUD Risk Reversal<br />
Source: Reuters EcoWin Pro<br />
50<br />
40<br />
30<br />
20<br />
10<br />
0<br />
-10<br />
-20<br />
-30<br />
-40<br />
Ian Stannard 16 July 2010<br />
<strong>Market</strong> Mover, Non-Objective Research Section<br />
52<br />
www.Global<strong>Market</strong>s.bnpparibas.com 50
EUR/USD Rally Sets Sights on 1.3000<br />
• This week’s EUR/USD bullish trend reversal opens scope for a corrective rally toward 1.3125-<br />
1.3510 lasting until late-August to early-October.<br />
• However, extremely strong weekly momentum is fuelling the EUR/USD rise, potentially creating a<br />
larger rebound toward 1.37-1.39.<br />
• The EUR/USD advance has powerful allies in GBP/USD and AUD/USD with both currencies poised<br />
to extend gains during the next few weeks towards 1.55 and 0.9080, respectively.<br />
Tuesday’s EUR/USD breakout above the<br />
December downtrend near 1.27 triggered a<br />
bullish trend reversal. This indicated the Nov-<br />
June decline (1.5145-1.1875) is being unwound<br />
via a medium-term corrective rally toward at least<br />
1.3125-1.3510 representing the 38.2-50%<br />
retracement points of the Nov-June decline.<br />
Potentially a larger EUR/USD rise could occur<br />
toward 1.3895 – the common 61.8% retracement<br />
point -- given bullish momentum and pattern<br />
factors. 1) Momentum: Half way through July, the<br />
monthly chart shows this month’s rise is currently<br />
the largest since May’09: such a powerful surge<br />
is a propitious way to begin a sizable rally. The<br />
rally is fuelled by the strongest bout of weekly<br />
momentum since the explosive December’08<br />
jump. And weekly momentum is not overbought,<br />
suggesting more gains to follow. Although a<br />
somewhat arbitrary technical factor, the “slope” of<br />
the current June advance off 1.1875 is close to<br />
45-degrees on the daily chart – the most<br />
sustainable type of rally. 2) Pattern: Elliott wave<br />
analysis suggests “the logical point of return” for<br />
the correction is the 1.3692 April 12 high<br />
representing the last prominent high on the<br />
EUR/USD daily chart.<br />
The EUR/USD advance is also finding allies in<br />
GBP/USD and AUD/USD. GBP/USD broke out to a<br />
10-week high Wednesday and robust bullish weekly<br />
momentum favors now favor extending the gain<br />
toward 1.5490-1.5525 including a test of the April<br />
high. The AUD/USD rally, buoyed by accelerating<br />
bullish weekly momentum that is even stronger than<br />
at the start of the massive March-Nov’09 advance,<br />
next targets a break above 0.8885 retracement<br />
resistance with medium-term scope toward June up<br />
channel resistance near 0.9070/80.<br />
The bullish EUR/USD bias will get a boost if the S&P<br />
500 Index can confirm rising risk appetite by breaking<br />
above its April downtrend near 1093. A bullish trend<br />
reversal would open 1102-1106 resistance, with a<br />
break of 1106 opening scope for a bigger multi-week<br />
Wall Street rebound toward 1117-1131-1142. If the<br />
S&P 500 Index confirms this week’s bullish<br />
EUR/USD trend reversal, it would create a strong<br />
technical argument for “risk on” spanning several<br />
more weeks, as rising stock prices assist the<br />
EUR/USD rebound.<br />
Chart 1: EUR/USD – Bullish trend reversal<br />
The EUR/USD<br />
corrective rebound<br />
accelerated this week,<br />
decisively breaking<br />
the December<br />
downtrend at 1.2690.<br />
This confirms a bullish<br />
trend reversal next<br />
targeting the top of the<br />
June up channel near<br />
1.2980 and the 1.3000<br />
level, with scope to<br />
1.3125-1.3510<br />
Fibonacci retracement<br />
point resistance later<br />
this summer.<br />
1.48<br />
1.43<br />
1.38<br />
1.33<br />
1.28<br />
1.23<br />
1.18<br />
1.5060<br />
1.4630<br />
1.5140<br />
1.4582<br />
1.4219<br />
1.3815<br />
1.3690<br />
1.3455<br />
1.3270<br />
20-Nov-09 19-Jan-10 18-Mar-10 17-May-10<br />
1.1880<br />
1.2660<br />
14-Jul-10<br />
Source: <strong>BNP</strong> Paribas<br />
Andrew Chaveriat 16 July 2010<br />
<strong>Market</strong> Mover, Non-Objective Research Section<br />
53<br />
www.Global<strong>Market</strong>s.bnpparibas.com
Chart 2: AUD/USD – Pausing before extending rally<br />
Aussie was a leader of<br />
the June “risk on”<br />
trade and once again<br />
is a key barometer for<br />
risk appetite. Currently<br />
0.95<br />
0.9405<br />
0.9320<br />
0.9390<br />
consolidating near 0.90<br />
0.9005<br />
0.8860 chart<br />
0.8910<br />
resistance and 0.8885<br />
Fibonacci resistance,<br />
0.8735<br />
the bullish mediumterm<br />
bias favors<br />
extension toward the<br />
top of the June up<br />
0.85<br />
0.8580<br />
channel near<br />
0.9070/80. 0.80<br />
0.8070<br />
20-Nov-09 19-Jan-10 18-Mar-10 17-May-10<br />
0.8860<br />
0.8315<br />
14-Jul-10<br />
Source: <strong>BNP</strong> Paribas<br />
USD/JPY is being<br />
dragged lower by<br />
bearish weekly and<br />
daily momentum. This<br />
risks a re-test of strong<br />
support from the<br />
recent twin-low near<br />
87.00 – with a<br />
downside break<br />
opening a deeper<br />
decline toward 86.50-<br />
85.60.<br />
97<br />
95<br />
93<br />
91<br />
89<br />
87<br />
Chart 3: USD/JPY – Rolling over<br />
97.78<br />
93.76<br />
92.32<br />
92.15<br />
94.95<br />
88.00<br />
86.95<br />
85<br />
27-Jul-09<br />
23-Sep-09<br />
84.81<br />
20-Nov-09<br />
19-Jan-10<br />
18-Mar-10<br />
17-May-10<br />
14-Jul-10<br />
Source: <strong>BNP</strong> Paribas<br />
Although weekly<br />
momentum remains<br />
bearish following the<br />
break of the March<br />
uptrend on July 1st,<br />
the recent $80 decline<br />
in spot gold is<br />
reminiscent of<br />
previous corrective<br />
declines seen this<br />
year. Any further<br />
corrective weakness<br />
should be limited to<br />
key $1166 support<br />
followed by resumption<br />
of the February<br />
advance.<br />
Source: <strong>BNP</strong> Paribas<br />
Chart 4: Gold – Correcting off the June peak<br />
1300.00<br />
1250.00<br />
1226<br />
1200.00<br />
1161<br />
1164<br />
1150.00<br />
1100.00<br />
1050.00<br />
1074<br />
1090<br />
1043<br />
1000.00<br />
20-Nov-09 19-Jan-10 18-Mar-10<br />
1264<br />
1248<br />
17-May-10 14-Jul-10<br />
Andrew Chaveriat 16 July 2010<br />
<strong>Market</strong> Mover, Non-Objective Research Section<br />
54<br />
www.Global<strong>Market</strong>s.bnpparibas.com
Currency Spot Trade Recommendations Date<br />
EUR/AUD 1.4675 Sell 1.4875, stop at 1.5075, target 1.3850 15 Jul 2010<br />
EUR/GBP 0.8380 Buy 0.8290, stop at 0.8210, target 0.85 08 Jul 2010<br />
USD/CHF 1.0430 Short from 1.0585, lower stop to 1.06, target 1.0150 08 Jul 2010<br />
USD/JPY 87.35 Short at 88.00, lower stop to 88.60, target 85.00 02 Jul 2010<br />
USD/KZT 147.50 Short at 147.00, stop at 149.50, target 135.00 28 May 2010<br />
EUR/AUD 1.4670 Long from 1.4700 stopped at 1.4340 07 Jul 2010<br />
GBP/USD 1.5365 Short from 1.5165 stopped at 1.53 08 Jul 2010<br />
TRY/CZK 12.95 Long from 13.20 stopped at 12.90 28 May 2010<br />
Source: <strong>BNP</strong> Paribas<br />
Andrew Chaveriat 16 July 2010<br />
<strong>Market</strong> Mover, Non-Objective Research Section<br />
55<br />
www.Global<strong>Market</strong>s.bnpparibas.com
Economic Calendar: 16 - 23 July<br />
GMT Local Previous Forecast Consensus<br />
Fri 16/07 23:50 08:50 Japan Tertiary Index (sa) m/m : May 2.1% -1.0% -0.7%<br />
(15/07)<br />
08:00 10:00 Italy EU Trade Balance : May EUR0.2bn EUR1.0bn n/a<br />
09:00 11:00 Eurozone Foreign Trade Balance (sa) : May EUR1.6bn EUR-0.5bn n/a<br />
09:00 11:00 ECB’s Honohan Speaks in Dublin<br />
12:30 08:30 US CPI m/m : Jun -0.2% -0.1% -0.1%<br />
12:30 08:30 CPI y/y : Jun 2.0% 1.2% 1.2%<br />
12:30 08:30 Core CPI m/m : Jun 0.1% 0.0% 0.1%<br />
12:30 08:30 Core CPI y/y : Jun 0.9% 0.9% 0.9%<br />
13:00 09:00 TICS Data : May USD15.0bn USD25.0bn n/a<br />
13:55 09:55 Michigan Sentiment (Prel) : Jul 76.0 74.0 74.0<br />
Mon 19/07 23:01 00:01 UK Rightmove House Price Index m/m : Jul<br />
(18/07)<br />
Japan Public Holiday<br />
08:00 10:00 Eurozone Current Account : May EUR-5.1bn EUR-3.0bn n/a<br />
14:00 10:00 US NAHB Housing <strong>Market</strong> Index : Jul 17 15 17<br />
Tue 20/07 01:30 11:30 Australia RBA MPC Minutes<br />
06:00 08:00 Germany PPI m/m : Jun 0.3% 0.2% 0.2%<br />
06:00 08:00 PPI y/y : Jun 0.4% 1.2% 1.2%<br />
07:30 09:30 Neths Consumer Confidence : Jul -18 -19 n/a<br />
08:00 10:00 Italy Industrial Orders y/y : May 20.6% 0.2% n/a<br />
09:00 11:00 Non-EU Trade Balance : Jun n/a<br />
08:30 09:30 UK PSNCR : Jun GBP12.0bn GBP20.0bn n/a<br />
08:30 09:30 PSNB : Jun GBP16.0bn GBP13.0bn n/a<br />
10:00 11:00 CBI Monthly Industrial Trends : Jul<br />
12:30 08:30 US Housing Starts : Jun 593k 580k 579k<br />
14:00 10:00 Fed’s Tarullo Testifies on Financial Regulation in Senate<br />
13:00 09:00 Canada BoC <strong>Rate</strong> Announcement<br />
Wed 21/07 Japan BoJ Minutes<br />
08:30 09:30 UK BoE MPC Minutes<br />
14:00 10:00 US Fed’s Bernanke Gives Monetary Policy Report to Senate Banking Panel<br />
14:30 10:30 EIA Oil Inventories<br />
Thu 22/07 06:45 08:45 France Business Confidence (sa) : July 95 94 n/a<br />
06:45 08:45 Consumer Confidence (sa) : July -39 -41 n/a<br />
07:00 09:00 Eurozone PMI Manufacturing (Flash) : Jul 55.6 55.4 55.1<br />
07:00 09:00 PMI Services (Flash) : Jul 55.5 54.5 55.0<br />
07:00 09:00 PMI Composite (Flash) : Jul 56.0 55.2 n/a<br />
09:00 11:00 Industrial Orders m/m : May 0.9% 0.0% n/a<br />
09:00 11:00 Industrial Orders y/y : May 22.1% 21.3% n/a<br />
ECB Governing Council Meeting (No <strong>Rate</strong> Announcement)<br />
07:30 09:30 Neths Unemployment <strong>Rate</strong> : Jun 5.6% 5.5% n/a<br />
08:30 09:30 UK Retail Sales inc Auto Fuel m/m : Jun 0.6% 0.3% 0.6%<br />
08:30 09:30 Retail Sales inc Auto Fuel y/y : Jun 2.2% 0.7% 1.1%<br />
12:30 08:30 US Initial Claims 429k 440k n/a<br />
14:00 10:00 FHFA HPI : May<br />
14:00 10:00 Existing Home Sales : Jun 5.66mn 5.00mn 5.20mn<br />
14:00 10:00 Leading Indicators m/m : Jun 0.4% -0.2% -0.3%<br />
14:30 10:30 Canada BoC Monetary Policy Report<br />
<strong>Market</strong> <strong>Economics</strong> 16 July 2010<br />
<strong>Market</strong> Mover<br />
56<br />
www.Global<strong>Market</strong>s.bnpparibas.com
Economic Calendar: 16 - 23 July (cont)<br />
GMT Local Previous Forecast Consensus<br />
Fri 23/07 06:45 08:45 France Household Consumption m/m : Jun 0.7% -0.6% n/a<br />
06:45 08:45 Quarterly Industry Survey : Q3 4 5 n/a<br />
07:00 09:00 Spain PPI m/m : Jun 0.2% 0.2% n/a<br />
07:00 09:00 PPI y/y : Jun 3.8% 3.3% n/a<br />
07:30 09:30 Italy ISAE Consumer Confidence : Jul 104.4 104.0 n/a<br />
08:00 10:00 Retail Sales y/y : May -0.5% 0.4% n/a<br />
08:00 10:00 Germany IFO Business Climate : Jul 101.8 102.1 101.5<br />
08:00 10:00 IFO Current Conditions : Jul 101.1 102.6 102.4<br />
08:00 10:00 IFO Expectations : Jul 102.4 101.4 101.3<br />
08:30 09:30 UK GDP (Prel) q/q : Q2 0.3% 0.6% 0.6%<br />
08:30 09:30 GDP (Prel) y/y : Q2 -0.2% 1.1% 1.0%<br />
11:00 07:00 Canada CPI m/m : Jun 0.3%<br />
13:00 15:00 Belgium Business Confidence : Jul -7.7 -10.0 n/a<br />
During 22-29/7 Germany Import Prices m/m : Jun 0.6% 0.5% n/a<br />
Week Import Prices y/y : Jun 8.5% 8.6% n/a<br />
Release dates and forecasts as at c.o.b. prior to the date of publication: See Daily Economic Spotlight for any revision<br />
Source: <strong>BNP</strong> Paribas<br />
<strong>Market</strong> <strong>Economics</strong> 16 July 2010<br />
<strong>Market</strong> Mover<br />
57<br />
www.Global<strong>Market</strong>s.bnpparibas.com
Key Data Preview<br />
Chart 1: US Total vs. Core CPI Inflation<br />
Source: Reuters EcoWin Pro<br />
% m/m Jun (f) May Apr Mar<br />
CPI -0.1 -0.2 -0.1 0.1<br />
Core 0.0 0.1 0.0 0.0<br />
NSA (index) 218.26 218.18 218.01 217.63<br />
Key Point:<br />
Falling energy prices will offset higher food prices,<br />
bringing headline to zero. Core unchanged will bring<br />
y/y to its 1961 low.<br />
<strong>BNP</strong> Paribas Forecast: More Weakening<br />
US: Consumer Price Index (June)<br />
Release Date: Friday 16 July<br />
Headline CPI is expected to decline by 0.1% m/m in June,<br />
driven mainly by declining energy prices. Weekly EIA data<br />
indicate that pump prices declined throughout June,<br />
reflecting the decline in crude oil prices in May. As a result,<br />
we expect CPI energy prices after seasonal adjustment to<br />
fall by 1.4% m/m in June, approximately half the decline<br />
seen in May. Food prices are forecast to increase by 0.2%<br />
m/m in June. Food prices have followed a rollercoaster<br />
path of strongly up followed by negligible increases in<br />
alternate months. Excluding food and energy, core CPI is<br />
expected to remain unchanged after nudging higher (0.1%)<br />
in May. As a result, core yearly inflation should ease to<br />
0.85% y/y from 1.0% previously, pushing it closer to its<br />
1961 all-time low (0.7%). Weakness should be<br />
concentrated in core goods (no change), and shelter prices<br />
(-0.04%). Within shelter, only lodging away from home has<br />
any price buoyancy. There is a risk to the goods price<br />
forecast that state and local governments could raise taxes<br />
on tobacco and other goods to help redress massive<br />
budget deficits again, as they did in May. In non-seasonally<br />
adjusted terms, total CPI is expected to remain largely<br />
unchanged, inching up to 218.256 from 218.18 in May.<br />
This should drive total yearly inflation much lower, to 1.2%<br />
in June from 2% previously.<br />
Chart 2: US Present Conditions Compared<br />
Source: Reuters EcoWin Pro<br />
July p (f) Jun 2H Jun p Jun May<br />
Michigan<br />
Sentiment 74.0 76.5 75.5 76.0 73.6<br />
<strong>BNP</strong> Paribas Forecast: Decline<br />
US: Michigan Consumer Sentiment (July, preliminary)<br />
Release Date: Friday 16 July<br />
The University of Michigan Survey of Consumer<br />
Confidence index rose in June to 76.0 from 73.6 in May.<br />
Recent developments in consumer confidence likely reflect<br />
weakness in gasoline prices. Nevertheless, the turmoil in<br />
financial markets and the risks to the economic recovery<br />
from the European sovereign crisis as well as private<br />
sector hiring losing steam should send consumer<br />
confidence lower in the first half of July. In addition, stocks<br />
have given up all of this year’s gains. Therefore, we expect<br />
a decline to 74.0 in July from 76.0 in June. On the other<br />
hand, as the recovery progresses, albeit at a moderate<br />
pace, consumer confidence should continue trending<br />
higher in the coming months.<br />
Key Point:<br />
Unfavourable news on the European sovereign risk<br />
crisis and private sector hiring losing momentum<br />
should depress consumers’ optimism early in July.<br />
<strong>Market</strong> <strong>Economics</strong> 166 July 2010<br />
<strong>Market</strong> Mover<br />
58<br />
www.Global<strong>Market</strong>s.bnpparibas.com
Key Data Preview<br />
Chart 3: US Housing Starts & Building Permits<br />
2000<br />
1750<br />
1500<br />
1250<br />
1000<br />
750<br />
500<br />
Building Permits (lagged 1 month, k)<br />
Housing Starts (k)<br />
250<br />
May Aug Nov Feb May Aug Nov Feb May Aug Nov Feb May Aug Nov Feb May<br />
06 07 08 09 10<br />
Source: Reuters EcoWin Pro<br />
Jun (f) May Apr Mar<br />
Housing Starts<br />
(000s, saar) 580 593 659 634<br />
Key Point:<br />
A 5.9% decline in building permits in May suggests<br />
housing starts will ease in June.<br />
<strong>BNP</strong> Paribas Forecast: Small Decline<br />
US: Housing Starts (June)<br />
Release Date: Tuesday 20 July<br />
Housing starts are expected to decline by 13k to 580k in<br />
June after plunging by 66k in the previous month. Indeed,<br />
building permits dropped sharply in April by 10.9% m/m,<br />
and in May they dropped by another 5.9%. Given that<br />
permits lead housing starts by one to two months, the May<br />
decline in permits points to more weakness in new<br />
construction over the near term. Also supporting our<br />
forecast, construction hours worked declined by 0.1% m/m<br />
in June following a 3.0% decline in May. In line with that,<br />
the NAHB index of homebuilders’ optimism dropped in<br />
June by 5 points after two month of somewhat stronger<br />
readings. It appears that much of the stabilisation in<br />
housing demand over the past year was a pulling forward<br />
of demand through the tax credit, leaving the outlook for<br />
housing highly uncertain. New lows in mortgage rates<br />
should provide some support to housing demand, although<br />
we look for only a modest improvement from these levels<br />
through the remainder of the year.<br />
1.2<br />
1.1<br />
0.9<br />
0.9<br />
0.8<br />
0.7<br />
0.6<br />
Chart 4: Eurozone Manufacturing PMI<br />
1.4 Manufacturing PMI:<br />
Ratio of New Orders to Stocks of Finished Goods<br />
1.3<br />
Manufacturing PMI: Headline (RHS)<br />
0.5<br />
30<br />
97 98 99 00 01 02 03 04 05 06 07 08 09 10<br />
Source: Reuters EcoWin Pro<br />
Jul (f) Jun May Apr<br />
Manufacturing 55.4 55.6 55.8 57.6<br />
Services 54.5 55.5 56.2 55.6<br />
Composite 55.2 56.0 56.4 57.3<br />
Key Point:<br />
The more forward-looking elements of the PMIs point<br />
to a further moderation in activity.<br />
60<br />
55<br />
50<br />
45<br />
40<br />
35<br />
<strong>BNP</strong> Paribas Forecast: Past the Peak<br />
Eurozone: ‘Flash’ PMIs (July)<br />
Release Date: Thursday 22 June<br />
Following fourteen consecutive rises, taking the ‘headline’<br />
index of the manufacturing PMI for the eurozone to its<br />
highest level since mid-2006, May and June figures saw a<br />
moderation in activity in the sector.<br />
The output and new orders indices of the manufacturing<br />
PMI have both declined by around four percentage points<br />
from their peaks though both remain consistent with robust<br />
levels of activity (at 57.2 and 55.9, respectively).<br />
The ratio of the sub-indices for new orders and stocks of<br />
finished goods, historically a good leading indicator of the<br />
future direction of the manufacturing PMI, is consistent with<br />
a further moderation in activity going forward (see chart).<br />
External economic conditions remain supportive of activity<br />
in the sector but developments within the eurozone are not<br />
so favourable. Domestic demand is already weak and will<br />
be undermined further by fiscal policy tightening.<br />
In line with the relative weakness of domestic demand, the<br />
PMI for the service sector has been less elevated than its<br />
manufacturing sibling. The services PMI weakened in June<br />
and, with the new business and future expectations indices<br />
both falling sharply, we look for a further fall in July.<br />
The employment indices of the manufacturing and services<br />
PMIs are barely above the 50 expansion level, indicative of<br />
high unemployment continuing. This in turn bears down on<br />
labour costs, keeping output price indices low.<br />
<strong>Market</strong> <strong>Economics</strong> 166 July 2010<br />
<strong>Market</strong> Mover<br />
59<br />
www.Global<strong>Market</strong>s.bnpparibas.com
Key Data Preview<br />
Chart 5: UK Retail Sales vs RICS Sales to Stocks<br />
10<br />
9<br />
8<br />
7<br />
6<br />
5<br />
4<br />
3<br />
2<br />
1<br />
0<br />
-1<br />
-2<br />
-3<br />
RICS Sales to Stocks<br />
(3m-lag, RHS)<br />
Retail Sales (% y/y)<br />
00 01 02 03 04 05 06 07 08 09 10<br />
Source: Reuters EcoWin Pro<br />
Jun (f) May Apr Mar<br />
% m/m 0.3 0.6 0.0 0.7<br />
% y/y 0.7 2.2 1.3 1.5<br />
% 3m/3m 1.7 1.2 0.1 -2.4<br />
% 3m/yr 1.4 1.7 1.6 0.5<br />
Key Point:<br />
We expect a solid m/m expansion, though base<br />
effects will push y/y growth to a subdued level.<br />
0.7<br />
0.6<br />
0.5<br />
0.4<br />
0.3<br />
0.2<br />
0.1<br />
<strong>BNP</strong> Paribas Forecast: Solid<br />
UK: Retail Sales (June)<br />
Release Date: Thursday 22 July<br />
We expect a solid 0.3% m/m pace of expansion in UK retail<br />
sales during June. However, given the m/m surge a year<br />
earlier, the y/y pace of growth is likely to slump to below<br />
1% y/y.<br />
The joker in the pack this month is likely to be the effect of<br />
the football world cup. There have been mixed reports with<br />
regards to what impact this had on consumer spending.<br />
One retailer complained of poor sales of flatscreen TVs in<br />
comparison with the experience during past football<br />
competitions. This suggests that household goods probably<br />
didn’t take off in a big way. By contrast, food and<br />
beverages sales are likely to have been buoyed to some<br />
extent – reinforced by the particularly favourable weather<br />
during the month.<br />
Survey indicators have been mixed. The GfK measure of<br />
consumer confidence continued to trend lower and<br />
suggested that consumers’ appetite for major purchases<br />
continued to slide. By contrast the BRC retail sales monitor<br />
showed a modest acceleration in sales values (around<br />
3.4% y/y). However, since the latter is reported in nominal<br />
terms, subtracting inflation would leave sales volumes<br />
close to our estimate for the ONS equivalent.<br />
Chart 6: French Industry Surveys (Normalised)<br />
30<br />
20<br />
Own Production Outlook<br />
10<br />
0<br />
-10<br />
-20<br />
-30<br />
Composite Indicator (RHS)<br />
-40<br />
-50<br />
-60<br />
General Production Outlook<br />
-70<br />
-80<br />
01 02 03 04 05 06 07 08 09 10<br />
Source: Reuters EcoWin Pro<br />
SA Jul (f) Jun May Jul 09<br />
Services 97 98 99 78<br />
Industry 94 95 97 80<br />
Overall Manuf. Outlook -8 -4 -3 -40<br />
Own Manuf. Outlook -5 -7 3 -18<br />
Key Point:<br />
Both services and industry should suffer a decline in<br />
confidence in July. Global uncertainties and fiscal<br />
tightening should weigh on growth momentum.<br />
115<br />
110<br />
105<br />
100<br />
95<br />
90<br />
85<br />
80<br />
75<br />
70<br />
<strong>BNP</strong> Paribas Forecast: Second Decline<br />
France: Monthly Industrial Survey (July)<br />
Release Date: Thursday 22 July<br />
Industrial production has done remarkably well in the past<br />
few months: manufacturing output rose 2.3% in the three<br />
months to May. This should translate into strong GDP<br />
growth in Q2; we forecast 0.5% q/q. However, the<br />
momentum of the recovery seems to be fading.<br />
We expect the July confidence indices to confirm this<br />
concern. The INSEE survey may print a second<br />
consecutive decline for services, which has not occurred<br />
since the trough of the cycle in March 2009.<br />
Despite more favourable international conditions (with the<br />
weaker euro helping exports outside the eurozone and<br />
some improvement in GDP growth in most eurozone<br />
trading partners), industrial confidence is also likely to<br />
retrench.<br />
Own manufacturing output suffered a severe setback in<br />
June, and we may see a technical correction in July.<br />
However, other sub-indicators are likely to deteriorate<br />
further. In particular the overall manufacturing outlook<br />
should weaken again, and more significantly than the<br />
previous month. Overall, we forecast industrial confidence<br />
to decline for the second month in a row.<br />
<strong>Market</strong> <strong>Economics</strong> 166 July 2010<br />
<strong>Market</strong> Mover<br />
60<br />
www.Global<strong>Market</strong>s.bnpparibas.com
Key Data Preview<br />
Chart 8: French Hh Confidence (key items)<br />
10<br />
0<br />
-10<br />
-20<br />
-30<br />
-40<br />
-50<br />
-60<br />
Future Finances - Personal<br />
Past Finances - Personal<br />
-70 Past Living Standard - National<br />
Future Living Standard - National<br />
-80<br />
04 05 06 07 08 09 10<br />
Source: Reuters EcoWin Pro<br />
Diffusion Index, SA Jul (f) Jun May Jul 09<br />
INSEE indices:<br />
Overall -41 -39 -38 -37<br />
Buying opportunity -27 -24 -24 -28<br />
EU Commis. Index:<br />
Headline -24.0 -22.0 -21.3 -28.1<br />
<strong>BNP</strong> Paribas Forecast: Continued Decline<br />
France: Household Confidence (July)<br />
Release Date: Thursday 22 July<br />
The economic news that usually drives household<br />
confidence has been mixed over the past few weeks.<br />
Unemployment data did not confirm in the past two months<br />
(+1.4% in April and May) the improvement seen earlier in<br />
the year. Conversely, inflation eased in June, especially<br />
energy prices.<br />
However, the main piece of news affecting household<br />
confidence recently is the announcement of the pension<br />
reform and the prospect of fiscal tightening, much needed<br />
in order to reduce the deficit to 3.0% in 2013. This is<br />
probably weighing on confidence, with the political<br />
scandals that affected various government members also<br />
likely to have taken their toll.<br />
The perceived national standards of living, both past and<br />
future, have deteriorated significantly since the start of the<br />
year. The personal financial situation, which usually moves<br />
in tandem with the standard of living, has held up better<br />
(see chart). These low levels probably explain the decline<br />
in the ability to save.<br />
Key Point:<br />
The prospect of fiscal tightening is probably the<br />
major reason for the continued decline in household<br />
confidence.<br />
Chart 9: US Existing & Pending Home Sales<br />
130<br />
125<br />
120<br />
115<br />
110<br />
105<br />
100<br />
95<br />
90<br />
85<br />
80<br />
75<br />
Existing Home Sales<br />
(mn, RHS)<br />
Pending Home Sales<br />
(2001=100, 1m lag)<br />
02 03 04 05 06 07 08 09 10<br />
Source: Reuters EcoWin Pro<br />
Jun (f) May Apr Mar<br />
New Home Sales<br />
(000s saar) 310 300 446 389<br />
Existing Home Sales<br />
(millions saar) 5.00 5.66 5.79 5.36<br />
Key Point:<br />
We expect existing home sales to decline by 12%<br />
m/m in June as pending home sales plummeted in<br />
May by 30%, while new home sales should remain<br />
weak, at 310k annualised units.<br />
7.2<br />
6.7<br />
6.2<br />
5.7<br />
5.2<br />
4.7<br />
4.2<br />
<strong>BNP</strong> Paribas Forecast: Weak<br />
US: Existing & New Home Sales (June)<br />
Release Date: Thursday 22 and Monday 26 July<br />
Existing home sales should drop sharply in June following<br />
a smaller decline the previous month. In May, existing<br />
home sales declined by 2.2% m/m and we expect they will<br />
drop by 12% in June as pending home sales plummeted<br />
30% in May. It appears that much of the stabilisation in<br />
housing demand over the past year stemmed from a pulling<br />
forward of demand through the tax credit. Indeed,<br />
mortgage applications to purchase a home declined by<br />
22% m/m in May, and by another 11.5% m/m in June, to<br />
their lowest level since 1996, suggesting prospective<br />
buyers are already pulling back sharply.<br />
New home sales plummeted by 32.7% m/m in May, adding<br />
to evidence that prospective home buyers withdrew from<br />
the market en masse in May after the government<br />
homebuyers’ tax credit expired in April. We expect new<br />
home sales to remain weak at 310k annualised units, up<br />
just 3.3% from their 30-year low. The end of the<br />
government tax credit at the end of April should cool sales<br />
in the summer months, with housing demand troughing in<br />
June or July, before the cyclical upward trend resumes in<br />
the second half of the year.<br />
In line with that, the NAHB index of prospective buyers’<br />
traffic dropped back to 14 in June after blipping to 16 the<br />
previous month.<br />
<strong>Market</strong> <strong>Economics</strong> 166 July 2010<br />
<strong>Market</strong> Mover<br />
61<br />
www.Global<strong>Market</strong>s.bnpparibas.com
Key Data Preview<br />
120<br />
115<br />
110<br />
105<br />
100<br />
95<br />
90<br />
85<br />
80<br />
Chart 9: German Ifo Business Climate<br />
Expectations (4-Mth Lag)<br />
Current Conditions<br />
75<br />
93 94 95 96 97 98 99 00 01 02 03 04 05 06 07 08 09 10<br />
Source: Reuters EcoWin Pro<br />
Jul (f) Jun May Apr<br />
Headline 102.1 101.8 101.5 101.7<br />
Expectations 101.4 102.4 103.7 104.0<br />
Current Conditions 102.6 101.1 99.4 99.3<br />
Key Point:<br />
Expectations have topped out but strength in the<br />
industrial sector is boosting current conditions.<br />
<strong>BNP</strong> Paribas Forecast: Mixed Picture<br />
Germany: Ifo Business Climate (July)<br />
Release Date: Friday 23 July<br />
Ifo’s ‘headline’ business climate index has gone sideways<br />
in the most recent couple of months, with declines in the<br />
expectations sub-index broadly offset by improvements in<br />
the current assessment of business conditions.<br />
We expect a similar outcome in July. The fall-out from the<br />
debt crisis in the eurozone and the German government’s<br />
decision to implement a fiscal austerity plan are again likely<br />
to weigh on expectations.<br />
There is a high correlation between Ifo’s expectations index<br />
and the ZEW survey’s equivalent. The latter declined by a<br />
larger than expected margin for the third straight month in<br />
July, with both factors above cited for the deterioration.<br />
In contrast, Ifo’s current assessment of business conditions<br />
should continue to improve, in line with buoyant activity in<br />
the export and manufacturing sectors in Germany. Output<br />
in the industrial sector is on track to increase at a record<br />
pace of around 5% q/q in Q2.<br />
The rate of increase in incoming orders, however, seems to<br />
be topping out, pointing to Ifo’s current assessment index<br />
probably following suit in the coming months. It is already<br />
close to its cycle peaks recording in previous upswings with<br />
the exception of 2006’s ‘pre-crisis boom’ (see chart).<br />
Chart 10: French Sales of Manuf. Goods (3m avg)<br />
20<br />
15<br />
10<br />
5<br />
0<br />
-5<br />
Total (% 3m/3m annualised)<br />
-10<br />
Total excl. autos (% 3m/3m annualised)<br />
-15<br />
Jan Apr Jul Oct Jan Apr Jul Oct Jan Apr Jul Oct Jan Apr<br />
07 08 09 10<br />
Source: Reuters EcoWin Pro<br />
Volume index Jun (f) May Apr Jun 09<br />
SA-WDA<br />
% m/m -0.6 0.7 -1.3 1.9<br />
% y/y -0.5 1.9 1.0 1.3<br />
Key Point:<br />
The seasonal sales only started on 30 June, so the<br />
impact will be smaller than usual during that month,<br />
temporarily pushing down overall sales.<br />
<strong>BNP</strong> Paribas Forecast: Distorted Again<br />
France: Hh Consumption of Manuf. Goods (June)<br />
Release Date: Friday 23 July<br />
The June retail sales data are of particular importance.<br />
Over the past few months, private consumption has been<br />
severely distorted by the car purchase incentives and their<br />
progressive phasing out. This is largely complete.<br />
Nevertheless, we do not necessarily have a clearer view of<br />
the underlying strength of PCE.<br />
May sales were bolstered by an increase of electronic<br />
goods sales, ahead of the World Cup. This helped to revive<br />
retail sales momentum. However, as this factor was most<br />
probably short-lived, it remains to be seen whether<br />
household consumption can remain the engine of French<br />
growth.<br />
The main uncertainty concerns sales of clothes and shoes<br />
(the second most volatile item after new cars); we expect a<br />
relatively solid trend although seasonal sales only started<br />
on the last day of the month so the bulk of sales may only<br />
show up in July. This item should thus drag on seasonally<br />
adjusted retail sales in June.<br />
The last concern with regard to PCE is the impact of the<br />
announcement of the pension reform and the prospect of<br />
fiscal tightening. We believe this has adversely affected<br />
household confidence but should not impact actual<br />
consumption.<br />
<strong>Market</strong> <strong>Economics</strong> 166 July 2010<br />
<strong>Market</strong> Mover<br />
62<br />
www.Global<strong>Market</strong>s.bnpparibas.com
Key Data Preview<br />
Chart 11: UK GDP vs Composite CIPS<br />
Source: Reuters EcoWin Pro<br />
Q2 (f) Q1 Q4 Q3<br />
% q/q 0.6 0.3 0.4 -0.3<br />
% y/y 1.1 -0.2 -2.9 -5.3<br />
Services % q/q 0.5 0.3 0.7 -0.2<br />
Ind Prod % q/q 1.5 1.0 0.5 -0.9<br />
Key Point:<br />
We expect a sharp acceleration in headline GDP<br />
growth, helped by strong industrial production.<br />
<strong>BNP</strong> Paribas Forecast: Improving.<br />
UK: GDP (Q2, preliminary)<br />
Release Date: Friday 23 July<br />
We expect a sharp, albeit short-lived, acceleration in GDP<br />
growth during Q2. Part of the improvement is likely to be<br />
technical. More specifically, widespread snow-related<br />
disruption held back growth during Q1. That should lead to<br />
a snapback during Q2 as output returned to normal.<br />
More generally, the reliable early warning indicators of<br />
growth point to at least double the pace of GDP growth<br />
during Q2. Both the CIPS surveys continued to rise until<br />
mid-Q2, which, given the usual lead times, points to a<br />
catch-up in GDP. Given the tendency for the initial estimate<br />
of GDP to surprise on the downside before being<br />
subsequently revised up, we have aimed low and expect a<br />
0.6% q/q pace of expansion.<br />
The breakdown by output is likely to show a rapid pace of<br />
expansion in industrial production given the recent monthly<br />
data. However, services output has been more subdued.<br />
Given the rolling over in the CIPS surveys in the last month<br />
or so, we suspect that this pace of headline GDP growth<br />
will be temporary and a more pedestrian pace of growth<br />
will resume during H2.<br />
<strong>Market</strong> <strong>Economics</strong> 166 July 2010<br />
<strong>Market</strong> Mover<br />
63<br />
www.Global<strong>Market</strong>s.bnpparibas.com
Economic Calendar: 26 July – 20 August<br />
26 July 27 July 28 July 29 July 30 July<br />
Australia: PPI Jun<br />
Japan: Trade Balance Jun<br />
US: New Home Sales Jun<br />
Eurozone: Monetary<br />
Developments Jun<br />
UK: CBI Distributive<br />
Trades Jul<br />
Germany: GfK Consumer<br />
Confidence Aug<br />
France: Housing Starts<br />
Jun, Job Seekers Jun<br />
Sweden: PPI Jun<br />
Neths: Producer<br />
Confidence Jul<br />
US: S&P CaseShiller<br />
Home Price Index May,<br />
Housing Vacancy Q2,<br />
Consumer Confidence Jul<br />
Australia: CPI Jun<br />
Germany: States’ CoL<br />
Jun, HICP (Prel) Jun<br />
Spain: Retail Sales Jun<br />
US: Durable Goods<br />
Orders Jun, Beige Book<br />
Japan: Retail Sales Jun<br />
Eurozone: Business &<br />
Consumer Survey Jul,<br />
Retail PMI Jul<br />
UK: Net Consumer Credit<br />
Jun, Mortgage Approvals<br />
Jun<br />
Germany: Labour Jun<br />
France: PPI Jun<br />
Italy: Wages Jun, ISAE<br />
Business Confidence Jul<br />
Spain: HICP (Flash) Jul<br />
Belgium: CPI Jun<br />
Sweden: Retail Sales<br />
Jun, Consumer<br />
Confidence Jul<br />
Norway: Labour Jul<br />
During Week: Germany Retail Sales May, UK Nationwide House Prices Jul<br />
2 August 3 August 4 August 5 August 6 August<br />
Eurozone: PMI<br />
Manufacturing (Final) Jul<br />
UK: CIPS Manufacturing<br />
(Final) Jul<br />
Switz: PMI Jul<br />
US: Construction Jun, ISM<br />
Manufacturing Jul, Help<br />
Wanted Jul<br />
Canada: Public Holiday<br />
Australia: RBA <strong>Rate</strong><br />
Announcement, Retail<br />
Sales Jun<br />
Eurozone: PPI Jun<br />
Switz: CPI Jun<br />
US: Personal Income &<br />
Spending Jun, Factory<br />
Orders Jun, Pending<br />
Home Sales May<br />
Australia: Trade Balance<br />
Jun, House Price Index<br />
Q2<br />
Eurozone: Retail Sales<br />
Jun, PMI Services (Final)<br />
Jul<br />
UK: CIPS Services Jul<br />
US: ADP Labour Jul, ISM<br />
Services Jul, Challenger<br />
Layoffs Jul<br />
Eurozone: ECB <strong>Rate</strong><br />
Announcement & Press<br />
Conference<br />
UK: BoE <strong>Rate</strong><br />
Announcement<br />
Germany: Factory Orders<br />
Jun<br />
Spain: Industrial<br />
Production Jun<br />
Sweden: Labour Jun<br />
Norway: Labour May<br />
Neths: CPI Jul<br />
During Week: UK Halifax House Prices Jul<br />
9 August 10 August 11 August 12 August 13 August<br />
Australia: NAB Business<br />
Survey Jul<br />
Japan: M2 Jul, Current<br />
Account Jun<br />
Germany: Trade Balance<br />
Jun<br />
Japan: BoJ <strong>Rate</strong><br />
Announcement<br />
UK: BRC Retail Sales<br />
Monitor Jul, RICS House<br />
Price Balance Jun, Trade<br />
Balance Jun<br />
France: Industrial<br />
Production Jun<br />
Germany: CPI Jul<br />
Norway: CPI Jul, PPI Jul<br />
US: FOMC <strong>Rate</strong><br />
Announcement,<br />
Productivity & Costs<br />
(Prel) Q2, Wholesale<br />
Trade Jun, NFIB Small<br />
Business Optimism Jul<br />
Australia: Westpac<br />
Consumer Confidence<br />
Aug<br />
Japan: CGPI Jul,<br />
Machinery Orders Jun<br />
UK: BoE Inflation Report,<br />
Labour Aug<br />
France: Current Account<br />
Jun<br />
Norway: Norges Bank<br />
<strong>Rate</strong> Announcement<br />
US: Trade Balance Jun,<br />
Treasury Statement Jul<br />
Australia: Labour Jul<br />
Eurozone: Industrial<br />
Production Jun, ECB<br />
Monthly Report<br />
Italy: CPI Jul, EU Trade<br />
Balance Jun<br />
Spain: CPI Jul<br />
Sweden: CPI Jul<br />
Norway: Retail Sales Jun<br />
US: Import Price Index<br />
Jul<br />
Japan: CPI Tokyo Jul, CPI<br />
National Jun, Labour Jun,<br />
Hh Consumption Jun, IP<br />
Jun, Housing Starts Jun<br />
Eurozone: Labour Jun,<br />
HICP (Flash) Jul, Eurocoin<br />
Jul<br />
UK: GfK Cons Conf Jul<br />
Germany: Wages Q2<br />
Italy: PPI Jun, CPI (Prel)<br />
Jul<br />
Spain: Labour Q2<br />
Belgium: GDP (Prel) Q2<br />
Sweden: GDP (Flash) Q2<br />
Switz: KoF Leading<br />
Indicator Aug<br />
Canada: GDP May<br />
US: GDP (Adv) Q2, ECI<br />
Q2, Chicago PMI Jul, UoM<br />
Sentiment (Final) Jul<br />
Japan: Leading Indicator<br />
June<br />
UK: IP Jun, PPI Jun<br />
Germany: IPJun<br />
France: Trade Balance Jun,<br />
Budget Balance Jun<br />
Italy: IP Jun, GDP (Prel) Q2<br />
Norway: IP Jun<br />
Neths: IP Jun<br />
US: Labour Jul, Consumer<br />
Credit Jun<br />
Canada: Labour Jul<br />
Japan: BoJ Monetary<br />
Policy Meeting Minutes<br />
Eurozone: Trade Balance<br />
Jun, GDP (Flash) Q2<br />
Germany: GDP (Prel) Q2<br />
France: CPI Jul, GDP<br />
(Prel) Q2, NF Payrolls<br />
(Prel) Q2, Wages (Prel)<br />
Q2<br />
Spain: GDP (Flash) Q2<br />
Neths: GDP Q2, Retail<br />
Sales Jun<br />
Sweden: IP Jun, AMV<br />
Labour Jul<br />
US: CPI Jul, Retail Sales,<br />
Jul, Business Inventories<br />
Jun, UoM Sentiment (Prel)<br />
Aug<br />
During Week: Germany WPI Jun<br />
16 August 17 August 18 August 19 August 20 August<br />
Japan: GDP (Prel) Q2,<br />
Tertiary Index Jun<br />
Eurozone: HICP Jul<br />
US: Empire State Survey<br />
Aug, TICS Data Jun,<br />
NAHB Housing Index Aug<br />
UK: BoE MPC Minutes<br />
Germany: PPI Jul<br />
Canada: CPI Jul<br />
Australia: RBA MPC<br />
Minutes<br />
Eurozone: Current<br />
Account Jun<br />
UK: CPI Jul<br />
Germany: ZEW Survey<br />
Aug<br />
US: New Home Starts<br />
Jul, PPI Jul, Industrial<br />
Production Jul<br />
UK: PSNCR Jul, PSNB<br />
Jul, Retail Sales Jul<br />
Norway: GDP Q2<br />
Neths: Consumer<br />
Confidence Aug, Labour<br />
Jul<br />
US: Philly Fed Aug,<br />
Leading Indicators Jul<br />
Source: <strong>BNP</strong> Paribas<br />
Release dates as at c.o.b. prior to the date of this publication. See our Daily Spotlight for any revisions<br />
<strong>Market</strong> <strong>Economics</strong> 16 July 2010<br />
<strong>Market</strong> Mover<br />
64<br />
www.Global<strong>Market</strong>s.bnpparibas.com
Treasury and SAS Issuance Calendar<br />
Daily update onto https://globalmarkets.bnpparibas.com, Tools & Apps, Analytical Tools, <strong>Market</strong> Calendar, Government Flows<br />
In the pipeline - Treasuries:<br />
France: Cancels its 5 Aug OAT auction, issuance to resume in Sep<br />
Italy: To issue new BTP Mar-21 and new CTZ Aug-12 in Q3<br />
UK: To hold 2 more syndications: H2 Jul, IL gilt 0.625% Mar40 (tap); H2 Sep, long-dated conv. gilt or IL gilt (details c. 2wks in advance)<br />
Finland: To hold a second syndicated auction (new 5y) most likely in Sep/Oct; H2: to arrange one or two bond auctions<br />
Czech Rep.: Considers carrying out further EUR-denominated domestic auctions during 2010<br />
Denmark: H2 2010, to issue a 5y EUR loan (EUR 1-2bn); opening of a new 5y (Nov 2016) & a new 10y (Nov 2021) DGBs postponed to the<br />
beginning of 2011<br />
Slovak Rep.: Considering issuing new syndicated 15y benchmark bond (around EUR 1.5bn) in the autumn<br />
During the week:<br />
UK: (w/c 2 August mini-tender) choice of gilt on 23 July<br />
US: Announcement of 2-, 5- & 7y Notes (new) details on Thu 22 Jul<br />
FHLB: July Global Notes auction details to be announced on Tue 20 Jul<br />
Date Day Closing Country Issues Details <strong>BNP</strong>P forecasts<br />
Local GMT<br />
16/07 Fri 12:00 03:00 Japan JGBs 10y Auction for Enhanced-liquidity issue 274-305<br />
JGBs 20y Auction for Enhanced-liquidity issue 56-83<br />
JPY 0.3tn<br />
Italy<br />
Exchange Offer CCT 15 Dec 2015 (CCTeu) vs. BTPs<br />
Sep11 & Mar12 and CCTs Mar-Nov12 & Jul13<br />
20/07 Tue 10:00 09:00 Ireland Gilt 4.6% 18 Apr 2016<br />
Gilt 5% 18 Oct 2020<br />
16 Jul EUR 1-1.5bn<br />
10:30 09:30 UK Gilt 4% 7 Sep 2016 GBP 3.75bn<br />
12:00 16:00 Canada Repurchase of 7 Cash Mgt Bonds (Sep10 - Sep11) CAD 1bn<br />
21/07 Wed 11:00 09:00 Germany Bund 4 Jul 2042 (new) EUR 4bn<br />
22/07 Thu 12:00 03:00 Japan JGB 20 Jun 2030 JPY 1.1tn<br />
26/07 Mon 12:00 10:00 Belgium OLO 19 Jul<br />
27/07 Tue 12:00 03:00 Japan JGB 2-year 20 Jul JPY 2.6tn<br />
10:55 08:55 Italy CTZ 22 Jul<br />
Neths DSLs (Off-the-run facility) 21 Jul<br />
13:00 17:00 US Notes 2-year (new) 22 Jul USD 40bn<br />
28/07 Wed 10:55 08:55 Italy BTPeis 22 Jul EUR 1-1.5bn<br />
10:30 09:30 Portugal OTs (To be confirmed) 22 Jul<br />
Denmark DGB 4% 15 Nov 2010 (buy back)<br />
12:00 16:00 Canada CAN 2-year (Repurchase/Switch) 22 Jul<br />
13:00 17:00 US Notes 5-year (new) 22 Jul USD 38bn<br />
29/07 Thu 10:55 08:55 Italy 3 & 10y BTPs and CCT 22 Jul<br />
13:00 17:00 US Notes 7-year (new) 22 Jul USD 30bn<br />
03/08 Tue 12:00 03:00 Japan JGB 10-year 27 Jul JPY 2.2tn<br />
11:00 09:00 Austria RAGBs (Reserve date) 27 Jul<br />
10:30 09:30 UK Gilt 2.75% 22 Jan 2015 27 Jul<br />
04/08 Wed 12:00 16:00 Canada CAN 3-year 29 Jul<br />
05/08 Thu 12:00 03:00 Japan JGB 40-year 29 Jul JPY 0.3tn<br />
10:30 08:30 Spain Bono 2.5% 31 Oct 2013 2 Aug<br />
09/08 Mon 12:00 03:00 Japan Auction for Enhanced-liquidity 2 Aug JPY 0.3tn<br />
10/08 Tue 10:30 09:30 UK Gilt 4.5% 7 Sep 2034 3 Aug<br />
13:00 17:00 US Notes 3-year (new) 4 Aug USD 35bn<br />
11/08 Wed 12:00 03:00 Japan JGB 5-year 4 Aug JPY 2.4tn<br />
11:00 09:00 Germany Schatz 14 Sep 2012 (new) EUR 7bn<br />
10:30 09:30 Portugal OTs (To be confirmed) 5 Aug<br />
12:00 16:00 Canada CAN 2-year 5 Aug<br />
13:00 17:00 US Notes 10-year (new) 4 Aug USD 24bn<br />
12/08 Thu 10:30 09:30 UK Gilt 4% 7 Mar 2022 3 Aug<br />
13:00 17:00 US Bond 30-year (new) 4 Aug USD 16bn<br />
13/08 Fri 10:55 08:55 Italy 5-year BTP and possibly 15- or 30-year BTP 6 Aug<br />
16/08 Mon Slovak Rep. SLOVGB 3.5% 24 Feb 2016 (#213)<br />
17/08 Tue 10:00 09:00 Ireland Gilts 10 Aug EUR 1-1.5bn<br />
Denmark DGB 12 Aug<br />
18/08 Wed 11:00 09:00 Germany Bund 4 Sep 2020 (new) EUR 6bn<br />
11:00 09:00 Sweden T-bonds 11 Aug SEK 2.5bn<br />
12:00 16:00 Canada CAN 5-year 12 Aug<br />
19/08 Thu 12:00 03:00 Japan Auction for Enhanced-liquidity 12 Aug JPY 0.3tn<br />
10:30 09:30 UK Index-Linked Gilt 1.25% 22 Nov 2027 10 Aug GBP 1bn<br />
Sources: Treasuries, <strong>BNP</strong> Paribas<br />
<strong>Interest</strong> <strong>Rate</strong> <strong>Strategy</strong> 16 July 2010<br />
<strong>Market</strong> Mover, Non-Objective Research Section<br />
65<br />
www.Global<strong>Market</strong>s.bnpparibas.com
Next week's T-Bills Supply<br />
Date Country Issues Details<br />
16/07 UK T-Bills Aug 2010 GBP 1bn<br />
T-Bills Oct 2010<br />
GBP 1.5bn<br />
T-Bills Jan 2011<br />
GBP 1.5bn<br />
Canada T-Bill Aug10 (Cash Mgt) CAD 1.5bn<br />
19/07 France BTF Sep 2010 EUR 1.5bn<br />
BTF Oct 2010<br />
EUR 4.5bn<br />
BTF Jan 2011<br />
EUR 2.5bn<br />
Germany Bubills Apr 2011 EUR 2bn<br />
Neths DTC Oct 2010 EUR 1.5-3bn<br />
DTC Nov 2010<br />
EUR 1.5-3bn<br />
DTC Mar 2011<br />
EUR 1-2.5bn<br />
US T-Bills Oct 2010 USD 30bn<br />
T-Bills Jan 2011 (new) USD 30bn<br />
FHLMC Bills 3-month & 6-month 16 Jul<br />
20/07 Japan T-Bills Sep 2010 JPY 2.5tn<br />
Spain Letras Jul 2011 19 Jul<br />
Letras Dec 2011<br />
19 Jul<br />
Canada T-Bill Oct 2010 CAD 7.4bn<br />
T-Bill Jan 2011<br />
CAD 2.8bn<br />
T-Bill Jul 2011<br />
CAD 2.8bn<br />
US T-Bills 4-week 19 Jul<br />
FHLB Discount Notes<br />
21/07 Japan T-Bills Oct 2010 JPY 4.8tn<br />
Portugal BT Jul 2011 (new) EUR 1.25bn<br />
FNMA Bills 3-month & 6-month 19 Jul<br />
22/07 Ireland T-Bills 20 Jul<br />
FHLB Discount Notes<br />
23/07 UK T-Bills 16 Jul<br />
Sources: Treasuries, <strong>BNP</strong> Paribas<br />
Next week's Eurozone Redemptions<br />
Date Country Details Amount<br />
19/07 Austria ATB (EU20) EUR 0.2bn<br />
19/07 Austria ATB (EU16) EUR 0.1bn<br />
20/07 Austria ATB EUR 0.7bn<br />
21/07 Finland T-Bills EUR 0.7bn<br />
22/07 France BTF EUR 8.5bn<br />
23/07 Spain Letras EUR 7.6bn<br />
23/07 Greece GTB (13W) EUR 2.4bn<br />
23/07 Portugal BT EUR 4.5bn<br />
Total Eurozone Short-term Redemption EUR 24.7bn<br />
Next week's Eurozone Coupons<br />
Country<br />
Amount<br />
Greece<br />
EUR 2.4bn<br />
Total Long-term Coupon Payments<br />
EUR 2.4bn<br />
<strong>Interest</strong> <strong>Rate</strong> <strong>Strategy</strong> 16 July 2010<br />
<strong>Market</strong> Mover, Non-Objective Research Section<br />
66<br />
www.Global<strong>Market</strong>s.bnpparibas.com
Central Bank Watch<br />
<strong>Interest</strong> <strong>Rate</strong><br />
EUROZONE<br />
Current<br />
<strong>Rate</strong> (%)<br />
Minimum Bid <strong>Rate</strong> 1.00<br />
US<br />
Fed Funds <strong>Rate</strong> 0 to 0.25<br />
Discount <strong>Rate</strong> 0.75<br />
JAPAN<br />
Call <strong>Rate</strong> 0.10<br />
Basic Loan <strong>Rate</strong> 0.30<br />
UK<br />
Bank <strong>Rate</strong> 0.5<br />
DENMARK<br />
Lending <strong>Rate</strong> 1.05<br />
SWEDEN<br />
Repo <strong>Rate</strong> 0.50<br />
NORWAY<br />
Sight Deposit <strong>Rate</strong> 2.00<br />
SWITZERLAND<br />
3 Mth LIBOR Target<br />
Range<br />
CANADA<br />
0.0-0.75<br />
Overnight <strong>Rate</strong> 0.50<br />
Bank <strong>Rate</strong> 0.75<br />
AUSTRALIA<br />
Cash <strong>Rate</strong> 4.50<br />
CHINA<br />
1Y Bank Lending<br />
<strong>Rate</strong><br />
BRAZIL<br />
5.31%<br />
Selic Overnight <strong>Rate</strong> 10.25<br />
Date of Last<br />
Change<br />
-25bp<br />
(7/5/09)<br />
-75bp<br />
(16/12/08)<br />
+25bp<br />
(18/2/10)<br />
-20bp<br />
(19/12/08)<br />
-20bp<br />
(19/12/08)<br />
-50bp<br />
(5/3/09)<br />
-10bp<br />
(14/1/10)<br />
+25bp<br />
(1/7/10)<br />
+25bp<br />
(5/5/09)<br />
-25bp<br />
(12/3/09)<br />
+25bp<br />
(1/6/10)<br />
+25bp<br />
(1/6/10)<br />
+25bp<br />
(5/5/10)<br />
-27bp<br />
(22/12/08)<br />
+75bp<br />
(09/6/10)<br />
Source: <strong>BNP</strong> Paribas<br />
Next Change in<br />
Coming 6 Months<br />
No Change<br />
No Change<br />
No Change<br />
No Change<br />
No Change<br />
No Change<br />
No Change<br />
+25bp<br />
(2/9/10)<br />
+25bp<br />
(15/12/10)<br />
No Change<br />
+25bp<br />
(20/7/10)<br />
+25bp<br />
(20/7/10)<br />
+25bp<br />
(2/11/10)<br />
No Change<br />
+75bp<br />
(21/7/10)<br />
Comments<br />
The uneven, lacklustre recovery and low inflation pressures imply<br />
no rise in the refinancing rate for a considerable period of time.<br />
The FOMC should maintain the funds rate at 0 to 0.25% for an<br />
extended period and will probably keep the discount rate where<br />
it is for now.<br />
The BoJ could expand its liquidity provision further in order to<br />
cooperate with the government in countering deflation and the<br />
yen’s appreciation.<br />
We expect the MPC to reengage in asset purchases from<br />
August onwards.<br />
We expect the central bank to draw on its FX reserves to defend<br />
the currency, given the recent up-tick in EUR/DKK. If this proves<br />
unsuccessful, policy rates will likely be raised.<br />
Given strong domestic demand, increases in employment and<br />
re-accelaration in house prices, we expect the Riksbank to<br />
deliver its second rate hike in this cycle in September.<br />
Weaker-than-expected growth since the start of the year and<br />
uncertainty over Norway’s economic outlook due to<br />
developments elsewhere in Europe suggest further rate hikes<br />
will come gradually. We expect the next hike in December.<br />
<strong>Rate</strong>s are looking inappropriate given the strength of the<br />
domestic economy. But we expect the first hike to be delayed to<br />
early 2011 by an intensification of the fiscal and financial stress<br />
in the markets over the coming months.<br />
Barring a re-intensification of global financial troubles, we expect<br />
the BoC to deliver an additional 0.75bp of tightening over H2<br />
2010. The BoC is then expected to pause at 1.25% to re-assess<br />
the situation.<br />
The RBA noted in its June statement that policy was appropriate<br />
for the “near term”. This appears to rule out any move in the<br />
coming months, especially in the context of volatility in global<br />
markets. However, likely strong Q2 growth should be enough to<br />
prompt a hike late in the year.<br />
Significant monetary tightening has slowed credit growth and<br />
boosted money market rates while both economic growth and<br />
inflation are decelerating; the eurozone sovereign crisis is<br />
further clouding the export outlook. As all these factors call for<br />
policy flexibility, we no longer expect further hikes in the RRR or<br />
any interest rate hikes in 2010.<br />
Given the robust recovery in domestic demand, the very low<br />
level of economic slack, still-elevated inflation expectations and<br />
relatively loose fiscal policy, the BCB should continue to tighten<br />
monetary conditions with bold hikes.<br />
Change since our last weekly in bold and italics<br />
For the full EMK Central Bank Watch please see our Local <strong>Market</strong>s Mover<br />
<strong>Market</strong> <strong>Economics</strong> 16 July 2010<br />
<strong>Market</strong> Mover<br />
67<br />
www.Global<strong>Market</strong>s.bnpparibas.com
Economic Forecasts<br />
GDP<br />
Year 2010<br />
2011<br />
(% y/y) ’09 ’10 (1) ’11 (1) Q1 Q2 (1) Q3 (1) Q4 (1) Q1 (1) Q2 (1) Q3 (1) Q4 (1)<br />
US -2.4 2.9 2.8 2.4 3.4 3.4 2.6 2.6 2.7 2.9 3.1<br />
Eurozone -4.1 1.2 0.6 0.6 1.4 1.3 1.4 1.2 0.6 0.4 0.4<br />
Japan -5.2 3.6 2.3 4.6 3.0 3.7 3.2 2.4 2.5 2.2 2.1<br />
World (2) -0.6 4.5 3.8 4.7 4.8 4.5 4.2 3.9 3.8 3.8 3.9<br />
Industrial Production<br />
Year<br />
2010<br />
2011<br />
(% y/y) ’09 ’10 (1) ’11 (1) Q1 Q2 (1) Q3 (1) Q4 (1) Q1 (1) Q2 (1) Q3 (1) Q4 (1)<br />
US -9.7 5.5 4.6 2.4 7.0 6.6 5.9 5.1 4.5 4.4 4.5<br />
Eurozone -14.6 8.1 0.8 4.2 10.1 9.9 8.0 3.4 0.4 -0.2 -0.3<br />
Japan -21.9 18.6 5.3 27.5 21.4 16.5 11.7 5.7 5.2 5.4 4.8<br />
Unemployment <strong>Rate</strong><br />
Year<br />
2010 2011<br />
(%) ’09 ’10 (1) ’11 (1) Q1 Q2 (1) Q3 (1) Q4 (1) Q1 (1) Q2 (1) Q3 (1) Q4 (1)<br />
US 9.3 9.6 8.5 9.7 9.8 9.6 9.5 9.2 8.7 8.2 8.0<br />
Eurozone 9.4 10.0 10.3 10.0 10.0 10.0 10.0 10.1 10.2 10.3 10.4<br />
Japan 5.1 4.8 4.2 4.9 5.1 4.8 4.6 4.4 4.3 4.1 4.0<br />
CPI<br />
Year<br />
2010<br />
2011<br />
(% y/y) ’09 ’10 (1) ’11 (1) Q1 Q2 (1) Q3 (1) Q4 (1) Q1 (1) Q2 (1) Q3 (1) Q4 (1)<br />
US -0.4 1.7 1.0 2.4 1.8 1.4 1.2 1.0 1.3 1.0 0.7<br />
Eurozone 0.3 1.6 1.5 1.1 1.5 1.8 2.1 2.0 1.5 1.4 1.3<br />
Japan -1.4 -0.6 -0.2 -1.2 -0.9 -0.5 0.2 -0.3 -0.2 -0.1 -0.2<br />
Current Account<br />
(% GDP) ’09<br />
Year<br />
’10 (1) ’11 (1) General Government<br />
(% GDP)<br />
’09<br />
Year<br />
’10 (1) ’11 (1)<br />
US -2.7 -2.7 -2.7 US (4) -9.9 -10.0 -8.4<br />
Eurozone -0.6 -0.3 -0.1 Eurozone -6.3 -6.6 -5.3<br />
Japan 2.8 3.9 3.9 Japan -10.7 -9.4 -6.8<br />
<strong>Interest</strong> <strong>Rate</strong> Forecasts<br />
<strong>Interest</strong> <strong>Rate</strong> (3)<br />
Year<br />
2010<br />
2011<br />
(%) ’09 ’10 (1) ’11 (1) Q1 Q2 Q3 Q4 Q1 Q2 (1) Q3 (1) Q4 (1)<br />
US<br />
Fed Funds <strong>Rate</strong> 0.25 0.25 0.25 0.25 0.25 0.25 0.25 0.25 0.25 0.25 0.25<br />
3-month <strong>Rate</strong> 0.25 0.95 0.75 0.29 0.54 1.00 0.95 0.90 0.85 0.80 0.75<br />
2-year yield 1.14 0.75 2.00 1.02 0.68 0.75 0.75 0.85 1.00 1.25 2.00<br />
10-year yield 3.84 3.00 3.75 3.83 3.12 2.90 3.00 3.10 3.25 3.50 3.75<br />
2y/10y Spread (bp) 269 225 175 281 244 215 225 225 225 225 175<br />
Eurozone<br />
Refinancing <strong>Rate</strong> 1.00 1.00 1.00 1.00 1.00 1.00 1.00 1.00 1.00 1.00 1.00<br />
3-month <strong>Rate</strong> 0.70 0.70 1.00 0.63 0.74 0.85 0.70 0.65 0.70 0.80 1.00<br />
2-year yield 1.37 0.50 1.25 0.97 0.58 0.40 0.50 0.50 0.50 0.50 1.25<br />
10-year yield 3.40 2.00 3.00 3.10 2.65 2.20 2.00 2.10 2.25 2.60 3.00<br />
2y/10y Spread (bp) 203 150 175 212 207 180 150 160 175 210 175<br />
Japan<br />
O/N Call <strong>Rate</strong> 0.10 0.10 0.10 0.10 0.10 0.10 0.10 0.10 0.10 0.10 0.10<br />
3-month <strong>Rate</strong> 0.46 0.40 0.40 0.43 0.38 0.40 0.40 0.40 0.40 0.40 0.40<br />
2-year yield 0.15 0.25 0.75 0.18 0.16 0.20 0.25 0.30 0.35 0.55 0.75<br />
10-year yield 1.30 1.40 1.80 1.40 1.15 1.30 1.40 1.50 1.60 1.70 1.80<br />
2y/10y Spread (bp) 115 115 105 122 99 110 115 120 125 115 105<br />
Footnotes: (1) Forecast (2) Country weights used to construct world growth are those in the IMF World Economic Outlook Update<br />
April 2010 (3) End Period (4) Fiscal year Figures are y/y percentage change unless otherwise indicated<br />
<strong>Market</strong> <strong>Economics</strong> / <strong>Interest</strong> <strong>Rate</strong> <strong>Strategy</strong> 16 July 2010<br />
<strong>Market</strong> Mover<br />
68<br />
www.Global<strong>Market</strong>s.bnpparibas.com
FX Forecasts*<br />
USD Bloc Q3 '10 Q4 '10 Q1 '11 Q2 '11 Q3 '11 Q4 '11 Q1 '12 Q2 '12 Q3 '12 Q4 '12 Q1 '13<br />
EUR/USD 1.16 1.08 1.00 0.98 0.97 1.00 1.05 1.08 1.12 1.15 1.17<br />
USD/JPY 85 88 94 101 106 114 118 121 124 126 123<br />
USD/CHF 1.12 1.18 1.29 1.33 1.35 1.33 1.29 1.26 1.23 1.22 1.40<br />
GBP/USD 1.43 1.35 1.28 1.26 1.21 1.27 1.24 1.24 1.26 1.28 1.31<br />
USD/CAD 1.02 0.98 0.95 0.90 0.87 0.90 0.95 1.00 1.02 1.09 1.11<br />
AUD/USD 0.86 0.90 0.94 0.97 0.97 0.95 0.92 0.93 0.92 0.90 0.87<br />
NZD/USD 0.71 0.74 0.78 0.78 0.75 0.73 0.72 0.69 0.67 0.66 0.64<br />
USD/SEK 8.02 8.43 9.20 9.29 9.59 9.30 8.76 8.70 8.57 8.43 8.12<br />
USD/NOK 6.81 7.13 7.35 7.55 7.84 7.50 7.05 6.94 6.79 6.52 6.24<br />
EUR Bloc Q3 '10 Q4 '10 Q1 '11 Q2 '11 Q3 '11 Q4 '11 Q1 '12 Q2 '12 Q3 '12 Q4 '12 Q1 '13<br />
EUR/JPY 99 95 94 99 103 114 124 131 139 145 144<br />
EUR/GBP 0.81 0.80 0.78 0.78 0.80 0.79 0.85 0.87 0.89 0.90 0.89<br />
EUR/CHF 1.30 1.27 1.29 1.30 1.31 1.33 1.35 1.36 1.38 1.40 1.64<br />
EUR/SEK 9.30 9.10 9.20 9.10 9.30 9.30 9.20 9.40 9.60 9.70 9.50<br />
EUR/NOK 7.90 7.70 7.35 7.40 7.60 7.50 7.40 7.50 7.60 7.50 7.30<br />
EUR/DKK 7.46 7.46 7.46 7.46 7.46 7.46 7.46 7.46 7.46 7.46 7.46<br />
Central Europe Q3 '10 Q4 '10 Q1 '11 Q2 '11 Q3 '11 Q4 '11 Q1 '12 Q2 '12 Q3 '12 Q4 '12 Q1 '13<br />
USD/PLN 3.62 3.70 4.20 4.23 4.18 3.95 3.71 3.56 3.39 3.26 3.16<br />
EUR/CZK 26.5 26.0 25.8 25.5 25.0 24.7 24.3 24.0 23.9 23.8 24.0<br />
EUR/HUF 275 270 275 270 270 265 250 250 250 245 235<br />
USD/ZAR 7.80 8.00 7.90 8.20 8.00 8.00 7.80 7.80 7.50 7.70 7.00<br />
USD/TRY 1.56 1.59 1.60 1.60 1.61 1.62 1.60 1.58 1.56 1.54 1.45<br />
EUR/RON 4.50 4.40 4.35 4.25 4.20 4.05 4.00 3.95 3.90 3.80 3.90<br />
USD/RUB 30.78 31.37 32.25 32.29 32.24 31.50 30.32 29.68 28.94 28.29 29.73<br />
EUR/PLN 4.20 4.00 4.20 4.15 4.05 3.95 3.90 3.85 3.80 3.75 3.70<br />
USD/UAH 7.9 8.0 7.5 7.7 7.5 7.5 7.4 7.2 7.0 7.5 -----<br />
EUR/RSD 110 110 105 115 105 100 90 86 87 85 86<br />
Asia Bloc Q3 '10 Q4 '10 Q1 '11 Q2 '11 Q3 '11 Q4 '11 Q1 '12 Q2 '12 Q3 '12 Q4 '12 Q1 '13<br />
USD/SGD 1.36 1.34 1.33 1.32 1.31 1.30 1.30 1.30 1.30 1.30 -----<br />
USD/MYR 3.15 3.10 3.07 3.05 3.03 3.00 3.00 3.00 3.00 3.00 -----<br />
USD/IDR 8800 8600 8500 8400 8300 8200 8100 8000 8000 8000 -----<br />
USD/THB 32.30 32.00 31.70 31.50 31.30 31.00 31.00 31.00 31.00 31.00 -----<br />
USD/PHP 44.00 43.00 42.50 42.00 41.50 41.00 41.00 41.00 41.00 41.00 -----<br />
USD/HKD 7.80 7.80 7.80 7.80 7.80 7.80 7.80 7.80 7.80 7.80 -----<br />
USD/RMB 6.70 6.80 6.75 6.70 6.64 6.60 6.54 6.49 6.45 6.41 -----<br />
USD/TWD 31.00 30.00 29.70 29.50 29.30 29.00 29.00 29.00 29.00 29.00 -----<br />
USD/KRW 1100 1050 1030 1020 1010 1000 1000 1000 1000 1000 -----<br />
USD/INR 43.50 42.00 41.00 40.00 39.00 38.00 38.00 38.00 38.00 38.00 -----<br />
USD/VND 20000 20500 20500 20500 20500 20500 20500 20500 20500 20500 -----<br />
LATAM Bloc Q3 '10 Q4 '10 Q1 '11 Q2 '11 Q3 '11 Q4 '11 Q1 '12 Q2 '12 Q3 '12 Q4 '12 Q1 '13<br />
USD/ARS 4.10 4.20 4.25 4.35 4.45 4.50 4.60 4.70 4.80 4.90 4.95<br />
USD/BRL 1.80 1.75 1.72 1.70 1.70 1.75 1.80 1.85 1.90 1.90 1.91<br />
USD/CLP 520 510 500 490 485 495 505 510 510 515 520<br />
USD/MXN 12.20 11.90 11.70 11.50 11.40 11.60 11.85 11.90 12.00 12.00 12.00<br />
USD/COP 1900 1875 1850 1825 1825 1875 1900 1925 1950 1950 1955<br />
USD/VEF (Priority) (1) 4.29 4.29 4.29 4.29 4.29 4.29 8.80 8.80 8.80 8.80 8.80<br />
USD/VEF (Oil) (1) 2.59 2.59 2.59 2.59 2.59 2.59 5.30 5.30 5.30 5.30 5.30<br />
Others Q3 '10 Q4 '10 Q1 '11 Q2 '11 Q3 '11 Q4 '11 Q1 '12 Q2 '12 Q3 '12 Q4 '12 Q1 '13<br />
USD Index 88.61 93.44 99.58 101.62 103.22 102.03 100.08 99.11 97.26 96.30 95.20<br />
*End Quarter<br />
(1) Following the devaluation of the VEF, there is now an official ‘priority’ exchange rate and a so-called ‘oil’ exchange rate used for certain transactions<br />
Source: <strong>BNP</strong> Paribas<br />
Foreign Exchange <strong>Strategy</strong> 16 July 2010<br />
<strong>Market</strong> Mover<br />
69<br />
www.Global<strong>Market</strong>s.bnpparibas.com
<strong>Market</strong> Coverage<br />
<strong>Market</strong> <strong>Economics</strong><br />
Paul Mortimer-Lee Global Head of <strong>Market</strong> <strong>Economics</strong> London 44 20 7595 8551 paul.mortimer-lee@uk.bnpparibas.com<br />
Ken Wattret Chief Eurozone <strong>Market</strong> Economist London 44 20 7595 8657 kenneth.wattret@uk.bnpparibas.com<br />
Luigi Speranza Head of Inflation <strong>Economics</strong>, Eurozone, Italy London 44 20 7595 8322 luigi.speranza@uk.bnpparibas.com<br />
Alan Clarke UK London 44 20 7595 8476 alan.clarke@uk.bnpparibas.com<br />
Eoin O’Callaghan Inflation, Eurozone, Switzerland, Ireland London 44 20 7595 8226 eoin.ocallaghan@uk.bnpparibas.com<br />
Gizem Kara Scandinavia London 44 20 7595 8783 gizem.kara@uk.bnpparibas.com<br />
Dominique Barbet Eurozone, France Paris 33 1 4298 1567 dominique.barbet@bnpparibas.com<br />
Brian Fabbri Chief Economist North America New York 1 212 841 3633 brian.fabbri@americas.bnpparibas.com<br />
Julia Coronado Senior US Economist New York 1 212 841 2281 julia.l.coronado@americas.bnpparibas.com<br />
Yelena Shulyatyeva US, Canada New York 1 212 841 2258 yelena.shulyatyeva @americas.bnpparibas.com<br />
Ryutaro Kono Chief Economist Japan Tokyo 81 3 6377 1601 ryutaro.kono@japan.bnpparibas.com<br />
Hiroshi Shiraishi Japan Tokyo 81 3 6377 1602 hiroshi.shiraishi@japan.bnpparibas.com<br />
Azusa Kato Japan Tokyo 81 3 6377 1603 azusa.kato@japan.bnpparibas.com<br />
Richard Iley Head of Asia <strong>Economics</strong> Hong Kong 852 2108 5104 richard.iley@asia.bnpparibas.com<br />
Dominic Bryant Asia, Australia Hong Kong 852 2108 5105 dominic.bryant@asia.bnpparibas.com<br />
Chan Kok Peng Chief Economist South East Asia Singapore 65 6210 1946 kokpeng.chan@asia.bnpparibas.com<br />
Michal Dybula Central & Eastern Europe Warsaw 48 22 697 2354 michal.dybula@pl.bnpparibas.com<br />
Julia Tsepliaeva Russia & CIS Moscow 74 95 785 6022 julia.tsepliaeva@ru.bnpparibas.com<br />
Italo Lombardi Latin America New York 1 212 841 6599 italo.lombardi@americas.bnpparibas.com<br />
Diego Donadio Latin America São Paulo 55 11 3841 3421 diego.donadio@@br.bnpparibas.com<br />
<strong>Interest</strong> <strong>Rate</strong> <strong>Strategy</strong><br />
Cyril Beuzit Global Head of <strong>Interest</strong> <strong>Rate</strong> <strong>Strategy</strong> London 44 20 7595 8639 cyril.beuzit@uk.bnpparibas.com<br />
Patrick Jacq Europe Strategist Paris 33 1 4316 9718 patrick.jacq@bnpparibas.com<br />
Hervé Cros Chief Inflation Strategist London 44 20 7595 8419 herve.cros@uk.bnpparibas.com<br />
Shahid Ladha Inflation Strategist London 44 20 7 595 8573 shahid.ladha@uk.bnpparibas.com<br />
Alessandro Tentori Chief Alpha <strong>Strategy</strong> Europe London 44 20 7595 8238 alessandro.tentori@uk.bnpparibas.com<br />
Matteo Regesta Europe Alpha Strategist London 44 20 7595 8607 matteo.regesta@uk.bnpparibas.com<br />
Ioannis Sokos Europe Alpha Strategist London 44 20 7595 8671 ioannis.sokos@uk.bnpparibas.com<br />
Camille de Courcel Europe Alpha Strategist London 44 20 7595 8295 camille.decourcel@uk.bnpparibas.com<br />
Bülent Baygün Head of <strong>Interest</strong> <strong>Rate</strong> <strong>Strategy</strong> US New York 1 212 471 8043 bulent.baygun@americas.bnpparibas.com<br />
Mary-Beth Fisher US Senior Strategist New York 1 212 841 2912 mary-beth.fisher@us.bnpparibas.com<br />
Sergey Bondarchuk US Strategist New York 1 212 841 2026 sergey.bondarchuk@americas.bnpparibas.com<br />
Suvrat Prakash US Strategist New York 1 917 472 4374 suvrat.prakash@americas.bnpparibas.com<br />
Rohit Garg US Strategist New York 1212 841 3937 rohit.k.garg@americas.bnpparibas.com<br />
Anish Lohokare MBS Strategist New York 1 212 841 2867 anish.lohokare@americas.bnpparibas.com<br />
Olurotimi Ajibola MBS Strategist New York 1 212 8413831 olurotimi.ajibola@americas.bnpparibas.com<br />
Koji Shimamoto Head of <strong>Interest</strong> <strong>Rate</strong> <strong>Strategy</strong> Japan Tokyo 81 3 6377 1700 koji.shimamoto@japan.bnpparibas.com<br />
Tomohisa Fujiki Japan Strategist Tokyo 81 3 6377 1703 Tomohisa.fujiki@japan.bnpparibas.com<br />
Masahiro Kikuchi Japan Strategist Tokyo 81 3 6377 1703 masahiro.kikuchi@japan.bnpparibas.com<br />
Christian Séné Technical Analyst Paris 33 1 4316 9717 christian.séné@bnpparibas.com<br />
FX <strong>Strategy</strong><br />
Hans Redeker Global Head of FX <strong>Strategy</strong> London 44 20 7595 8086 hans-guenter.redeker@uk.bnpparibas.com<br />
Ian Stannard FX Strategist London 44 20 7595 8086 ian.stannard@uk.bnpparibas.com<br />
James Hellawell Quantitative Strategist London 44 20 7595 8485 james.hellawell@uk.bnpparibas.com<br />
Sebastien Galy FX Strategist New York 1 212 841 2492 sebastien.galy@bnpparibas.com<br />
Andy Chaveriat Technical Analyst New York 1 212 841 2408 andrew.chaveriat@americas.bnpparibas.com<br />
Emerging <strong>Market</strong>s FX & <strong>Interest</strong> <strong>Rate</strong> <strong>Strategy</strong><br />
Drew Brick Head of FX & IR <strong>Strategy</strong> Asia Singapore 65 6210 3262 Drew.brick@asia.bnpparibas.com<br />
Chin Loo Thio FX & IR Asia Strategist Singapore 65 6210 3263 chin.thio@asia.bnpparibas.com<br />
Robert Ryan FX & IR Asia Strategist Singapore 65 6210 3314 robert.ryan@asia.bnpparibas.com<br />
Gao Qi FX & IR Asia Strategist Singapore 65 6210 3264 gao.qi@asia.bnpparibas.com<br />
Shahin Vallée Head of FX & IR <strong>Strategy</strong> CEEMEA London 44 20 7595 8306 shahin.vallee@uk.bnpparibas.com<br />
Elisabeth Gruié FX & IR CEEMEA Strategist London 44 20 7595 8492 elisabeth.gruie@uk.bnpparibas.com<br />
Bartosz Pawlowski FX & IR CEEMEA Strategist London 44 20 7595 8195 Bartosz.pawlowski@uk.bnpparibas.com<br />
For Production and Distribution, please contact:<br />
Ann Aston, <strong>Market</strong> <strong>Economics</strong>, London. Tel: 44 20 7595 8503 Email: ann.aston@uk.bnpparibas.com<br />
Danielle Catananzi, <strong>Interest</strong> <strong>Rate</strong> <strong>Strategy</strong>, London. Tel: 44 20 7595 4418 Email: danielle.catananzi@uk.bnpparibas.com<br />
Derek Allassani, FX <strong>Strategy</strong>, London. Tel: 44 20 7595 8486 Email: derek.allassani@uk.bnpparibas.com<br />
Martine Borde, <strong>Market</strong> <strong>Economics</strong>/<strong>Interest</strong> <strong>Rate</strong> <strong>Strategy</strong>, Paris. Tel: 33 1 4298 4144 Email martine.borde@bnpparibas.com<br />
Editors<br />
Amanda Grantham-Hill, <strong>Interest</strong> <strong>Rate</strong> <strong>Strategy</strong>/<strong>Market</strong> <strong>Economics</strong>, London. Tel: 44 20 7595 4107 Email: amanda.grantham-hill@bnpparibas.com<br />
Nick Ashwell, FX/<strong>Market</strong> <strong>Economics</strong>, London. Tel: 44 20 7595 4120 Email: nick.ashwell@uk.bnpparibas.com<br />
<strong>BNP</strong> Paribas Global Fixed Income Website<br />
www.globalmarkets.bnpparibas.com<br />
Bloomberg<br />
Fixed Income Research BPCM <strong>Market</strong> <strong>Economics</strong> BPEC<br />
<strong>Interest</strong> <strong>Rate</strong> <strong>Strategy</strong> BPBS Forex <strong>Strategy</strong> BPFR<br />
70
RESEARCH DISCLAIMERS:<br />
IMPORTANT DISCLOSURES: Please see important disclosures in the text of this report.<br />
Some sections of this report have been written by our strategy teams. These sections are clearly labelled and do not purport to be an exhaustive<br />
analysis, and may be subject to conflicts of interest resulting from their interaction with sales and trading which could affect the objectivity of this<br />
report. (Please see further important disclosures in the text of this report). These sections are a marketing communication. They are not<br />
independent investment research. They have not been prepared in accordance with legal requirements designed to provide the independence<br />
of investment research, and are not subject to any prohibition on dealing ahead of the dissemination of investment research.<br />
The information and opinions contained in this report have been obtained from, or are based on, public sources believed to be reliable, but no<br />
representation or warranty, express or implied, is made that such information is accurate, complete or up to date and it should not be relied<br />
upon as such. This report does not constitute an offer or solicitation to buy or sell any securities or other investment. Information and opinions<br />
contained in the report are published for the assistance of recipients, but are not to be relied upon as authoritative or taken in substitution for the<br />
exercise of judgement by any recipient, are subject to change without notice and not intended to provide the sole basis of any evaluation of the<br />
instruments discussed herein. Any reference to past performance should not be taken as an indication of future performance. To the fullest<br />
extent permitted by law, no <strong>BNP</strong> Paribas group company accepts any liability whatsoever (including in negligence) for any direct or<br />
consequential loss arising from any use of or reliance on material contained in this report. All estimates and opinions included in this report are<br />
made as of the date of this report. Unless otherwise indicated in this report there is no intention to update this report. <strong>BNP</strong> Paribas SA and its<br />
affiliates (collectively “<strong>BNP</strong> Paribas”) may make a market in, or may, as principal or agent, buy or sell securities of any issuer or person<br />
mentioned in this report or derivatives thereon. <strong>BNP</strong> Paribas may have a financial interest in any issuer or person mentioned in this report,<br />
including a long or short position in their securities and/or options, futures or other derivative instruments based thereon, or vice versa. <strong>BNP</strong><br />
Paribas, including its officers and employees may serve or have served as an officer, director or in an advisory capacity for any person<br />
mentioned in this report. <strong>BNP</strong> Paribas may, from time to time, solicit, perform or have performed investment banking, underwriting or other<br />
services (including acting as adviser, manager, underwriter or lender) within the last 12 months for any person referred to in this report. <strong>BNP</strong><br />
Paribas may be a party to an agreement with any person relating to the production of this report. <strong>BNP</strong> Paribas, may to the extent permitted by<br />
law, have acted upon or used the information contained herein, or the research or analysis on which it was based, before its publication. <strong>BNP</strong><br />
Paribas may receive or intend to seek compensation for investment banking services in the next three months from or in relation to any person<br />
mentioned in this report. Any person mentioned in this report may have been provided with sections of this report prior to its publication in order<br />
to verify its factual accuracy.<br />
<strong>BNP</strong> Paribas is incorporated in France with limited liability. Registered Office 16 Boulevard des Italiens, 75009 Paris. This report was produced<br />
by a <strong>BNP</strong> Paribas group company. This report is for the use of intended recipients and may not be reproduced (in whole or in part) or delivered<br />
or transmitted to any other person without the prior written consent of <strong>BNP</strong> Paribas. By accepting this document you agree to be bound by the<br />
foregoing limitations.<br />
Certain countries within the European Economic Area:<br />
This report is solely prepared for professional clients. It is not intended for retail clients and should not be passed on to any such persons.<br />
This report has been approved for publication in the United Kingdom by <strong>BNP</strong> Paribas London Branch. <strong>BNP</strong> Paribas London Branch is<br />
authorised by CECEI and AMF and authorised and subject to limited regulation by the Financial Services Authority. Details of the extent of our<br />
authorisation and regulation by the Financial Services Authority are available from us on request.<br />
This report has been approved for publication in France by <strong>BNP</strong> Paribas, a credit institution licensed as an investment services provider by the<br />
CECEI and the AMF, whose head office is 16, Boulevard des Italiens 75009 Paris, France.<br />
This report is being distributed in Germany either by <strong>BNP</strong> Paribas London Branch or by <strong>BNP</strong> Paribas Niederlassung Frankfurt am Main,<br />
regulated by the Bundesanstalt für Finanzdienstleistungsaufsicht (BaFin).<br />
United States: This report is being distributed to US persons by <strong>BNP</strong> Paribas Securities Corp., or by a subsidiary or affiliate of <strong>BNP</strong> Paribas<br />
that is not registered as a US broker-dealer to US major institutional investors only. <strong>BNP</strong> Paribas Securities Corp., a subsidiary of <strong>BNP</strong> Paribas,<br />
is a broker-dealer registered with the Securities and Exchange Commission and a member of the National Association of Securities Dealers, the<br />
New York Stock Exchange and other principal exchanges. <strong>BNP</strong> Paribas Securities Corp. accepts responsibility for the content of a report<br />
prepared by another non-US affiliate only when distributed to US persons by <strong>BNP</strong> Paribas Securities Corp.<br />
Japan: This report is being distributed to Japanese based firms by <strong>BNP</strong> Paribas Securities (Japan) Limited, Tokyo Branch, or by a subsidiary or<br />
affiliate of <strong>BNP</strong> Paribas not registered as a financial instruments firm in Japan, to certain financial institutions defined by article 17-3, item 1 of<br />
the Financial Instruments and Exchange Law Enforcement Order. <strong>BNP</strong> Paribas Securities (Japan) Limited, Tokyo Branch, a subsidiary of <strong>BNP</strong><br />
Paribas, is a financial instruments firm registered according to the Financial Instruments and Exchange Law of Japan and a member of the<br />
Japan Securities Dealers Association. <strong>BNP</strong> Paribas Securities (Japan) Limited, Tokyo Branch accepts responsibility for the content of a report<br />
prepared by another non-Japan affiliate only when distributed to Japanese based firms by <strong>BNP</strong> Paribas Securities (Japan) Limited, Tokyo<br />
Branch. Some of the foreign securities stated on this report are not disclosed according to the Financial Instruments and Exchange Law of<br />
Japan.<br />
Hong Kong: This report is being distributed in Hong Kong by <strong>BNP</strong> Paribas Hong Kong Branch, a branch of <strong>BNP</strong> Paribas whose head office is in<br />
Paris, France. <strong>BNP</strong> Paribas Hong Kong Branch is regulated as a Registered Institution by Hong Kong Monetary Authority for the conduct of<br />
Advising on Securities [Regulated Activity Type 4] under the Securities and Futures Ordinance.<br />
© <strong>BNP</strong> Paribas (2010). All rights reserved.


