

MARKET MOVER - BNP PARIBAS - Investment Services India
MARKET MOVER - BNP PARIBAS - Investment Services India
MARKET MOVER - BNP PARIBAS - Investment Services India

Create successful ePaper yourself
Turn your PDF publications into a flip-book with our unique Google optimized e-Paper software.
Market Economics | Interest Rate Strategy | Forex Strategy 20 September 2012<br />
Market Mover<br />
Market Outlook 2-3<br />
Fundamentals 4-17<br />
• Eurozone Inflation: Introducing the 4-6<br />
CLIIP<br />
• Ireland: What to Expect When You Are 7-8<br />
Expecting<br />
• Spain: Inching Closer to a Request for 9<br />
Aid<br />
• France: Ratification and the<br />
10<br />
Ramifications<br />
• UK Inflation: No Pressure 11-12<br />
• US Housing: New Channels for Policy 13-14<br />
• Japan: The Eastern Fiscal Cliff 15-17<br />
Interest Rate Strategy 18-36<br />
• US: A Short Respite, That's All 18-20<br />
• MBS: Shorter Empirical Durations 21<br />
Under QE<br />
• Too Steep, Too Fast? The Case of the 22-23<br />
1y Forwards<br />
• QE Impacts on Spread Sector Relative 24-26<br />
Value<br />
• EUR: Liquidity Spread Compression at 27<br />
an End<br />
• EMU Debt Monitor: Trade ideas 28-29<br />
• JGBs: Increase in Issuance<br />
30-31<br />
Unavoidable<br />
• Global Inflation Watch 32-35<br />
• Trade Reviews 36<br />
FX Strategy 37-40<br />
• CAD: A Leader in the Commodity Bloc 37-38<br />
• Adding USD Shorts: Ease into Long 39-40<br />
GBPUSD<br />
Commodity Markets Strategy 41<br />
• Commodity Market Outlook 41<br />
Forecasts & Calendars 42-58<br />
• One-Week Economic Calendar 42-44<br />
• Key Data Preview 45-53<br />
• Four-Week Calendar 54<br />
• Treasury & SAS Issuance 55-56<br />
• Central Bank Watch 57<br />
• Economic & Interest Rate Forecasts 58<br />
• FX Forecasts 59<br />
Contacts 60<br />
www.GlobalMarkets.bnpparibas.com<br />
We’d like to inform readers that this is the final edition of<br />
Market Mover. Both it and Local Markets Mover will be<br />
replaced with new, more focused publications from next week.<br />
Macro Matters will cover global market economics, Global<br />
Rates Plus will present our strategy for the major rates<br />
markets and Latam Sniper and CEEMEA Sniper will collate<br />
our trade ideas for the Latin American and CEEMEA rates,<br />
credit and FX markets. FX Weekly will present our global<br />
foreign-exchange views and trade ideas.<br />
• As far as monetary policy in the advanced economies is<br />
concerned, the die has largely been cast for now. The<br />
major central banks are embarking on a new round of<br />
‘easing’, albeit in various guises.<br />
• With these policy measures in train, attention will settle<br />
more on the underlying macroeconomics of these major<br />
economies in the coming months.<br />
• Our latest global forecasts revise down growth, albeit not<br />
everywhere. US growth has been edged up; our eurozone<br />
forecast has been revised down, as has China.<br />
• For now, we would go with the Treasury bull-flattening<br />
move, overweighting the 10y sector (vs. 5s and the back<br />
end), as it tends to outperform on an RV basis, even if<br />
10s30s flatten.<br />
• Longer term, open-ended QE from the US and the ECB’s<br />
bond buying should help support risk assets, such as<br />
equities, so we expect the US and core eurozone curves<br />
to steepen heading into 2013.<br />
• Market sentiment and positioning has dominated FX<br />
markets since the FOMC. We expect the Fed’s<br />
commitment to ease policy to support the commodity<br />
currencies and weigh on the USD.<br />
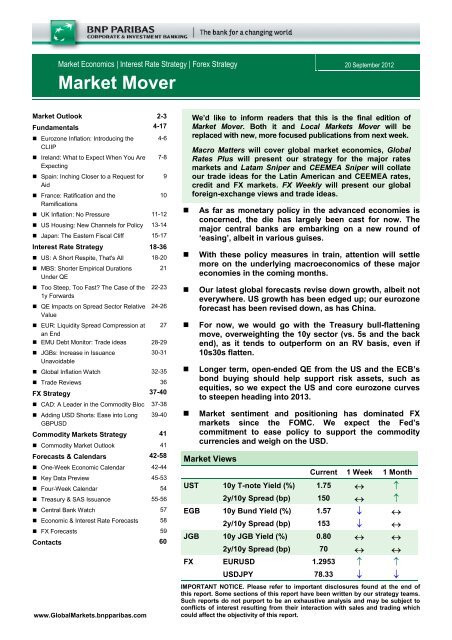
Market Views<br />
Current 1 Week 1 Month<br />
UST 10y T-note Yield (%) 1.75 ↔ ↑<br />
2y/10y Spread (bp) 150 ↔ ↑<br />
EGB 10y Bund Yield (%) 1.57 ↓ ↔<br />
2y/10y Spread (bp) 153 ↓ ↔<br />
JGB 10y JGB Yield (%) 0.80 ↔ ↔<br />
2y/10y Spread (bp) 70 ↔ ↔<br />
FX EURUSD 1.2953 ↑ ↑<br />
USDJPY 78.33 ↓ ↓<br />
IMPORTANT NOTICE. Please refer to important disclosures found at the end of<br />
this report. Some sections of this report have been written by our strategy teams.<br />
Such reports do not purport to be an exhaustive analysis and may be subject to<br />
conflicts of interest resulting from their interaction with sales and trading which<br />
could affect the objectivity of this report.
Market Outlook<br />
The die has been cast in<br />
favour of global monetary<br />
easing<br />
As far as monetary policy in the advanced economies is concerned, the die<br />
has largely been cast for now. The major central banks are embarking on a<br />
new round of ‘easing’, albeit in various guises.<br />
In the US, the easing is coming from the Federal Reserve’s conditional<br />
commitment to expand its balance sheet until it sees a sustained<br />
improvement in labour-market conditions. Meanwhile, in the eurozone, the<br />
European Central Bank has made a somewhat different commitment with its<br />
OMT bond-buying programme. Still, it is a potentially unlimited one in terms<br />
of size and duration and involves the further expansion of its balance sheet.<br />
The veil of sterilisation behind which the bank is hiding cannot really obscure<br />
the fact that it is monetary easing. We expect the ECB to sprinkle a rate cut<br />
on top of its current policy mix in December.<br />
In Japan, the BoJ this week announced a further JPY 10trn expansion of its<br />
asset-purchase programme. Meanwhile, in the UK, the Bank of England is<br />
still putting into practice its July asset-purchase extension and we expect<br />
more from it in November.<br />
Table 4: Economic Forecasts (% y/y)<br />
Our latest forecasts revise<br />
up the US (a bit) …<br />
2010 2011 2012 2013 2014 2012<br />
Q2 Q3 Q4<br />
US<br />
GDP 2.4 1.8 2.2 2.1 2.7 2.3 2.3 1.7<br />
CPI 1.6 3.2 2.1 2.2 2.0 1.9 1.7 2.1<br />
Core CPI 1.0 1.7 2.1 1.9 2.2 2.3 2.0 2.0<br />
Eurozone<br />
GDP 2.0 1.5 -0.4 0.2 1.2 -0.5 -0.7 -0.5<br />
CPI 1.6 2.7 2.5 2.0 1.5 2.5 2.5 2.5<br />
Core CPI 1.0 1.4 1.5 1.6 1.6 1.6 1.6 1.5<br />
Japan<br />
GDP 4.5 -0.8 2.2 0.6 0.2 3.2 1.5 1.3<br />
CPI -0.7 -0.3 0.1 0.0 2.0 0.2 -0.4 0.1<br />
US-Like Core CPI -1.2 -0.9 -0.4 -0.1 2.1 -0.5 -0.5 0.0<br />
China<br />
GDP 10.4 9.2 7.4 8.0 7.5 7.6 7.1 7.3<br />
CPI 3.3 5.4 3.0 3.6 3.5 2.9 2.1 3.2<br />
Source: <strong>BNP</strong> Paribas<br />
With these policy measures in train, attention will settle more on the<br />
underlying macroeconomics of these major economies in the coming<br />
months. Our view on how they will fare is fleshed out in detail in our new<br />
Global Economic Outlook. The clue is in the title: Soft-boiled recovery.<br />
To summarise, in the US, we think the outlook has improved a little of late,<br />
largely as a result of the Fed’s action. But growth is expected to be close to<br />
trend over the next few years, which doesn’t give much scope for a<br />
significant improvement in the labour market. So, we think the Fed will keep<br />
on expanding its balance sheet, lifting it by as much as USD 1.5trn. The key<br />
risk to the economy is probably the fiscal cliff, which we expect to be<br />
resolved in a sensible and relatively timely fashion.<br />
… and revise down the<br />
eurozone<br />
In the eurozone, things are, of course, more complex, with more moving<br />
parts. Overall, the growth outlook in the eurozone is worse than at the time<br />
of our July forecast. We now only expect growth of 0.2% in 2013. Surveys<br />
suggest that the contraction in output should bottom this year. But as the<br />
PMI surveys this week, especially the French numbers, highlight, there<br />
remain risks that the downturn could become more protracted.<br />
David Tinsley 20 September 2012<br />
Market Mover<br />
2<br />
www.GlobalMarkets.bnpparibas.com
Spain set to present its<br />
new budget next week<br />
Risks to the eurozone from the periphery also prevail. The Spanish<br />
government is scheduled to present its new budget next week, which should<br />
be a stepping stone on the road to an agreement on financial aid, paving the<br />
way for OMT/ESM bond purchases. But macro and political slippage is a risk<br />
here, as it is throughout the periphery.<br />
In the UK, the recent data outturns have been looking stronger and we<br />
expect a very solid growth rate in Q3. But the bar has been set high when it<br />
comes to dissuading the Monetary Policy Committee (MPC) from expanding<br />
QE again, and the Committee looks set to keep the faith that underlying<br />
inflationary pressures are soft, even if the headline rate is bubbling up.<br />
China will be stronger in<br />
2013, but there are risks<br />
that the downturn has a<br />
larger structural element<br />
The outlook for inflation<br />
hasn’t changed much<br />
For now, go with the bullflattening<br />
move in<br />
Treasuries<br />
It would be remiss in any discussion of the global outlook not to mention<br />
China. Growth here looks softer than expected and we do not expect it to<br />
bottom until later this year. We expect growth to come back up to 8% in<br />
2013, but there are risks that embedded in the slowdown is a more structural<br />
story depicting overcapacity and competitiveness.<br />
All told, then, the global economy is weaker than our July forecasts. For<br />
inflation, though, the outlook hasn’t changed much. Weaker growth in some<br />
parts of the world is offsetting supply shocks, leaving headline inflation rates<br />
little different.<br />
Near term, the reversal in the Treasury markets in the past few sessions has<br />
caused many to question whether the sell-off and steepening that happened<br />
on the back of the Fed’s QE announcement have already run their course.<br />
We think this is only a short-lived retracement, driven in part by transient<br />
factors, such as profit taking, the buyback schedule and Treasury supply in<br />
the 2y, 5y and 7y sectors next week. For these reasons, for now, we would<br />
go with the bull-flattening move, overweighting the 10y sector (vs. 5s and the<br />
back end), as it tends to outperform on an RV basis, even if 10s30s flatten.<br />
In the core eurozone markets, fundamental conditions favour a further<br />
limited rally near term. We still see room for lower yields and flatter curves.<br />
We are, therefore, maintaining our recommendation of being long Bunds in<br />
duration terms. As far as liquidity spreads are concerned, they look very tight<br />
at the moment. Core markets, in particular, now look cheap in ASW terms.<br />
Longer-term monetary<br />
loosening should support<br />
risk assets and curve<br />
steepening<br />
Sell the USD into the rally;<br />
we expect the dollar to<br />
decline<br />
Bye-bye, Market Mover<br />
Longer term, open-ended QE from the US and the ECB’s bond buying<br />
should help support risk assets, such as equities, so we expect the curve to<br />
steepen heading into 2013.<br />
In the FX market, investors have failed to leap on the Fed’s aggressive<br />
announcement as a catalyst to establish new short USD positions. To the<br />
contrary, investors have been trimming their risk-on positions and buying the<br />
greenback. Our FX positioning analysis suggests that investors are currently<br />
holding relatively light positions, suggesting the recent sell-off may be short<br />
lived. We expect the USD to weaken against the commodity currencies in<br />
the months ahead and favour long NZDUSD positions. In Europe, we expect<br />
improving sentiment to continue to support EURCHF. Meanwhile, we expect<br />
GBPUSD to rally substantially this year, but are waiting for a better<br />
opportunity to establish a long position.<br />
Our very first issue of Market Mover noted that the rebound from the Asian<br />
crisis owed “a good deal to easy monetary policy in the US and Europe”. We<br />
can only hope that our new, more focused global and regional publications<br />
from next week will be able to make a similar claim before too long.<br />
David Tinsley 20 September 2012<br />
Market Mover<br />
3<br />
www.GlobalMarkets.bnpparibas.com
Eurozone Inflation: Introducing the CLIIP<br />
• Consumer price inflation is determined by a<br />
mix of demand-pull and cost-push factors, as well<br />
as broader financial and monetary conditions.<br />
Chart 1: Eurozone Core and Headline Inflation<br />
• We have created a Composite Leading<br />
Indicator of Inflationary Pressure (CLIIP) for the<br />
eurozone, designed to provide an indication of<br />
the outlook for core inflation in the months ahead.<br />
• Our indicator suggests that disinflationary<br />
pressure will dominate in the coming months.<br />
A composite leading indicator can be a useful tool<br />
when gauging the likely future direction of an<br />
economic variable of interest. We have created a<br />
Composite Leading Indicator of Inflationary Pressure<br />
(CLIIP), which standardises and combines a<br />
selection of the numerous influences on inflation into<br />
a single data series, providing a summary measure<br />
of underlying inflationary pressure.<br />
Choosing a reference indicator<br />
Any leading indicator needs a reference indicator – a<br />
series the leading indicator aims to predict and<br />
against which its performance can be assessed.<br />
Measures of underlying consumer prices, such as<br />
the core HICP, attempt to strip out the most common<br />
temporary disturbances to prices by excluding<br />
consumer energy and food prices from the index. For<br />
this reason, HICP core inflation tends to be more<br />
stable than the headline measure and allows for<br />
examination of the underlying trends in pricing<br />
behaviour. For this reason, we have chosen to make<br />
it our reference indicator.<br />
Chart 1 shows the behaviour of core and headline<br />
inflation over the past 15 years and demonstrates<br />
core’s relative stability. By the core HICP measure,<br />
underlying inflation in the eurozone has averaged<br />
1.5% y/y since 1997.<br />
Our composite leading indicator<br />
We have drawn on OECD methodology in creating<br />
our indicator 1 . The 10 time series we have selected<br />
have predictive power for consumer price inflation<br />
and can be categorised as indicators of cost-push<br />
pressure on prices, of demand-pull price pressure<br />
and indicators of financial conditions. Unless<br />
otherwise stated, all relate to the eurozone.<br />
Source: Reuters EcoWin Pro<br />
The cost-push components<br />
The components we include to capture supply-side<br />
price pressures include both surveys and hard data.<br />
We include the manufacturers’ selling-price survey<br />
conducted as part of the European Commission’s<br />
monthly business and consumer survey and the<br />
Markit input price PMI as two forward-looking<br />
measures of pipeline price pressures. Unit labour<br />
costs are included as a measure of domestic input<br />
price pressure, labour being an input to production.<br />
The PPI is included to capture factory-gate prices. A<br />
weaker euro increases the cost of imports to euro<br />
countries, so we include the ECB’s EER-40 real<br />
effective exchange rate (inverted) to capture<br />
imported inflation.<br />
Demand-pull components<br />
To measure the extent to which consumer and<br />
company demand are exerting upward pressure on<br />
prices, we include eurozone industrial production as<br />
a proxy for economic activity. To capture the strength<br />
of global demand, we include world trade volumes.<br />
To gauge the strength of domestic consumer<br />
demand, we use unemployment (inverted) and the<br />
DG ECFIN consumer financial conditions survey,<br />
which indicates consumers’ optimism about their<br />
income prospects.<br />
Financial component<br />
We include the <strong>BNP</strong>P Financial and Monetary<br />
Conditions Indicator (FMCI) as a broad measure of<br />
the tightness of financial conditions in the eurozone.<br />
The FMCI is inverted for inclusion in the CLIIP, as<br />
tighter monetary conditions are inflation negative.<br />
1 http://www.oecd.org/dataoecd/37/42/42495745.pdf<br />
Catherine Colebrook 20 September 2012<br />
Market Mover<br />
4<br />
www.GlobalMarkets.bnpparibas.com
The methodology<br />
All of the above indicators can be expected to impact<br />
consumer price inflation with varying lags. For<br />
example, monetary conditions can be expected to<br />
affect prices with a lag of 1-2 years, according to<br />
ECB analysis 2 . Shocks to producer prices tend to be<br />
passed through more quickly, within 6-8 months.<br />
Furthermore, these relationships are not static over<br />
time; in general, the lags look to have shortened<br />
since the early 2000s.<br />
3.0<br />
2.5<br />
2.0<br />
1.5<br />
1.0<br />
Chart 2: Core HICP and the CLIIP<br />
Core HICP (%y/y)<br />
We chose the optimal lag to apply to each of the<br />
variables according to our view of the current speed<br />
of transmission, using correlation coefficients as a<br />
guide.<br />
To prepare the series for aggregation, we remove<br />
any seasonality or trends, invert where appropriate,<br />
smooth the series using a Hodrick-Prescott filter, and<br />
normalise them (ie. such that they all have mean 0<br />
and standard deviation 1). The series are all given<br />
equal weight in the aggregation. The final stage is to<br />
transform the index such that it has a mean and<br />
standard deviation equal to core inflation, so that the<br />
index corresponds to an implied level of annual core<br />
inflation. The final CLIIP index is plotted against core<br />
inflation in Chart 2.<br />
Over the sample from January 2003 to present, the<br />
CLIIP has a correlation coefficient with core inflation of<br />
0.67. Between January 2009 and May 2012, the<br />
coefficient rises to 0.84. The components with the<br />
quickest transmission to core inflation are the consumer<br />
financial conditions survey and unemployment, both of<br />
which are incorporated into the index with a lag of six<br />
months. The index thus gives us a leading indicator for<br />
inflationary pressure that extends six months into the<br />
future.<br />
What does it tell us about inflation?<br />
Table 1 lists the components of the leading indicator<br />
for core inflation, their level at the last available CLIIP<br />
data point (which corresponds to expected inflation in<br />
January 2013) and whether each is positive,<br />
negative, or neutral for inflation on that horizon. The<br />
components are listed in normalised form, meaning<br />
that a value above zero implies a positive impact on<br />
core inflation; a negative number means a negative<br />
impact.<br />
As we might expect given that the eurozone<br />
economy is currently operating below potential,<br />
components indicative of economic slack and a<br />
subdued labour market are all inflation-negative: the<br />
level of unemployment, consumer expectations, and<br />
unit labour costs are all at levels consistent with<br />
disinflationary pressure.<br />
2 http://www.ecb.europa.eu/pub/pdf/other/mb201005en_pp85-98en.pdf<br />
0.5<br />
0.0<br />
00 01 02 03 04 05 06 07 08 09 10 11 12 13<br />
Source: Reuters EcoWin Pro<br />
Chart 3: Unemployment and IP CLIIP Components<br />
3<br />
2<br />
1<br />
0<br />
-1<br />
-2<br />
-3<br />
-4<br />
Unemployment (6-m lag)<br />
-0.4<br />
99 00 01 02 03 04 05 06 07 08 09 10 11 12 13<br />
Source: Reuters EcoWin Pro, <strong>BNP</strong> Paribas<br />
Core HICP (% y/y, RHS)<br />
Financial and monetary conditions are also inflationnegative;<br />
given that the monetary policy transmission<br />
mechanism is still impaired, several years after the<br />
credit crunch, this is not surprising either.<br />
Recent large falls in the euro can be expected to<br />
push up import prices and, therefore, domestic<br />
inflation in the eurozone in the coming months,<br />
although at 0.2 – less than one standard deviation<br />
away from its the long-run average – the normalised<br />
level of the REER component suggests the effect will<br />
3 All component data are normalised, while the CLIIP itself corresponds to a<br />
level of annual core inflation<br />
CLIIP<br />
Industrial<br />
Production (12-m lag)<br />
Table 1: CLIIP Component Breakdown<br />
Component Jan 2013<br />
Value 3<br />
2.6<br />
2.1<br />
1.6<br />
1.1<br />
0.6<br />
0.1<br />
Implication for<br />
Inflation<br />
Consumer financial conditions survey -1.8 Negative<br />
Unemployment rate -1.7 Negative<br />
<strong>BNP</strong>P FMCI -0.8 Negative<br />
Unit labour costs -0.8 Negative<br />
PMI input prices -0.3 Negative<br />
Real effective exchange rate 0.2 Positive<br />
Manufacturers’ selling price expectations 0.3 Positive<br />
Eurozone industrial production 0.4 Positive<br />
World trade 0.5 Positive<br />
Producer price index 0.6 Positive<br />
CLIIP (normalised value) -1.05 Negative<br />
Source: <strong>BNP</strong> Paribas<br />
Catherine Colebrook 20 September 2012<br />
Market Mover<br />
5<br />
www.GlobalMarkets.bnpparibas.com
e moderate in comparison with other component<br />
effects.<br />
The index suggests that the key sources of price<br />
pressure over the next 6 months will be the external<br />
economic environment and upstream prices.<br />
Producer price inflation has been falling since mid-<br />
2011, but the effects of previous rapid price<br />
increases are still feeding through to prices<br />
downstream. Although now slowing, global growth<br />
was robust last year, and this is also still feeding<br />
through to prices.<br />
At first glance, the fact that the eurozone industrial<br />
production component is inflation positive seems<br />
counter-intuitive, considering the levels of other<br />
output gap-related components. Its positive influence<br />
on inflation stems from two related factors: first, it<br />
affects inflation with a much longer lag than other<br />
drivers, and second, industrial production had initially<br />
picked up post-crisis, as global growth accelerated in<br />
late 2010 and early 2011. Although industrial<br />
production growth has slowed subsequently, this<br />
period of above-trend production is still feeding<br />
through to inflation (Chart 3).<br />
Putting all of this together, the CLIIP suggests that,<br />
overall, underlying inflationary pressure is set to<br />
moderate. The normalised index has a value of -1.05<br />
in January 2013, which is consistent with core<br />
inflation of 1.1% y/y (versus the current level of<br />
1.5% y/y). The CLIIP suggests that inflationary<br />
pressure peaked at the start of 2012, and is now on a<br />
declining trend.<br />
Of course, idiosyncratic factors, such as the<br />
methodological change applied to seasonal items<br />
from last year, or adjustments to national VAT rates<br />
and structure, mean that core inflation does not<br />
always move according to underlying price pressure.<br />
But in terms of the underlying fundamentals,<br />
inflationary pressure in the eurozone is moderating.<br />
Conclusion<br />
Our composite leading indicator provides a quickreference<br />
guide to the level of inflationary pressure<br />
building in an economy. Inflation in the eurozone is<br />
currently above target, but our indicator suggests<br />
that, on balance, the macroeconomic conditions that<br />
have provided support to prices of late have already<br />
begun to ease and that we should see more<br />
evidence of this in the core HICP index in the coming<br />
months.<br />
Catherine Colebrook 20 September 2012<br />
Market Mover<br />
6<br />
www.GlobalMarkets.bnpparibas.com
Ireland: What to Expect When You Are Expecting<br />
• June’s eurozone summit raised expectations<br />
of a refinancing of the Irish banking bailout.<br />
• Ireland’s ‘prize’ from such a deal is potentially<br />
high, with the gross cost of the bailout to date at<br />
around 40% of GDP.<br />
• Any deal will not necessarily lower its debt-to-<br />
GDP ratio from its 120% peak, but it would alleviate<br />
Ireland’s funding needs significantly over the next<br />
few years.<br />
• It is ultimately in the interest of most of the<br />
parties in the negotiations to produce a deal that<br />
will move Ireland towards sustainable finances.<br />
• It could also serve as a carrot for other<br />
programme countries, alongside the usual sticks.<br />
Statement of intent<br />
The statement following the eurozone summit at the<br />
end of June was widely considered to be very<br />
favourable to Ireland. Specifically, the end of the first<br />
paragraph contained a commitment to “examine the<br />
situation of the Irish financial sector with the view of<br />
further improving the sustainability of the wellperforming<br />
adjustment programme.” That was<br />
interpreted as meaning that once a single supervisory<br />
framework for eurozone banks was up and running, the<br />
Irish could hope for some of the huge cost of their bank<br />
bailout to be refinanced ex post through the ESM.<br />
Big envelopes<br />
The potential ‘prize’ from any re-engineering of the<br />
Irish bailout is considerable. The total gross cost to the<br />
Irish state of the banking-sector bailout is put at<br />
EUR 62.8bn. That is equivalent to a staggering 40% of<br />
the island’s GDP. At this size, the IMF considers the<br />
bailout to be the second-costliest banking crisis in an<br />
advanced economy since the Great Depression, at<br />
least, only pipped to the post – just – by Iceland.<br />
Table 1 sets out the key elements of the bailout to<br />
date. Around half of the increase in total funds injected<br />
into the Irish banks is due to the promissory notes<br />
injected into Anglo Irish, which is now part of the Irish<br />
Bank Resolution Corporation Limited – in effect, the<br />
legacy wind-down bank for Anglo and Irish<br />
Nationwide. The other half of the bailout injections are<br />
from government and national pension-fund (NPRF)<br />
equity and capital injections.<br />
In terms of the possible scope of any agreement<br />
between the Irish government and the eurozone/ECB<br />
to restructure the broad bank bailout, it makes sense<br />
Table 1: Gross Costs of Ireland’s Bank Bailout<br />
EUR bn Body Date Total<br />
Government preference shares NPRF 2009 7<br />
Promissory notes/special<br />
investment shares Exchequer 2010 31.6<br />
Ordinary share capital Exchequer 2009 4<br />
Ordinary share capital NPRF 2010 3.7<br />
Total pre-PCAR 2011 46.3<br />
Following PCAR 2011<br />
Capital Exchequer 2011 6.5<br />
Capital NPRF 2011 10<br />
Post-PCAR 2011 16.5<br />
Total costs 62.8<br />
Source: NTMA<br />
to think about the promissory notes as distinct from<br />
the other injections.<br />
As a reminder, the EUR 31bn of promissory notes<br />
injected into IBRC are just that, a promise from the<br />
Irish sovereign to pay the bank cash each year. The<br />
repayment schedule for these notes stretches out over<br />
the next 20 years. For the next decade, the Irish<br />
government is on the hook for EUR 3.1bn a year.<br />
The full value of the promissory notes has already been<br />
booked and is one of the major causes of the increase<br />
in Ireland’s debt-to-GDP ratio from 64.9 % in 2009 to<br />
92.2% in 2010. But in a cashflow sense, the funds for<br />
the notes will be raised in the year they fall due. And<br />
they will be a significant cash call on the sovereign<br />
each year, with EUR 3.1bn equivalent to 1.9% of the<br />
country’s GDP. Or, to put it another way, with an IMFforecast<br />
Exchequer cash deficit for 2013 of EUR<br />
14.5bn, funding the notes will be very costly indeed.<br />
The promissory note issue is intimately bound up with<br />
the provision of emergency liquidity assistance (ELA)<br />
owed to the Central Bank of Ireland. Emergency<br />
liquidity assistance is a form of monetary financing<br />
that the ECB requires to be paid off post haste. The<br />
idea is that as the promissory notes pay up, so they<br />
will be used to pay down the EUR 42.3bn in ELA<br />
funding to the IBRC. The key role of the ECB in<br />
discussions on the promissory notes can, therefore,<br />
be appreciated, as any re-jig of the notes impinges on<br />
commitments to wind down the ELA.<br />
In the past, the ECB has shown some reluctance to<br />
re-open discussions on the promissory notes, though<br />
it appears this reticence has softened somewhat of<br />
late. ECB executive board member Joerg Asmussen<br />
said at a press conference last week that the bank<br />
was in “intense discussions” on the Irish programme.<br />
That shows, at least, that the ECB is engaging on the<br />
issue, which is a change from its previous stance.<br />
David Tinsley 20 September 2012<br />
Market Mover 7<br />
www.GlobalMarkets.bnpparibas.com
There are a number of possibilities with regard to a<br />
refinancing of the promissory notes. Following the<br />
June summit, it appeared that a loan from the ESM<br />
could be extended to the IBRC to replace the notes<br />
and that this loan could, in turn, be used to pay down<br />
the ELA. However, reports this week suggest the Irish<br />
government is now looking at refinancing the notes via<br />
a long-term, possibly 40-year, Irish bond. This would<br />
then be pledged as collateral with the ECB.<br />
The advantage of such an approach is that it could be<br />
easier to clear through the hurdles of eurozone<br />
decision making. For Ireland, the sovereign would still<br />
be on the hook for the full value of the notes, meaning<br />
the only reduction in the debt-to-GDP ratio would<br />
come from savings on servicing costs. But the<br />
repayment on the bond would be kicked a long way<br />
down the road and the financing requirements over<br />
the next few years would be alleviated significantly.<br />
Until a single supervisory framework is agreed within<br />
the eurozone, the option for the Irish of mutualising the<br />
debt is not on the table, so any sort of deal – ESM loan<br />
or Irish bonds – will keep the debt on the Irish balance<br />
sheet. And it is not clear that agreement will be reached<br />
on supervision as fast as the European Commission<br />
would like. In addition, the next payment on the<br />
promissory notes is not due until the end of March<br />
2013. So, although the original ambition was to reach<br />
an agreement on a refinancing of the Irish banking<br />
sector by the time of the late October EU summit, there<br />
may be some temptation for both Ireland and the<br />
eurozone/ECB to let that deadline slip a little.<br />
Equity injections<br />
The position on equity injections is not particularly any<br />
clearer. EUR 28.2bn has been injected into the other<br />
(non-IBRC) banks since 2009, split between the<br />
Exchequer and the national pension fund. At face<br />
value, a deal in which the ESM takes over these stakes<br />
and reimburses Ireland has the potential to knock 18<br />
percentage points off of the debt-to-GDP ratio.<br />
But the problem here is that even when the ESM is in<br />
a position to take over the liability for these<br />
investments, it is not clear at what value it would do<br />
so. This is because the value of the government’s<br />
stake in these banks has fallen sharply. The national<br />
pension fund’s investments in AIB and Bank of<br />
Ireland, for example, were valued at EUR 8.1bn at<br />
the end of June 2012, compared with the<br />
EUR 20.7bn it invested.<br />
post refinancing too. But it may be difficult for the<br />
Irish to pass on the full extent of the loss to the ESM<br />
retrospectively, as presumably this would be a pretty<br />
tough sell for eurozone governments to their<br />
respective electorates, even if the absolute numbers<br />
involved were not that large.<br />
Implications for sustainability<br />
In its recent Article IV, the IMF usefully considers<br />
what a deal to refinance the promissory notes plus<br />
an equity injection from the ESM would do for debt<br />
sustainability. The conclusion is that it could lower<br />
the debt-to-GDP ratio in 2013 to around 105% of<br />
GDP from a baseline 119.3%. And the debt-to-GDP<br />
ratio would be below 80% by 2020.<br />
That would be an impressive achievement, but the<br />
IMF analysis is predicated on the ESM paying the full<br />
value of the equity injection into the banks. On the<br />
assumption that the ESM paid something closer to<br />
current valuations, the peak debt-to-GDP ratio might<br />
instead fall to 112% of GDP, which might look like a<br />
disappointment on announcement.<br />
A carrot to add to the sticks?<br />
On current official troika forecasts, Ireland will be<br />
running a primary surplus in 2014 of 0.9%,<br />
increasing to a whopping 7.0% in 2017. And with the<br />
benefits of a deal on the promissory notes coming<br />
through along the debt trajectory via savings on debtservicing<br />
costs, a deal that looks a little disappointing<br />
in terms of headline numbers could still make a<br />
substantial contribution to moving the country<br />
towards debt sustainability.<br />
But even under a deal on the bank bailout, especially<br />
a ‘disappointing’ one in headline terms, Ireland will<br />
continue to remain more open than it might like to<br />
disappointments on growth or fiscal slippages in<br />
future years. There, in effect, lies the rub. With<br />
Ireland having been feted so strongly in its delivery of<br />
programme targets, it must ultimately be very much<br />
in the interest of the eurozone partners and the ECB<br />
to come up with a deal that robustly cements the<br />
success of the programme, albeit without providing<br />
incentives for back-sliding. A successful Ireland<br />
would be a useful carrot to add to the numerous<br />
sticks that are wielded at programme countries. So<br />
while a final deal will doubtless be complex, we<br />
would expect it to make a substantial contribution to<br />
reducing Ireland’s financing needs medium term.<br />
Now, it could be argued that were the ESM in<br />
existence back at the time of these re-caps it would<br />
be carrying the loss and so should do so in an ex-<br />
David Tinsley 20 September 2012<br />
Market Mover 8<br />
www.GlobalMarkets.bnpparibas.com
Spain: Inching Closer to a Request for Aid<br />
• Spain is inching closer to asking for financial<br />
aid, but it is still only inching.<br />
• In the latter half of next week, Spain will have<br />
an action-packed agenda. It will present its 2013<br />
budget, announce its planned structural reforms<br />
and publish the result of the bottom-up bank audit.<br />
• Any subsequent bailout could be marketed as<br />
a reward for reform and potentially remove part of<br />
the stigma attached to a bailout.<br />
• The country’s regional elections on 21 October<br />
could be the last obstacle to a request.<br />
• Any unused funds from the bank bailout could<br />
be used to lower the final cost of a sovereign<br />
bailout, something that should please Germany.<br />
The timetable seems clearer<br />
After last weekend’s Ecofin meeting and confirmation<br />
of the publication date of the bottom-up review of the<br />
Spanish banks, the timeline of and next steps<br />
towards a Spanish aid request seem to be clearer.<br />
After the Eurogroup meeting, Spanish Economic<br />
Minister Luis de Guindos said Spain would present<br />
its 2013 budget on 27 September. The day after, the<br />
Spanish government will present its planned<br />
structural reforms and, more importantly, the results<br />
of the bottom-up audit of the Spanish banks.<br />
The next Ecofin meeting on 8 October will assess the<br />
reforms and the budget, as well as the details of the<br />
bank reforms to be undertaken as soon the first<br />
tranches of the bank bailout funds are released.<br />
Comments over the weekend suggest that the<br />
reforms and budget have been drafted with some<br />
knowledge or help from the IMF and the European<br />
Commission. Indeed, IMF chief Christine Lagarde<br />
confirmed that an IMF team has been in Madrid<br />
since early last week, helping on the 2013 budget.<br />
First the reforms, then the support<br />
So, as things currently stand, Spain seems to be<br />
already negotiating the conditions under which it<br />
might receive financial aid. Spain will only request<br />
help after it has put in place the reforms required by<br />
the Troika, as it would be easier to sell domestically.<br />
ESM and ECB support will be seen more as a<br />
reward for the government’s efforts and less as a<br />
punishment for fiscal laxity.<br />
The big question is the exact timing. As Spain will<br />
face its biggest liquidity squeeze at the end of<br />
October, when EUR 20bn of bonds mature, Spain<br />
still has some time to play. But it is not unlimited and<br />
there are several factors that could influence the<br />
timing of a request.<br />
France and Italy are among those countries with the<br />
bigger interest in Spain asking for aid before the EU<br />
summit on 18-19 October. Germany, in contrast,<br />
would prefer, for domestic reasons, to postpone any<br />
Spanish bailout, especially as Spain will first receive<br />
the initial tranches of its bank recapitalisation funds.<br />
And Spanish Prime Minister Mariano Rajoy seems<br />
more inclined to wait until after the 21 October<br />
regional elections in Galicia and the Basque country.<br />
The latter is not an issue, as his Partido Popular has<br />
little chance of winning there anyway. But Galicia is<br />
Mr Rajoy’s home region and according to the latest<br />
polls, the PP could lose its control. A request before<br />
that vote would be a bitter blow to the campaign and<br />
would be seen as a personal defeat for Mr Rajoy.<br />
Recent comments by members of his party suggest<br />
that Mr Rajoy may be increasingly isolated in his<br />
position, though. So, Spain could end up asking for<br />
support before the elections on 21 October, but after<br />
the Ecofin meeting on 8 October.<br />
Bank bailout funds to soften German resistance<br />
The EU has already set aside EUR 100bn for a<br />
programme to recapitalise the Spanish banks and,<br />
according to the latest reports, their capital needs<br />
may be just EUR 60bn, leaving EUR 40bn over.<br />
Media reports suggest that one possibility could be<br />
for Spain to transfer its unused bank bailout money<br />
to the government. This would please Germany, as it<br />
could be done by changing the MoU for the bank<br />
bailout and would not require parliamentary approval.<br />
However, beyond any possible legal objections, for<br />
ECB intervention to occur, a country either has to be<br />
under a “full programme” or have requested a<br />
precautionary one. So, even if Spain were to go<br />
down this route and the other European countries<br />
were to agree, a new MoU would have to be signed,<br />
with all of the conditions that go with it. And this<br />
might not be enough. Spain’s funding needs for the<br />
next 12 months are close to EUR 180bn. If an ESM<br />
programme were to fund only 50% of Spanish<br />
issuance, this would mean it would need a capacity<br />
of close to EUR 90bn, far more than the EUR 40bn<br />
that might be left over from the bank bailout.<br />
So, the most likely scenario, in our view, is that Spain<br />
will still have to request further financing, even if the<br />
unused bank-bailout funds can be transferred. And<br />
despite having some time left, we think Spain will<br />
request support in October.<br />
Ricardo Santos 20 September 2012<br />
Market Mover<br />
9<br />
www.GlobalMarkets.bnpparibas.com
France: Ratification and the Ramifications<br />
• France is set to ratify the EU fiscal compact in<br />
October and the debt-brake rule after that.<br />
• The ECB’s OMT bond-buying plan is likely to<br />
be well received by French policymakers, though<br />
a possible downgrade of French sovereign debt<br />
by Moody's and a harsh budget will cause some<br />
unease among left-leaning politicians.<br />
• While ratification is not in doubt, President<br />
Hollande will need to solidify his majority ahead<br />
of votes on the 2013 budget and structural reform.<br />
French President François Hollande said right after<br />
the EU summit at the end of June that he was<br />
satisfied with the bloc’s pro-growth pact. He<br />
subsequently decided that he would present the bill<br />
to parliament for ratification together with the EU<br />
fiscal compact, EU banking-union legislation and a<br />
bill on an EU financial transaction tax. On the latter,<br />
Europe is still dragging its feet. The European<br />
Commission’s proposal on the first steps towards<br />
banking union, meanwhile, is far from final, so a vote<br />
here would be premature. However, on 2 October,<br />
parliament should start debating the EU fiscal<br />
compact signed in March and the pro-growth<br />
agreement reached in late June.<br />
Ratification process<br />
While Mr Hollande ran for election on a platform of<br />
renegotiating the fiscal compact, he clearly did not<br />
manage to do so. It had already been signed by his<br />
predecessor, Nicolas Sarkozy, so it could not be<br />
undone. Some of Mr Hollande’s supporters have<br />
indicated that they are reluctant to vote the compact<br />
into law in its current form. The Communists and<br />
supporters of the Left Front’s Jean-Luc Mélenchon<br />
are also likely to vote against it. The president is<br />
trying his best to secure an abstention (if not a<br />
favourable vote) from the Greens. And even a few<br />
Socialists have said they will not approve the pact.<br />
Legislation governing the EU debt-brake rule, which<br />
is required under the fiscal compact, is also due to be<br />
presented to parliament, possibly as soon as 8<br />
October. It requires a separate vote. The EU debtbrake<br />
rule, known in France as the ‘golden rule’, will<br />
not be added to the constitution, but voted into law by<br />
way of a special loi organique. The usual lag<br />
between such a bill being presented and a<br />
parliamentary vote is six weeks (though a fast-track<br />
option does exist). An absolute majority is required<br />
(rather than the usual relative, or simple, majority).<br />
The French Constitutional Court said in August that<br />
going down the loi organique route would be<br />
compliant with the compact and the French<br />
constitution, as Article 34 of the country’s basic law<br />
already states that "the multi-year framework for<br />
public accounts is aimed at balanced accounts." It<br />
says that this framework and the rules applicable to<br />
the annual budget may be set out in a supplementary<br />
loi organique.<br />
Approval is not an issue, as opposition conservative<br />
parliamentarians will vote en masse for ratification and<br />
the ‘golden rule’ for three reasons: (i) they have always<br />
been behind the pact, which they believe to be good for<br />
France, (ii) to underscore that Mr Hollande has done a<br />
U-turn on the issue and (iii) to up the pressure on the<br />
government in the hope that subsequent austerity<br />
measures will boost their chances of winning the 2014<br />
local and 2017 national elections.<br />
Good news and bad news<br />
Mr Hollande would prefer to see this treaty approved<br />
with a majority of his own. We believe he can<br />
achieve this. One thing that may help him convince<br />
his own ranks is the recent OMT announcement. He<br />
said before being elected that then President<br />
Sarkozy should have asked for more involvement by<br />
the ECB in searching for a solution to the euro crisis.<br />
Mr Hollande has not claimed to have played any role<br />
in the ECB’s new policy line. However, the bank’s<br />
change of heart can only help him backstage.<br />
When changing its outlook for Germany and the<br />
Netherlands on 23 July, Moody's said that "by the<br />
end of the third quarter, Moody's will also assess the<br />
implications of these developments [the rising risk of<br />
a Greek exit, the growing likelihood of collective<br />
support for other euro-area sovereigns and stalled<br />
economic growth] for Aaa-rated Austria and France,<br />
whose rating outlooks were moved to negative from<br />
stable in February." Since then, we have had nothing<br />
further. Back in February Moody's said France's debt<br />
metrics, were “among the weakest of France's Aaarated<br />
peers". So, the risk of a downgrade persists<br />
(S&P did just that last January), which may upset<br />
some left-leaning MPs just before they are asked to<br />
approve a framework for future austerity.<br />
Solidifying his majority in parliament<br />
President Hollande will have to submit to parliament<br />
a restrictive 2013 budget and some structural<br />
reforms to improve France’s competitiveness. This<br />
was not highlighted during his campaign. To get<br />
these approved, he needs to ensure that his majority<br />
is solid. The votes on the fiscal compact and the<br />
golden rule will be real tests in this regard.<br />
Dominique Barbet 20 September 2012<br />
Market Mover<br />
10<br />
www.GlobalMarkets.bnpparibas.com
UK Inflation: No Pressure<br />
• UK inflation ticked up in July, raising concerns<br />
that underlying pressures might be firming. The<br />
subsequent drop in August looks reassuring.<br />
• Headline inflation over the rest of 2012 will<br />
certainly be higher than the Bank of England<br />
forecast in its August Inflation Report. But most of<br />
the difference looks to be down to food and<br />
energy.<br />
• The MPC will look through that, giving it room<br />
to carry out more QE in November.<br />
• RPI inflation has specific methodological risks<br />
attached to it. A consultation has been announced<br />
that could see the average gap between RPI and<br />
CPI narrowed significantly.<br />
5.5<br />
5.0<br />
4.5<br />
4.0<br />
3.5<br />
3.0<br />
2.5<br />
2.0<br />
1.5<br />
1.0<br />
0.5<br />
Chart 1: UK Headline and core CPI (% y/y)<br />
CPI (% y/y)<br />
Core (% y/y)<br />
02 03 04 05 06 07 08 09 10 11 12<br />
• The timetable for changes next year is tight.<br />
But the ONS and the government appear keen.<br />
Inflation reared its ugly head in July<br />
Inflation reappeared on the radar of UK policymakers<br />
last month after a surprising rise in the CPI annual rate<br />
to 2.6% from 2.4% in June. That was against market<br />
expectations of a decline in annual inflation in July.<br />
One of the worrying things, potentially, about the rise<br />
in inflation in July was the fairly broad-based nature of<br />
the increase. Clothing prices, for example, showed a<br />
smaller fall than usual for the month and contributed<br />
0.05pp to the annual rate increase. And other notable<br />
increases came from recreation and culture. Within<br />
this category, games, toys and hobbies, newspapers<br />
and periodicals and package holidays were sizeable<br />
upward influences. Away from recreation and culture,<br />
restaurants and hotels, alcohol and tobacco and<br />
housing and household services also made small<br />
upward contributions.<br />
With the UK PMI surveys also surprising to the upside<br />
in August, there was a hint that we might be about to<br />
embark on one of the periodic episodes of inflation<br />
anxiety that result in monetary-policy expectations<br />
being revised in a more hawkish direction. For<br />
example, earlier this year high-side inflation releases<br />
in February and March, along with firmer surveys,<br />
resulted in an extension of QE being taken off the<br />
table at the May MPC meeting.<br />
But it went back in its shell in August, mostly<br />
This week’s August inflation release goes some way<br />
to assuaging concerns about underlying inflation. The<br />
annual rate of CPI inflation fell back to 2.5%, a 0.1pp<br />
Source: ONS, <strong>BNP</strong> Paribas<br />
reduction. On its own of course that still puts inflation<br />
above the level it was at two months ago.<br />
But additional reassurance can probably be gleaned<br />
from that fact that the fall in inflation was fairly broadly<br />
based. Clothing prices rose less this year than last,<br />
contributing 0.04pp to the fall in annual inflation.<br />
Meanwhile furniture and household goods prices<br />
contributed 0.08pp to the annual change and<br />
housing and household services also made a<br />
downward contribution, as a gas and electricity price<br />
rise in 2011 fell out of the calculation. On the upside,<br />
transport prices added upward pressure to the<br />
annual rate, as did recreation and cultural goods.<br />
Higher inflation largely due to energy and food<br />
This fairly widespread fall-off means the reason that<br />
the headline rate of inflation is higher than in June<br />
largely comes down to higher energy and food<br />
prices. The core rate of inflation actually fell in the<br />
August figures to 2.1%, just a shade above the Bank<br />
of England’s 2.0% target for the headline rate.<br />
There have been several developments of late that<br />
mean the headline rate of inflation will finish this year<br />
significantly higher than expected a few months ago.<br />
Most obviously, the price of a litre of petrol keeps<br />
rising. Indeed, petrol prices are now higher than they<br />
have been since early May, even though the sterling<br />
price of a barrel of crude is lower than it was then.<br />
Other recent upside developments include an<br />
announced rise in gas and electricity bills by one<br />
supplier from October and the expectation that food<br />
prices will firm in due course to reflect higher<br />
David Tinsley 20 September 2012<br />
Market Mover<br />
11<br />
www.GlobalMarkets.bnpparibas.com
commodity prices, though the rise in sterling offsets<br />
this effect to some extent.<br />
The MPC will still have room for more QE<br />
The bottom line is that the August BoE forecast for<br />
consumer price inflation of 2.2% in the fourth quarter<br />
of this year is looking a bit of a stretch. Our own<br />
forecast is for the rate in Q4 to average 2.5%.<br />
But because most of the reasons for the upside news<br />
appear to be supply shock-driven price rises in<br />
energy and food, rather than anything more broadly<br />
based, this gives licence to the Monetary Policy<br />
Committee to look through the firmer headline rate.<br />
Average earnings growth remains at or below 2%,<br />
according to the most recent data. And as unit labour<br />
cost growth has been pushed up by falling GDP<br />
alongside still rising employment, we would not expect<br />
that productivity squeeze to last much longer. Indeed,<br />
a big rise in GDP in Q3 should provide an opportunity<br />
for some correction here. So, the underlying position<br />
on domestically generated inflationary pressure from<br />
the labour market is fairly benign.<br />
This all means that on the current constellation of<br />
data, the MPC is still likely to see room for more<br />
quantitative easing at its November meeting, when<br />
the current tranche of buying is completed.<br />
A further downside risk to RPI<br />
Alongside constrained consumer price pressures,<br />
there are further downward risks to the retail price<br />
index (RPI). This is, of course, the index to which<br />
indexed-linked sovereign UK debt is anchored.<br />
Most countries with index-linked debt link their bonds<br />
to some version of a consumer price index. The UK<br />
differs in that the RPI is, in effect, a fairly old, legacy<br />
index that uses what might be called an antiquated<br />
aggregation procedure in some parts of its<br />
construction. The result is that UK RPI inflation,<br />
which also includes a mortgage-based measure of<br />
housing costs, has tended over a long run of data to<br />
average 0.5pp higher than CPI inflation. And since<br />
2010, that difference has been 0.9pp.<br />
A methodological group within the Office for National<br />
Statistics (ONS), the Consumer Prices Advisory<br />
Committee (CPAC), is currently considering the case<br />
for making methodological changes to RPI that will<br />
move it closer in construction to the CPI. A statement<br />
from the National Statistician, alongside the CPAC<br />
3<br />
2<br />
1<br />
-1<br />
-2<br />
-3<br />
-4<br />
Chart 3: UK RPI vs. CPI Inflation (%)<br />
0<br />
1991 1994 1997 2000 2003 2006 2009 2012<br />
Source: ONS, <strong>BNP</strong> Paribas<br />
average 1991 onw ards<br />
average 2002 onw ards<br />
average 2010 onw ards<br />
minutes released this week, revealed the intention to<br />
put out to public consultation a range of options to<br />
change the aggregation of the RPI. At their most<br />
extreme, this would involve aggregating the RPI<br />
using the same formulae as in the CPI. That could, in<br />
effect, narrow the gap between CPI and RPI inflation<br />
from the aggregation bias to more-or-less zero.<br />
The attraction to the government of such a move is<br />
obvious. Changing the basis on which RPI is<br />
calculated and thereby lowering its rate could, in<br />
principle, save the sovereign GBP 3bn or so a year<br />
in interest costs. At a time of fiscal austerity, this is<br />
nothing to be scoffed at. On the other hand,<br />
changing the nature of the index used for indexlinked<br />
gilts might risk upsetting a key investor<br />
community upon which the government relies for<br />
considerable funding.<br />
Major methodological change cannot be ruled out<br />
The consultation on the changes to RPI will conclude<br />
in late November and we should know by January<br />
how the ONS is going to proceed. Any final decision<br />
to change the RPI index will rest with the Chancellor<br />
of the Exchequer. It is possible that comprehensive<br />
changes to the RPI could come in the February 2013<br />
inflation data, published in March. The timetable<br />
between a decision to go ahead with a change and<br />
publication looks exceptionally tight, however, and a<br />
delay until March 2014 may be possible. But<br />
contingent on the consultation, the ONS and CPAC<br />
appear keen to press ahead with significant changes<br />
to the RPI.<br />
David Tinsley 20 September 2012<br />
Market Mover<br />
12<br />
www.GlobalMarkets.bnpparibas.com
US Housing: New Channels for Policy<br />
• The housing sector has been the US<br />
economy’s bright spot in an otherwise<br />
disappointing economic performance in 2012.<br />
Chart 1: Rental Homes on the Rise<br />
• The improvement has not been driven by a<br />
recovery in household formation and demand for<br />
homeownership, which continue to be weak.<br />
• Rather, the rise in rents and decline in home<br />
values have boosted rental yields to the point that<br />
investors have begun to clear excess housing<br />
supply.<br />
• The Fed’s aggressive policies have depressed<br />
yields on safe assets to the point that solid<br />
nominal rental yields are quite attractive.<br />
• Thus, Fed policy is finally reaching housing,<br />
through a less conventional channel, and may<br />
even have a greater impact at the margin than in<br />
the past.<br />
Housing has turned a corner, despite the lack of<br />
demand for homeownership<br />
Housing has been a bright spot in the otherwise<br />
dismal US economic performance this year, raising<br />
hopes that QE might stimulate this critical sector with<br />
greater force now that the sector appears to be turning<br />
a corner. We think monetary policy, indeed, will have<br />
more oomph, but in a different way than it has in the<br />
past.<br />
Single-family home sales are up roughly 10% over a<br />
year earlier, home prices are up in the low-single digits<br />
and measures of excess supply have shown marked<br />
improvement. Yet, this is not a typical story of low<br />
mortgage rates stimulating increased demand. Owneroccupied<br />
housing units have not increased over the<br />
past year and are still down from the peak reached in<br />
2006 (see Chart 1).<br />
There appears to be little demand for homeownership.<br />
Mortgage applications for purchase have been<br />
essentially flat over the past several years (Chart 2).<br />
Despite mortgage rates hitting record lows,<br />
homeownership rates continue to drop, hitting levels<br />
not seen since 1997 (Chart 3), and total outstanding<br />
mortgage debt is still declining as households seek to<br />
deleverage and rebuild home equity. The New York<br />
Fed Quarterly Report on Household Debt and Credit<br />
published at the end of August indicated that<br />
consumer debt continued to decline in Q2, shrinking<br />
by another USD 52bn to USD 11.38trn. Mortgage debt<br />
has been on a constant downward trend since the<br />
financial crisis began in Q3 2008 (see Chart 4). The<br />
Source: Reuters EcoWin Pro<br />
Chart 2: Housing Demand Unmoved by QE<br />
Source: Reuters EcoWin Pro<br />
trend away from homeownership and housing<br />
leverage has continued unabated, despite the Fed’s<br />
aggressive monetary interventions.<br />
We have long been of the view that much of the lack<br />
of demand for housing is probably a structural<br />
phenomenon; younger households need mobility and<br />
liquidity in a weak labour market and have learned the<br />
hard lessons from their parents that housing is hardly<br />
a safe investment. The overall pace of household<br />
formation continues to run below prior norms, driven<br />
by new views on homeownership and the weakness in<br />
the economy. The share of people aged 25-34, the<br />
peak years for household formation, who are living<br />
with their parents remained unchanged at nearly 14%<br />
in 2011, well above the share closer to 11% that<br />
prevailed before the crisis.<br />
Investors are the new homeowners<br />
If there is no demand from housing, what is driving the<br />
improvement? It appears that rents have risen and<br />
home prices have declined to the point where<br />
investors see value in buying real estate for<br />
conversion to rental. While there is no growth in<br />
Julia Coronado and Yelena Shulyatyeva 20 September 2012<br />
Market Mover<br />
13<br />
www.GlobalMarkets.bnpparibas.com
owner-occupied housing units, renter-occupied<br />
housing units have been on a sharp, upward trend,<br />
adding about 1mn per year over the past two years<br />
(Chart 1). Rental yields, calculated as annual rent<br />
divided by home prices, have now reached their<br />
highest levels as far back as we have data, even as<br />
yields on other assets have been declining steadily<br />
(see Chart 5).<br />
As investors seek returns, housing looks increasingly<br />
attractive. A lot of increased activity has come from<br />
cash buyers; the National Association of Realtors<br />
reports that the share of existing single-family home<br />
sales purchased by cash buyers has risen to just<br />
below 30% from 20% a few years ago. Private equity<br />
investors have also been reportedly buying blocks of<br />
homes for rental conversion, although comprehensive<br />
data on this source of demand is unavailable. If prices<br />
remain stable, banks could become more willing to<br />
lend to potential landlords. Indeed, The Wall Street<br />
Journal reported this week that ratings agencies are<br />
exploring rating securities backed by home rental<br />
contracts. A market for securitized rental contracts<br />
could significantly increase the investor demand base.<br />
Broadening the investor/rental market is no simple<br />
task. Some regions have higher rental yields than<br />
others, and each state has its own legal framework for<br />
rental contracts and protections for renter occupants.<br />
Regions that experienced more of a housing boom<br />
and bust, like the South and West, currently offer the<br />
highest rental yields. Despite the complexities<br />
involved, rental yields are increasingly compelling on<br />
the back of negative real yields on safe assets, and<br />
we would expect this market to continue to grow.<br />
A new channel for monetary policy<br />
The Fed has tried valiantly to stimulate housing with<br />
its unconventional policies. It has acquired a net USD<br />
844bn in mortgage securities and roughly USD 1ttrn<br />
in Treasuries since the crisis began. Mortgage rates<br />
have dropped to record lows. Yet, demand for<br />
homeownership remains dismal by historical<br />
standards. It is tempting to conclude that the Fed’s<br />
new efforts will have little-to-no impact on this critical<br />
sector (Chart2).<br />
However, the portfolio balance channel appears to<br />
finally be reaching the housing market. QE has been<br />
quite successful driving down yields on safe assets<br />
and forcing investors into riskier assets, such as<br />
corporate bonds and equities. It appears that housing<br />
is increasingly becoming an important beneficiary as<br />
investors are driven toward the now relatively much<br />
more attractive investment of rental housing. This is<br />
good news from a macroeconomic standpoint, as well,<br />
since increased rental supply will help meet our<br />
expectation of continued growth in rental demand.<br />
Greater investor activity should lead to further stability<br />
Chart 3: Homeownership Is Plunging<br />
Source: Reuters EcoWin Pro<br />
Chart 4: Mortgage Deleveraging Continues<br />
Source: Reuters EcoWin Pro<br />
Chart 5: Housing Is a Great <strong>Investment</strong><br />
Source: Reuters EcoWin Pro<br />
or modest gains in home prices, and temper the<br />
recent rise in rents, thereby, relieving upward pressure<br />
on core inflation.<br />
The rise in housing investors will not boost all<br />
segments of the housing market; higher-end suburban<br />
markets are not good candidates for investors seeking<br />
a liquid rental market. However, many middle- and<br />
lower-end neighbourhoods and urban areas should<br />
continue to see improved demand dynamics on the<br />
back of the Fed’s aggressive new policy stance and<br />
may even lead to an increased marginal impact from<br />
their interventions.<br />
Julia Coronado and Yelena Shulyatyeva 20 September 2012<br />
Market Mover<br />
14<br />
www.GlobalMarkets.bnpparibas.com
Japan: The Eastern Fiscal Cliff<br />
• Due to its inability to enact deficit-financing<br />
legislation, the government has decided to<br />
suspend for three months the disbursal of<br />
roughly JPY 5trn in expenditure. While this<br />
should have little economic impact, failure to<br />
enact this legislation by December could trigger<br />
more drastic spending cuts of roughly JPY 7trn<br />
(almost 5.7% of GDP) in December.<br />
• To avoid such a disastrous development, debtfinancing<br />
legislation needs to be enacted as<br />
soon as possible, something that will require<br />
some kind of deal with the opposition LDP. And<br />
here, there are two main possibilities.<br />
• The straightforward deal would be to agree to<br />
dissolve the lower house in exchange for<br />
opposition support for the legislation. This would<br />
mean a snap election by year end (or slightly<br />
thereafter, if Prime Minister Yoshihiko Noda<br />
insists on passing a supplementary budget).<br />
• The other option would be for the LDP to make<br />
its cooperation contingent on an agreement to<br />
forswear using such legislation as a political<br />
trump card, something that would benefit the<br />
LDP should it return to power (as seems likely).<br />
This would leave the dissolution of the lower<br />
house at Prime Minister Noda’s discretion,<br />
essentially pushing the general election back to<br />
next summer.<br />
Budgetary disbursement delayed for first time in<br />
postwar era<br />
Non-essential budgetary spending has been<br />
postponed for the first time in the post-war era. The<br />
government has moved to conserve cash, because<br />
the Diet session was drawing to a close (on 8<br />
September) without action being taken on legislation<br />
authorising the issue of deficit-financing bonds. As<br />
almost half of the spending in the general account<br />
budget is covered by deficit-financing bonds, it will be<br />
impossible to implement the budget as planned<br />
without this key legislation. With the fate of the debtfinancing<br />
bill still uncertain owing to the political<br />
stalemate in the divided Diet, there is a risk that the<br />
government could run out of cash by late October.<br />
Consequently, in an effort to tide things over at least<br />
through November, the government on 7 September<br />
decided to conserve cash by suspending for three<br />
months the disbursal of roughly JPY 5trn in spending.<br />
These funds had been destined for (1) administrative<br />
expenses (telephone and photocopying charges,<br />
etc.), (2) subsidies to independent organisations,<br />
such as national universities, (3) tax-revenue grants<br />
to local governments, and (4) transfers to the special<br />
accounts (including the public pension-fund special<br />
account). To limit the impact on people’s lives and<br />
the economy, all essential spending (social welfare,<br />
defence, reconstruction, etc.) will not be affected.<br />
That said, if the debt-financing legislation remains in<br />
limbo, drastic spending cuts will become inevitable,<br />
resulting in a partial shutdown of government. And<br />
this would have serious ramifications for the<br />
economy and daily life.<br />
US faced government shutdown risk last summer<br />
While one might shudder at the idea of a government<br />
shutdown, it is worth remembering that the US faced<br />
a similar risk last July because of the debt-ceiling<br />
crisis. As in Japan, the US federal budget and the<br />
amount the government can borrow to service the<br />
budget deficits (debt ceiling) are agreed separately.<br />
Congressional authorisation is required whenever the<br />
debt ceiling is raised. In the US, where control of<br />
Congress can often be divided between government<br />
and opposition, negotiations on raising the debt<br />
ceiling ran into difficulty when Democrat and<br />
Republican views on fiscal affairs collided. And for a<br />
while, there was a growing risk that an agreement<br />
might not be reached, which could have resulted not<br />
only in the delayed disbursement of social security<br />
benefits and other payments, but also sovereign<br />
default. While an accord was reached at the eleventh<br />
hour, financial markets were destabilised for a while.<br />
Little economic impact from delaying JPY 5trn<br />
Getting back to Japan, the recent decision to save<br />
roughly JPY 5trn basically involves the delayed<br />
disbursal of funds, though there also is the possibility<br />
that some of this spending might be eliminated<br />
altogether. The targeted administrative expenses and<br />
subsidies to independent organisations could be<br />
axed. Together, this could save the government<br />
roughly JPY 600bn, a fairly insignificant amount in<br />
macro terms (ultimately, we suspect little spending<br />
will actually be cut). The lion’s share of the spending<br />
delays come from transfers to the special accounts<br />
(JPY 2.3trn) and tax-revenue grants to local<br />
government (JPY 2.1trn), which cannot be cut.<br />
Accordingly, as these disbursements will only be<br />
delayed for three months and duly paid out from<br />
December, the economic impact, when averaged out<br />
over the full period, should be pretty neutral.<br />
Ryutaro Kono/ Makoto Watanabe 20 September 2012<br />
Market Mover<br />
15<br />
www.GlobalMarkets.bnpparibas.com
Potential cash shortages ahead<br />
But if the debt-financing legislation remains blocked by<br />
the time December comes, drastic spending cuts and<br />
a partial shutdown of government will be unavoidable.<br />
The impact on the economy would be severe.<br />
Budgetary outlays are prevalent in December. For<br />
example, in December 2011, expenditures exceeded<br />
revenue (excluding government bonds) by almost JPY<br />
7trn (equivalent to roughly 5.7% of Q4 GDP). In the<br />
final quarter of FY2011, revenue exceeded spending<br />
by roughly JPY 2trn in January, but this was followed<br />
by shortfalls of more than JPY 5trn in February and<br />
roughly JPY 10trn in March, for a combined quarterly<br />
shortage of JPY 13trn (equivalent to about 11.1% of<br />
Q1 GDP). As the budget balance this fiscal year will<br />
likely be similar, very drastic spending cuts could<br />
become necessary. Of course, all spending does not<br />
directly affect the economy (delaying transfers to<br />
special accounts absorbs the reserve surpluses<br />
parked in some special accounts). But even if the<br />
amount were reduced by half, the impact on the<br />
economy would be substantial. Currently, with exports<br />
trending lower as a result of the slowing global<br />
economy and with economic support ending from the<br />
eco-car subsidy programme and income transfers to<br />
households in quake-hit areas, we expect the<br />
economy to enter another soft patch from Q3. But if<br />
the deficit-financing bill is not enacted by December,<br />
cuts in government spending will make conditions far<br />
worse than just a soft patch.<br />
Election by year end seems likely<br />
To avoid this, the debt-financing legislation needs to<br />
be enacted as soon as possible. But that is easier<br />
said than done. To win cooperation from the<br />
opposition LDP and New Komeito, Prime Minister<br />
Noda will have to make some kind of deal, and we<br />
see two main possibilities here. The most<br />
straightforward deal under current circumstances and<br />
based on past experience would be to agree to<br />
dissolve the lower house in exchange for opposition<br />
support of the debt-financing legislation and another<br />
vital bill involving electoral reform to rectify vote-value<br />
disparities. As both the DPJ and LDP are slated to<br />
hold leadership elections shortly (the DPJ on 21<br />
September, the LDP on 26 September), followed by<br />
an extraordinary Diet session in early October, such<br />
a deal would likely mean passing the debt-financing<br />
bill and electoral reform in October, then dissolving<br />
the lower house in November for an election by year<br />
end. While this election scenario is probable, there is<br />
a possibility that Prime Minister Noda (who looks set<br />
to be re-elected DPJ head) could put off calling an<br />
election until the last minute, as he is also eager to<br />
enact a supplementary budget. In this case, the<br />
election would be pushed back to January or so.<br />
Another condition for the LDP’s cooperation<br />
The second potential deal involves the LDP making<br />
its cooperation on the debt-financing legislation<br />
contingent on an agreement to forswear using such<br />
legislation as a political trump card, in other words,<br />
Chart 1: Impact of Planned Spending Delays<br />
General account expenditures (excludes outlays relating to construction bonds)<br />
Path if budget is fully implemented<br />
JPY<br />
46.1 trillion<br />
Total revenue if debt-financing bill not enacted (authorized spending total)<br />
JPY 10<br />
trillion +<br />
JPY<br />
38.6 trillion<br />
Spending implemented as of<br />
30 September<br />
(MOF projection was JPY<br />
39.3 trillion on 6 July)<br />
Funding requested by<br />
various agencies:<br />
JPY 10.9 trillion<br />
Path if spending is curbed from<br />
September<br />
Impact (i.e., savings) from spending curbs<br />
*September: (Tax rev enue grants: -JPY 2.2 trillion; subsidies to Japan Health Insurance Assoc.:<br />
-JPY 500 billion; subsidies to independent organizations: -JPY 100 billion)<br />
*October: (Tax rev enue grants: +JPY 700 billion; transf ers to public pension special account:<br />
-JPY 1.1 trillion; subsidies to independent organizations: -JPY 100 billion)<br />
*November : (Tax rev enue grants: -JPY 800 billion; gov ernment subsidization of priv ate education:<br />
-JPY 1.1 trillion; subsidies to independent organizations: -JPY 100 billion)<br />
April May June<br />
July August September October November<br />
Source: MOF, <strong>BNP</strong> Paribas<br />
Note 1: Projections as of now, figures could change.<br />
Note 2: “Path if budget is fully implemented” incorporates normal management of the budget (including adjusting the timing of transfers to special accounts).<br />
Note 3: “Path if spending is curbed from September” assumes tax revenue grants in November will be handled the same as those in September (the MoF has<br />
indicated it will review this). (Meanwhile, the projected savings of JPY 2.2trn from curbing tax-revenue grants in September includes the normal grants to prefectural<br />
governments worth JPY 1.4trn plus JPY 700bn from forgoing the front-loading of transfers to the special account for local-allocation tax.)<br />
Ryutaro Kono/ Makoto Watanabe 20 September 2012<br />
Market Mover<br />
16<br />
www.GlobalMarkets.bnpparibas.com
an agreement that all budget-related bills will be<br />
concurrently approved in the event that the main<br />
budget proposal is enacted. As we pointed out in<br />
Market Mover of 7 September (Japan: Deficit-<br />
Financing Bill Problem), Article 60 of Japan’s<br />
constitution gives precedence to decisions on the<br />
budget by the lower house (but not budget-related<br />
bills). So, in accordance with the spirit of this article,<br />
Diet passage should be automatic for any budgetrelated<br />
bills needed to implement the budget.<br />
A summertime election not out of the question<br />
As to why the LDP might prefer this kind of deal, well,<br />
the party is confident that it can wrest power from the<br />
government at the next election. However, as it will<br />
still lack a majority in the upper house, the stalemate<br />
of a divided Diet is likely to remain until next July, at<br />
least, when half of the upper chamber must stand for<br />
re-election. What this means is that playing the trump<br />
card to force an already winnable general election<br />
means gambling, too, on prevailing in the next upper<br />
house election. If the LDP failed to secure an upperhouse<br />
majority (a real possibility), it would be faced<br />
with the same predicament as it is today, of not being<br />
able to win passage of its budget-related bills. Worst<br />
case, deficit-financing legislation would remain the<br />
opposition’s trump card for bringing down the<br />
government year after year (Japan’s “revolving-door<br />
premiership”). Consequently, the LDP may deem it<br />
more advantageous to forgo a snap election and<br />
focus instead on a deal that forswears for good the<br />
use of budget-related bills as a political football. That<br />
would mean leaving the dissolution of the lower<br />
house to the discretion of Prime Minister Noda, who,<br />
because of his party’s dismal approval ratings, is<br />
eager to delay the election as long as possible. This<br />
would essentially mean hodling the upper and lower<br />
house elections next summer (the lower house’s<br />
term ends in August 2013). The LDP, meanwhile,<br />
could use this time to prepare for both elections<br />
under new leadership. As all of the candidates<br />
running to replace LDP head Sadakazu Tanigaki are<br />
aware of the risks of playing this trump card (it was<br />
used against the LDP when it was in power, and the<br />
LDP has used it to attack DPJ regimes), the<br />
likelihood of the summertime election scenario is not<br />
necessarily small.<br />
Ryutaro Kono/ Makoto Watanabe 20 September 2012<br />
Market Mover<br />
17<br />
www.GlobalMarkets.bnpparibas.com
This section is classified as non-objective research<br />
US: A Short Respite, That’s All<br />
• It did not take long for scepticism to rise in<br />
regards to whether the Fed’s latest actions will<br />
be a lasting cure. It is not surprising that the<br />
markets are having a “let’s think about this”<br />
moment after the heady moves of last week, but<br />
we attribute the pullback mostly to profit-taking<br />
and other transitory factors.<br />
• The underlying theme of the Fed supporting<br />
risk appetite remains strong. We expect rates to<br />
move slightly higher, with the 10yr settling<br />
around 2% in the next couple of months, and<br />
yield enhancement remaining in sharp focus.<br />
• STRATEGY: The backdrop created by the<br />
Fed bodes well for callables and corporates –<br />
and the case for holding on to MBS has been<br />
settled for good. Use the current drop in rates to<br />
establish curve steepeners heading into<br />
October.<br />
5s10s30s Tsy Fly<br />
Chart 1: The Relative Value of the 10yr Is a<br />
Function of the Directional Moves<br />
20<br />
10<br />
0<br />
-10<br />
-20<br />
-30<br />
1.3 1.6 1.8 2.1 2.3 2.6<br />
Source: <strong>BNP</strong> Paribas<br />
10y Tsy<br />
Chart 2: The 10yr Treasury to Move Back to the<br />
10yr Area<br />
Treasuries, Duration and the Curve<br />
The reversal in the Treasury markets in the past few<br />
sessions has caused many to question whether the<br />
selloff and steepening that happened on the back of<br />
the Fed’s QE announcement have already run their<br />
course. We think this week’s action is but a shortlived<br />
retracement, driven partly by some transient<br />
factors, such as:<br />
2.5<br />
(bp)<br />
2.0<br />
1.5<br />
10y Tsy<br />
1.8%<br />
2.1%<br />
• Profit-taking (after all, the 5s30s steepening<br />
trade has been a winning position for many)<br />
• Heavy buyback schedule through next week,<br />
skewed toward purchases in the long end<br />
(three out of the remaining five operations<br />
are in the bond sector)<br />
• Treasury supply in the 2y, 5y and 7y sectors<br />
next week, which tilts the balance in favour<br />
of flatteners<br />
• Month-end purchases looming on the<br />
horizon.<br />
More troubling, and not as transient, the slew of<br />
headlines about Europe have reminded everyone<br />
that the continent is not out of the woods yet and a<br />
plethora of issues – from the timeline for banking<br />
regulation to Spain’s willingness (or reluctance) to<br />
ask for aid – have yet to be sorted out. This, in turn,<br />
has thrown cold water on the post-FOMC euphoria,<br />
even if the ECB’s actions may have curtailed the tail<br />
risk. Add to that signs of a slowdown in Asia, and<br />
worries about the global picture multiply.<br />
1.0<br />
Sep-11 Nov-11 Jan-12 Mar-12 May-12 Jul-12 Sep-12<br />
Source: <strong>BNP</strong> Paribas<br />
There is a silver lining in the link to the global story<br />
though: The fact that many markets seemingly<br />
moved in lockstep, giving back some of the post-<br />
FOMC moves, underlines the fact that the Treasury<br />
market alone has not run out of room to sell off here.<br />
It is simply responding to the ups and downs of the<br />
global macro picture, rather than having reached<br />
levels where investors have found tremendous value<br />
and decided to invest in the asset class. This, we<br />
argue, is a bigger factor that far outweighs any of the<br />
technical factors we cited above. The immediate<br />
implication is that, absent negative news from<br />
Europe, the Treasury correction toward higher rates<br />
and a steeper curve should resume, albeit gradually.<br />
So, let’s separate what we expect between now and<br />
the end of next week from the longer-term trend. For<br />
Bülent Baygün / US Interest Rates Strategy Team 20 September 2012<br />
Market Mover<br />
18<br />
www.GlobalMarkets.bnpparibas.com
This section is classified as non-objective research<br />
now, go with the bull-flattening move, overweighting<br />
the 10y sector (vs 5s and the back end) since it tends<br />
to outperform on an RV basis even as 10s30s may<br />
flatten (5s10s flattens more, that’s all) – see Chart 1.<br />
Furthermore, as the curve flattens in a rally, home in<br />
on the sectors with the best rolldown, which, by the<br />
way, is in the 4y to 5y area. As an aside, for those<br />
who can use options, we recommend going long this<br />
sector using options since the strong rolldown more<br />
than offsets the decay, due to theta in structures,<br />
such as the 4y1y ATMF receivers, etc. (See “Too<br />
Steep, Too Fast? The Case of the 1y Forwards”, in<br />
this week’s Market Mover for further details.)<br />
Looking past month-end, our focus will be on a resteepening<br />
of the curve, with rates ratcheted higher<br />
as markets begin to feel the long-term impact of the<br />
Fed’s actions, with risk appetite staying firm. There is<br />
also a local steepening bias heading into the 3y, 10y<br />
and 30y supply over Oct 9-11, but again this will be<br />
secondary to the bigger forces in place, namely the<br />
support of the Fed. We think that the 10y Treasury<br />
can settle in a range from 1.80% to 2.10%, using for<br />
guidance the lull that lasted from late-2011 through<br />
early-2012 (see Chart 2). That was a period of<br />
relative calm in Europe, while the US economy<br />
appeared to show signs of resilience, both of which<br />
proved to be too fleeting.<br />
We do not foresee a runaway selloff beyond those<br />
levels in the next few months, as the road ahead for<br />
Europe will be choppy, even if the tail risk may no<br />
longer be there. As rates rise, we expect the curve<br />
dynamic we alluded to above to remain intact, only in<br />
reverse, with the 10y underperforming on an RV<br />
basis along the curve. As for 10s30s, note that this<br />
sector of the curve steepened by 50bp from their<br />
lows through each of the previous two rounds of QE.<br />
To put things in perspective, so far 10s30s only<br />
moved by about 20bp from their local lows we saw in<br />
summer 2012, ahead of the Fed’s new QE program,<br />
so it has room to go. Our favoured steepener position<br />
remains 5s30s/7s30s though, as we expect the 5y to<br />
just tread water in the 55 to 70bp area, keeping the<br />
7y relatively anchored too.<br />
TIPS<br />
In TIPS, we continue to believe that there is<br />
significant upside potential for breakevens, but we<br />
have been sidelined now for a week, awaiting a<br />
pullback from very rich levels in order to participate<br />
again. We continue to emphasize that trading<br />
breakevens from the short side constitutes too great<br />
a risk for the potential reward, but we are happy to<br />
stay neutral for the time being as breakevens sell off<br />
in order to gain a better entry opportunity in the<br />
future. For now, that means adding on dips in 10yr<br />
breakevens back at 230bp and all the way back to<br />
220bp, should that level arrive. The current level<br />
around 2.50% seems justified, given the Fed’s QE,<br />
but may need some correction in the short run.<br />
Should the 10yr cheapen significantly further<br />
following the auction, we would be buyers on dips.<br />
We also believe that real money may be better<br />
buyers, given the long-run implications of openended<br />
QE and what we believe will be a much<br />
greater flow into inflation products in the months<br />
ahead. The persistent buying on dips that we have<br />
seen convinces us that there is broader demand for<br />
the 10yr.<br />
Short-Term Financing<br />
There are two headline topics in STIR right now: (1)<br />
How fast and how far will Libor rates fall; and (2) Why<br />
is repo still stubbornly high?<br />
The stubborness of repo is actually serving as a soft<br />
floor for 1m Libor rates, so we'll deal with that topic<br />
first. As we said last week, the Fed's decision not to<br />
halt the Treasury sellbacks in the short end has kept<br />
primary dealer inventories of Treasury paper near<br />
historical highs. Primary dealers borrow ~USD 500bn<br />
of cash in the repo markets each day to finance their<br />
books. The build-up of Treasury paper is keeping<br />
upward pressure on Treasury GC repo rates, which<br />
touched above 30bp late last week and are hovering<br />
in the mid-20s now. Once again, this has made carry<br />
on the 2y Treasury note flat to negative. It's a bit of a<br />
head-scratcher as to why some investors prefer<br />
lending cash unsecured at, for example, 15 bp in the<br />
Fed funds market or 12bp for financial CP vs 25bp<br />
collateralized by repo. It speaks not to the lack of<br />
appetite for increasing yield, but to the lack of<br />
fungibility and increased complexity of repo vs these<br />
other markets. These constraints and the impending<br />
quarter-end, no doubt, will keep repo elevated or<br />
push it higher through the remainder of the month.<br />
We do not expect repo to significantly decline<br />
towards the single digits until the Fed ends their<br />
sellbacks at year-end.<br />
The repo effect will keep a soft floor under Libor<br />
rates. The 3mL settings continue to fall by 0.3bp to<br />
0.5bp per day, and are likely headed towards 25bp<br />
by year-end. The slow decline in 1mL has ground to<br />
a halt as – at ~22bp – it is roughly even to slightly<br />
below overnight, secured financing. We do expect<br />
more compression and lower rates in the front end of<br />
the curve, and it is possible that Libor, CP, CDs and<br />
other rates could fall well below repo ahead of yearend,<br />
but we doubt it. Expect more compression in<br />
3s1s and a flattening of the front Eurodollar curve<br />
during the last quarter of 2012.<br />
Agencies<br />
There has been an extraordinary tightening of the<br />
mortgage basis since the Fed confirmed that they will<br />
Bülent Baygün / US Interest Rates Strategy Team 20 September 2012<br />
Market Mover<br />
19<br />
www.GlobalMarkets.bnpparibas.com
This section is classified as non-objective research<br />
be hoovering up subtantially all agency mortgage<br />
origination for the foreseeable future, as part of their<br />
open-ended QE3 program. The intent is to<br />
encourage – or arguably coerce – investors into<br />
allocating out of agency MBS and similarly situated<br />
products, and re-invest by going down in credit or<br />
into equities. Despite the "crowding out" effect, many<br />
investors are captive – in whole or in part – to the<br />
rates market. These include the investment portfolios<br />
of commercial banks, state and local governments,<br />
central banks and portions of pension benefits and<br />
insurance obligations. These investors are<br />
substantially confined to high-quality deeply liquid<br />
assets, such as US Treasuries and sovereign debt,<br />
agency debt and agency MBS, other highly rated<br />
sovereign agency and supranational paper, AAArated<br />
covered bonds, and, in some amount, AA or<br />
better corporate or securitized debt obligations.<br />
Agency MBS have long been a favoured product in<br />
many of these investment portfolios to increase yield.<br />
Although we expect the Treasury curve to continue<br />
steepening in the medium term, yields in maturities<br />
out to 5 years should remain well-anchored, due to<br />
the limited opportunities for diversification, the<br />
shrinking supply of agency debt and the Fed’s<br />
wholesale absorption of MBS. Agency callables and<br />
bullets have now become the standout winners on a<br />
relative value basis among the rates products. For<br />
investors, we strongly prefer callable agencies to<br />
lower and current coupon MBS. Both 10nc2y and<br />
7nc2y berms are projected to outperform FN 2.5 and<br />
3.0s, respectively, over a 6m horizon in this<br />
environment. The 7-year sector of the agency curve<br />
is also the steepest among the rates curves and 5-<br />
year to 7-year agency bullets outperform similarduration<br />
Treasuries and swaps. Repo for agency<br />
paper vs Treasuries is now flat to a measly 1-2bp.<br />
Amid declining agency debt supply and increased<br />
buying as captive investors are forced out of MBS,<br />
we see further agency to Treasury spread<br />
compression ahead.<br />
MBS<br />
Our economists expect QE3 MBS purchases to<br />
continue at the USD 40bn per month pace at least<br />
until year-end 2013, and possibly into 2014. Including<br />
reinvestments of maturing agency debt in the Fed's<br />
portfolio into agency MBS, the net demand from the<br />
Fed would exceed USD 500bn over the next 12<br />
months. The issuance of the TBA deliverable bonds<br />
where Fed purchases have been concentrated was<br />
negative USD 172bn over the past 12 months,<br />
roughly a negative USD 14.3bn per month average.<br />
Thus, the Fed demand for MBS is particularly high in<br />
relation to the negative supply of the bonds that the<br />
Fed has traditionally purchased.<br />
The QE3 announcement has driven MBS to very<br />
expensive levels, and mortgages are more expensive<br />
than Treasuries and to a greater extent than during<br />
QE1. While there was some pullback after the<br />
massive initial tightening, MBS, once again,<br />
outperformed Treasuries in Wednesday’s rally. In<br />
addition, with the announcement of QE3, volatility<br />
has declined. The decline in vol has helped improve<br />
hedged adjusted carry across the coupon stack.<br />
Empirical durations have also come off, improving<br />
MBS carry.<br />
While we expect MBS to continue to outperform<br />
Treasuries, riskier assets may perform even better.<br />
The Fed would effectively be buying MBS from<br />
money managers who are overweight MBS and<br />
GSEs that have been forced to reduce their<br />
portfolios. Rather than explicit sales of MBS, we<br />
mainly expect reinvestments of mortgage<br />
prepayments and, due to declining agency debt<br />
outstanding, into other products. We estimate that<br />
money managers could experience USD 150bn to<br />
USD 200bn in prepayments and agency debt<br />
outstanding could decline between USD 50bn to<br />
USD 200bn over the next year.<br />
Table 1: Market Going Through Some Growing Pains, but Risk Appetite Should Be Supported in the<br />
Medium Term<br />
Treasuries, Duration and the Curve Current pullback to persist through month-end, so turn neutral/slightly bullish tactically overweighting 10s vs. 5s and 30s.<br />
Long-term bear-steepening trend to resume, so stay nimble. Buy 4y1y receiver to benefit from lofty rolldown.<br />
TIPS<br />
We like breakevens coming out of the 10yr auction and hope to add to our positions again on significant dips.<br />
Short-Term Financing<br />
Repo is likely to stay elevated through year-end and provide a soft floor to short-term funding rates. Expect compression in<br />
3s1s as 3mL declines faster than 1mL<br />
Agencies<br />
We strongly recommend 7nc2y to 10nc2y berms as alternatives to current and lower coupon TBA mortgages based on<br />
their projected outperformance.<br />
MBS<br />
Maintain MBS overweight as demand is strong and supply is negative. Carry has improved with declining volatility and<br />
lower empirical durations.<br />
Source: <strong>BNP</strong> Paribas<br />
Bülent Baygün / US Interest Rates Strategy Team 20 September 2012<br />
Market Mover<br />
20<br />
www.GlobalMarkets.bnpparibas.com
This section is classified as non-objective research<br />
MBS: Shorter Empirical Durations Under QE<br />
• QE3 is likely to bring in lower empirical<br />
durations akin to QE1, due to stability in rates<br />
and mortgage prices.<br />
• The 15bp to 30bp state-based upfront g-fee<br />
amounts to a small 3bp to 6bp rate increase,<br />
based on the IO multiple of 5 used by the FHFA.<br />
With the Fed bringing an element of stability to rates<br />
and particularly mortgage prices, empirical durations<br />
have begun to decline. Chart 1 shows the ratio of<br />
empirical-to-trader hedge ratios for 3.5s and 5s; we<br />
chose just those two coupons as representatives to<br />
provide a clearer picture of the contrast between lower<br />
and higher coupons. While the ratios for all coupons<br />
are declining, the declines seem to be of a greater<br />
magnitude in higher coupons. Plus, the ratios are<br />
greater than one in 4.0s and lower coupons, but lower<br />
in 4.5s and higher coupons.<br />
A similar trend was observed during QE1, when<br />
empirical hedge were ratios shorter than trading ratios,<br />
particularly for higher coupons (Chart 2). We show 4.5s<br />
and 6s as representatives since the current coupon<br />
was much higher during QE1 than at present. Lower<br />
empirical durations would improve the hedge carry of<br />
MBS. The decline post-QE3 announcement has also<br />
helped to improve hedge adjusted carry across the<br />
coupon stack (Chart 3).<br />
We continue to expect MBS to outperform<br />
Treasuries, despite the richening, given steep<br />
demand from the Fed against a negative net supply.<br />
Clearly, carry is already attractive and should<br />
improve further with lower durations and volatility.<br />
However, as we discuss in an accompanying article,<br />
”QE3 Impacts on US Spread Products”, riskier asset<br />
classes, such as corporates, may perform even<br />
better than MBS.<br />
State-Based G-fee<br />
FHFA announced that it would potentially implement<br />
an additional state-level g-fee (guarantee fee), starting<br />
in 2013, for five states: Connecticut (20bp), Florida<br />
(20bp), Illinois (15bp), New Jersey (20bp) and New<br />
York (30bp). This g-fee proposal is under comment<br />
period for 60 days. Lenders may pass the upfront fee<br />
as an adjustment to the interest rate on the borrower’s<br />
loan. The FHFA used the suitable IO multiple of 5 in<br />
their example to make the adjustment to the annual<br />
rate from upfront fee. This amounts to a small 3bp to<br />
6bp rate increase, depending on the state.<br />
Chart 1: Empirical vs Trader Hedge Ratios – QE3<br />
1.2<br />
1.0<br />
0.8<br />
0.6<br />
0.4<br />
0.2<br />
-<br />
Empirical Vs Trader 3.5s<br />
Empirical Vs Trader 5s<br />
Jan-12 Mar-12 May-12 Jul-12 Sep-12<br />
Source: <strong>BNP</strong> Paribas<br />
Chart 2: Empirical vs Trader Hedge Ratios – QE1<br />
2.0<br />
1.5<br />
1.0<br />
0.5<br />
Empirical Vs Trader 4.5s<br />
Empirical Vs Trader 6s<br />
-<br />
Nov-08 Feb-09 May-09 Aug-09 Nov-09 Feb-10<br />
Source: <strong>BNP</strong> Paribas<br />
1M Hedged Adjusted Carry (ticks)<br />
8<br />
6<br />
4<br />
2<br />
0<br />
Chart 3: Hedge Carry Has Improved<br />
-2<br />
FNMA 3.0s FNMA 3.5s<br />
FNMA 4s FNMA 4.5s<br />
-4<br />
FNMA 5s FNMA 5.5s<br />
7/2 7/16 7/30 8/13 8/27 9/10<br />
Source: Yield Book, <strong>BNP</strong> Paribas<br />
The g-fee estimation is based on three factors. The<br />
first is the expected number of days that it takes an<br />
Enterprise to foreclose and obtain a marketable title to<br />
the collateral backing a mortgage in a particular state.<br />
The second is the average per-day carrying cost that<br />
the Enterprises incur in that state. The third is the<br />
expected, national average default rate on singlefamily<br />
mortgages acquired by the Enterprises. To<br />
estimate the magnitude of the state-level differences<br />
in the average total carrying cost, the estimation<br />
assumes that loans originated in each state will default<br />
at the national average default rate.<br />
Timi Ajibola 20 September 2012<br />
Market Mover<br />
21<br />
www.GlobalMarkets.bnpparibas.com
This section is classified as non-objective research<br />
US: Too Steep, Too Fast? The Case of the<br />
1y Forwards<br />
• Buoyed by ECB and Fed support, risk<br />
markets have pulled back from the depths of<br />
despair that prevailed in midsummer, with<br />
Treasuries losing their risk premium and the<br />
curve steepening in response.<br />
• While we fully respect the underlying<br />
steepening dynamic from the belly of the curve<br />
out to the 30yr sector, we do not expect this<br />
bias to exert itself in maturities 5 years and<br />
under. Yet, this is what seems to have<br />
happened in the recent selloff, creating<br />
compelling opportunities to capitalize on.<br />
• STRATEGY: Buy 4y1y ATMF receiver. Also<br />
initiate 8y1y vs 9y1y flattener.<br />
The Preamble, a.k.a as the Trade Rationale<br />
Steepeners from the belly of the curve to the 30yr<br />
sector have been a core position that we have<br />
advocated for the past month or so, and the market<br />
dynamic has made this a profitable trade (see Chart 1).<br />
Since Monday though, the post-FOMC euphoria seems<br />
to have given way to some soul-searching, as<br />
scepticism about Europe re-emerged and investors<br />
chose to take some chips off the table. However, given<br />
the game-changing nature of the Fed’s actions, coupled<br />
with the fact that the ECB’s actions have curtailed tail<br />
risk in the continent, we expect risk appetite to remain<br />
firm and the upward trend in rates to resume once we<br />
go past the heavy buyback schedule of these two<br />
weeks and month-end flows move out of the way.<br />
Even then, there is little reason to expect yields in<br />
maturities less than five years to follow suit and rise<br />
abruptly as the 10yr conceivably pulls close to the 2%<br />
area and the curve steepens in response to the better<br />
tone in the markets. The linchpin of our argument is<br />
the Fed’s professed policy of staying the course in low<br />
rates through mid-2015. From where we stand now,<br />
not only does this anchor rates for the first three years,<br />
but quite possibly for a year or two afterward since the<br />
Fed does not expect to embark on an aggressive<br />
tightening cycle. In other words, the rates market<br />
should not be quick to price in a quick succession of<br />
rate hikes beyond mid-2015, especially in the absence<br />
of a sustained improvement in the employment<br />
outlook, which does not appear to be in the cards, at<br />
least in the next few months, even by the Fed's own<br />
Chart 1: Curve Has Steepened Across the Entire<br />
Maturity Spectrum<br />
3.5<br />
(%)<br />
3.0<br />
2.5<br />
2.0<br />
1.5<br />
1.0<br />
0.5<br />
0.0<br />
Source: <strong>BNP</strong> Paribas<br />
70<br />
(bp)<br />
40<br />
10<br />
-20<br />
7/20/12<br />
9/20/2012<br />
2y 3y 5y 7y 10y 30y<br />
Chart 2: The 4y1y and 5y1y Offer the Best<br />
Rolldown Over a 1-Year Horizon<br />
1Y1Y<br />
2Y1Y<br />
Source: <strong>BNP</strong> Paribas<br />
3Y1Y<br />
4Y1Y<br />
5Y1Y<br />
projections. This suggests that rolldown strategies<br />
targeting the belly of the curve may be quite attractive.<br />
6Y1Y<br />
1y Rolldown<br />
Chg in 1y Rolldown<br />
Chart 3: The Vol-Adjusted Rolldown of the 4y1y<br />
Is at an Historically Attractive Level<br />
1.0<br />
0.8<br />
0.6<br />
0.4<br />
0.2<br />
0.0<br />
-0.2<br />
07 08 09 10 11 12<br />
Source: <strong>BNP</strong> Paribas<br />
Rolldown to Vol Ratio<br />
7Y1Y<br />
8Y1Y<br />
Current Level: 0.7607<br />
9Y1Y<br />
10Y1Y<br />
Bulent Baygun 20 September 2012<br />
Market Mover<br />
22<br />
www.GlobalMarkets.bnpparibas.com
This section is classified as non-objective research<br />
What Are the Trades?<br />
With an eye towards finding the time frame that<br />
contains the largest amount of projected rate hikes, or<br />
the highest risk premium for rate hikes, we look at the<br />
term structure of 1yr rates on various forward dates.<br />
The biggest jump in 1yr rates is between years three<br />
and four, as shown in Chart 2. In other words, the 4y1y<br />
rate offers the best rolldown, at 60+ bp over one year,<br />
with the 5y1y coming in a close second. This area is the<br />
sweet spot for rolldown and suggests one of two<br />
strategies: 1) receive the 4y1y (or 5y1y) rate outright; or<br />
2) initiate a 3y1y/4y1y flattener (or a 4y1y/5y1y<br />
flattener). Note that the 1yr rolldown of the 4y1y is the<br />
entry level for the 3y1y/4y1y position, etc. However,<br />
keep in mind that despite the attractive rolldown, there<br />
is considerable directional risk in the former trade in the<br />
event that the market gets caught in a frenzied<br />
response to some positive developments. As for the<br />
curve trade, the entry level is not exactly very attractive<br />
in historical terms, and the rolldown of the 3y1y/4y1y<br />
flattener (i.e., the difference between the 1yr rolldown of<br />
the 4y1y and 3y1y positions) is a less-than-compelling<br />
15bp over one year and is negative for the 4y1y/5y1y<br />
flattener (see the second set of bars in Chart 2).<br />
On the other hand, the strong rolldown in the 4y1y and<br />
5y1y rates does suggest a compelling option trade using<br />
receivers. As vol is cheaper on the 4y1y, we will focus on<br />
that structure. Chart 3 shows that the vol-adjusted<br />
rolldown of the 4y1y structure is very attractive compared<br />
to where it has been in the past. Much more to the point,<br />
thanks to the strong rolldown, the 4y1y receiver<br />
appreciates in value as it ages, indicating that the<br />
rolldown effect outweighs the time decay. Therefore, one<br />
gets paid to stay in the position, even in the absence of<br />
any rally in the interim. In short, buy the 4y1y as a<br />
prudent way to express the view that too much Fed<br />
tightening has been priced in too soon in the 4 to 5yr<br />
sector. Table 1 shows the potential returns for the<br />
receiver over a one-year horizon under various rate<br />
scenarios.<br />
Chart 4: Has The Curve Steepened to an Extreme<br />
in the 8yr to 10yr Sector?<br />
40<br />
7<br />
(bp) 9y1y - 8y1y (LHS) (%)<br />
30<br />
20<br />
10<br />
0<br />
-10<br />
-20<br />
00 01 02 03 04 05 06 07 08 09 10 11 12<br />
Source: <strong>BNP</strong> Paribas<br />
Fed Fund Target<br />
Table 1: Rolldown Offsets Time Decay in the 4y1y<br />
Receiver (1yr Horizon)<br />
Change in<br />
Yields -25bp -15bp Unchanged 15bp 25bp<br />
Return 73% 56% 33% 12% -0.5%<br />
Source: <strong>BNP</strong> Paribas<br />
Last, if you notice in Chart 2, the 8y1y/9y1y flattener<br />
currently trading at about 20bp has very small negative<br />
rolldown as it ages over one year into a 7y1y/8y1y<br />
position. While the premise of a flattener so far out on<br />
the curve would not really be based on mispriced rate<br />
hike expectations, one thing that stands out is that, for<br />
some reason, this part of the curve is almost as steep<br />
as it was heading into and through the last tightening<br />
cycle (see Chart 4). Therefore, from a pure valuation<br />
perspective, we argue that being in the 8y1y/9y1y<br />
flattener offers a good risk/return proposition, giving<br />
low-cost exposure to a bull-flattening of the curve in<br />
case the growth outlook disappoints or Europe flares up<br />
again. This is not a trade that will make your year, but it<br />
could easily move 5-10bp in your favour without<br />
threatening much downside.<br />
6<br />
5<br />
4<br />
3<br />
2<br />
1<br />
0<br />
Bulent Baygun 20 September 2012<br />
Market Mover<br />
23<br />
www.GlobalMarkets.bnpparibas.com
This section is classified as non-objective research<br />
QE Impacts on Spread Sector Relative Value<br />
• Steep MBS demand from the Fed in the face<br />
of negative net MBS issuance has driven MBS<br />
to negative Treasury OASs. While we expect<br />
MBS to further outperform Treasuries, riskier<br />
asset classes, particularly corporate bonds,<br />
with their similar credit quality and liquidity, are<br />
likely to do even better.<br />
• A broad range of global debt investors who<br />
employ benchmarks will face asset shortages in<br />
the face of this QE-induced contraction in<br />
available investment grade assets. This is<br />
expected to provide technical support to US IG<br />
credit, despite low yields and historically full<br />
valuations, and will help to perpetuate the<br />
current strong demand for high-quality new<br />
issue paper. High yield and emerging markets<br />
credit also benefit from this dynamic.<br />
• This incremental demand from non-credit<br />
sectors combined with significant re-investment<br />
cash flows from the shrinkage of the large bank<br />
balance sheets is expected to drive relative<br />
outperformance of bank/finance bonds, quasisovereign/yankee<br />
securities and select BBB's<br />
over the next 6 months.<br />
MBS Rich as Demand Far Outstrips Supply<br />
Our economists expect QE3 MBS purchases to<br />
continue at the USD 40bn per month pace at least<br />
until year-end 2013, and possibly tapering into 2014.<br />
Including reinvestments of maturing agency debt in<br />
the Fed's portfolio into agency MBS, the net demand<br />
from the Fed would exceed USD 500bn over the next<br />
12 months. The issuance of the TBA deliverable<br />
bonds where Fed purchases have been concentrated<br />
was negative USD 172bn over the past 12 months,<br />
roughly a negative USD 14.3bn per month average.<br />
Thus, the Fed demand for MBS is particularly high in<br />
relation to the negative supply of the bonds that the<br />
Fed has traditionally purchased.<br />
This has driven MBS to very expensive levels (as<br />
seen in Chart 1). The chart, which shows the history<br />
of the current coupon + 50bp OAS vs the on-the-run<br />
Treasury curve, indicates that MBS have richened to<br />
a greater extent than during QE1. While this<br />
massive, initial tightening brought in some selling,<br />
MBS were back to outperforming Treasuries on<br />
Wednesday in the rally. Note that the current coupon<br />
is a theoretical par priced coupon that is traditionally<br />
used as a benchmark for valuation purposes.<br />
Chart 1: FNMA MBS Current Coupon + 50bp<br />
Treasury OAS – Treasury OAS Negative<br />
160<br />
(bp)<br />
140<br />
120<br />
100<br />
80<br />
60<br />
40<br />
20<br />
0<br />
-20<br />
QE1<br />
-40<br />
Dec-08 Sep-09 Jun-10 Mar-11 Dec-11 Sep-12<br />
Source: <strong>BNP</strong> Paribas<br />
Chart 2: BIG Credit Spread to Libor vs Current<br />
Coupon + 50bp Libor OAS – Corporates wide vs<br />
MBS<br />
500<br />
(bp)<br />
450<br />
400<br />
350<br />
300<br />
250<br />
200<br />
150<br />
100<br />
50<br />
QE1<br />
QE2<br />
0<br />
Jan-09 Jul-09 Jan-10 Jul-10 Jan-11 Jul-11 Jan-12 Jul-12<br />
Source: <strong>BNP</strong> Paribas<br />
Chart 3: Freddie Mac Portfolio Size vs<br />
Outstanding Debt – Debt Declined in Sympathy<br />
With the Portfolio Size<br />
1,050<br />
$ bn<br />
950<br />
850<br />
750<br />
650<br />
Portfolio<br />
Debt Outstanding<br />
550<br />
Aug-08 May-09 Feb-10 Nov-10 Aug-11 May-12<br />
Source: <strong>BNP</strong> Paribas<br />
Bulent Baygun / Anish Lohokare / Mark Howard 20 September 2012<br />
Market Mover<br />
24<br />
www.GlobalMarkets.bnpparibas.com
This section is classified as non-objective research<br />
Recently, however, as MBS yields have come off<br />
considerably, primary mortgage rates offered to<br />
borrowers have not declined as much. Thus,<br />
origination occurs mainly in the 3% coupon, with<br />
reasonable pricing available for the 2.5% coupon.<br />
With the current coupon calculated at 2.02% as of<br />
Wednesday close by Bloomberg and the lack of<br />
availability of market pricing for the 2% coupon, we<br />
consider current coupon + 50bp a better benchmark<br />
than the current coupon itself.<br />
Fed Purchases at the Expense of Money<br />
Managers and GSEs<br />
The Fed would effectively be buying from money<br />
managers who are overweight MBS and GSEs, who<br />
have been forced to reduce their portfolios. Rather<br />
than explicit sales of MBS, we mainly expect<br />
reinvestments of mortgage prepayments into other<br />
products. The latest Federal Reserve Z1 report<br />
shows that mutual funds hold about USD 1.36trn in<br />
agency debt and MBS; while the breakdown is not<br />
available, we expect the share of MBS to be much<br />
larger than debt akin to their relative sizes in the<br />
bond market (USD 5.6trn agency MBS vs USD 2.3trn<br />
agency debt). We estimate that money managers<br />
could experience USD 150bn to USD 200bn in<br />
prepayments that could be reinvested in other asset<br />
classes over the next 12 months.<br />
From a similar credit and liquidity perspective,<br />
investment-grade credit seems a very likely choice<br />
for the reinvestments. In Chart 2, we show the<br />
difference between the Citigroup Broad <strong>Investment</strong><br />
Grade Credit Index spread to libor and the current<br />
coupon mortgage Libor OAS. The chart shows the<br />
spread between corporate bonds and MBS has<br />
widened 25bp following the QE3 announcement.<br />
While the spread differential remains more than 40bp<br />
from its November 2011 wides, the level still appears<br />
attractive enough to effect a reallocation from MBS<br />
into corporate bonds. Notably, while mortgages are<br />
trading more than 10bp through their QE1 tights,<br />
corporate bonds in relation to MBS remain 70bp wide<br />
of the tights reached during QE1 and again during<br />
QE2. Note that we expect MBS to tighten further,<br />
albeit gradually, and outperform Treasuries. But,<br />
given the performance the product has already put in<br />
after the QE3 announcement, we think that riskier<br />
asset classes, particularly corporate bonds whose<br />
valuations have yet to reflect this incremental<br />
demand, are likely to do better going forward.<br />
A similar case was observed during QE1 when<br />
mortgages reached very tight levels and ran into a<br />
roadblock in May 2009 (Chart 1). Subsequent QE1<br />
MBS purchases fuelled mainly other asset classes.<br />
Chart 2 shows that during QE1, the spread of<br />
corporate bonds to MBS widened until early March<br />
2009, even as the MBS spread to Treasuries<br />
tightened during that time. But, as MBS purchases<br />
continued, further tightening in MBS was fairly<br />
incremental, but the spread of corporate bonds to<br />
MBS ground steadily tighter. Thus, while the first<br />
stage of QE1 was MBS tightening, the second stage<br />
involved the transmission of demand to other asset<br />
classes, leading corporate bonds to outperform MBS.<br />
Another factor, not directly related to QE3 but likely<br />
to help other asset classes, is the shrinkage of GSE<br />
portfolios. As the Treasury announced in August<br />
2012, GSE portfolios will now reduce at a 15% rate<br />
every year from a USD 650bn base as of 31<br />
December 2012, instead of the previous 10%. As<br />
Chart 3 shows, the decline in GSE portfolios has also<br />
caused a reduction in GSE debt outstanding that<br />
funds these portfolios. As the shrinkage of GSE debt<br />
outstanding accelerates, we estimate that USD 50bn<br />
to USD 200bn could be freed up over the next 12<br />
months to be reinvested in other asset classes.<br />
US Corporate Bonds are a Likely Beneficiary<br />
Although it is unlikely that all of these investments<br />
will migrate into credit over the next year, we expect<br />
these flows to drive incremental demand for US IG<br />
credit.<br />
The overall US corporate bond market is<br />
approximately USD 8trn, according to SIFMA, with<br />
USD 4.5trn par value outstanding for index eligible<br />
debt. Approximately USD 350bn of index-eligible<br />
corporate debt is expected to mature in 2013, and we<br />
estimate that an additional USD 275bn of non-index<br />
eligible debt will mature, as well. Some USD 250bn<br />
of par value of long-term index-eligible debt was<br />
removed from the market in 2012, likely due to calls<br />
or tenders. Factoring in new institutional credit<br />
inflows and other sources of demand, we estimate<br />
that mortgage investments could increase assets<br />
allocated to credit by at least 10-15% over the next<br />
12 months.<br />
The incremental demand for credit will flow into the<br />
primary and secondary markets. IG corporate<br />
issuance has topped USD 750bn year to date,<br />
despite the 14% decline in financial supply, and high<br />
yield issuance is a record USD 220bn-plus. Absent a<br />
material reversal in economic conditions, we believe<br />
that companies will continue to enthusiastically<br />
access the corporate bond market.<br />
Despite well-documented declines in dealer liquidity<br />
provision to corporate bonds, 2012 trading volumes<br />
(based on par value traded) have averaged USD<br />
17bn per day, or USD 4.25trn annually. For<br />
investment grade corporate bonds, which would be<br />
the most likely beneficiaries of a reallocation of<br />
funds, we estimate that 2012 annual trading volume<br />
will approach USD 3trn. The mortgage flows would<br />
Bulent Baygun / Anish Lohokare / Mark Howard 20 September 2012<br />
Market Mover<br />
25<br />
www.GlobalMarkets.bnpparibas.com
This section is classified as non-objective research<br />
add an incremental 5-7% to trading volumes (if<br />
executed entirely in the secondary market),<br />
equivalent to the gain in trading activity from 2010 to<br />
2012.<br />
What does this mean for credit valuations?<br />
a) By either metric, the strong technical demand for<br />
cash credit is likely to continue, particularly for<br />
investment grade, despite low yields and historically<br />
full valuations. However, difficulty sourcing bonds will<br />
become even more acute, exacerbating the current<br />
“illiquidity” conditions.<br />
b) Benchmarked investors will likely be constrained<br />
in their attempts to reach down into high yield, due to<br />
tracking error concerns. For these investors,<br />
financials, Yankee corporate bonds and split-rated<br />
triple Bs will be likely asset considerations.<br />
c) As risk premiums compress, we believe that the<br />
crowding-out effect will affect other, less constrained<br />
credit investors, for whom the reach for yield will<br />
push them into the double/single B territory and into<br />
emerging market bonds.<br />
d) A robust primary calendar should be well<br />
absorbed, generally speaking. Although manageable<br />
to date, we are concerned that a prolonged period of<br />
“easy money” could lead to a higher degree of<br />
shareholder-friendly actions, as well as diminished<br />
collateral quality and loosening covenants down the<br />
road.<br />
Bulent Baygun / Anish Lohokare / Mark Howard 20 September 2012<br />
Market Mover<br />
26<br />
www.GlobalMarkets.bnpparibas.com
This section is classified as non-objective research<br />
EUR: Liquidity Spread Compression at an End<br />
• The recent decisions taken by the world’s<br />
major central banks, many of them expected,<br />
have eased volatility. Liquidity is benefiting in<br />
this environment and spreads have tightened<br />
significantly.<br />
• At current levels, as the good news is<br />
behind us and adverse events potentially lie<br />
ahead, we think we could see limited spread rewidening<br />
in the coming weeks.<br />
• Strategy: Paying interest on spreads makes<br />
sense now.<br />
Chart 1: Less Stress Helping to Tighten Spreads<br />
Central banks have further eased stress<br />
The decision by the ECB to announce its OMT bondbuying<br />
programme was, for the most part, expected.<br />
However, some of the elements it announced, such as<br />
the potentially unlimited scale of the purchases and the<br />
bank’s waiver of seniority, were very well received. The<br />
moves highlighted the commitment of the ECB to do<br />
whatever is necessary to safeguard eurozone<br />
sovereign debt eligible for OMT buying. The<br />
combination of potential ESM buying in the primary<br />
markets and the ECB’s intervention in the secondary<br />
markets will, without doubt, improve liquidity conditions.<br />
The Fed’s decision to launch open-ended QE, in<br />
addition to pursuing Operation Twist, paved the way<br />
for additional liquidity extension in the US.<br />
The main impact of these decisions has been a sharp<br />
decline in volatility and signs of liquidity improvement.<br />
As a result, risk appetite has rebounded strongly,<br />
offering support to equities, commodities, and weighing<br />
temporarily on safe havens. As liquidity conditions are<br />
set to improve, liquidity-driven spreads have<br />
compressed significantly. This is evident in the money<br />
markets (OIS/BOR spreads at lows) and bond markets<br />
(cheapening of benchmark paper in ASW terms).<br />
Back to reality<br />
The spread compression as a result of this latest<br />
monetary action has been sizeable, but the moves<br />
have now been priced in and their impact is likely to<br />
fade near term. The fundamental backdrop is set to<br />
be a key market driver in coming weeks. Very weak<br />
economic data in the eurozone are likely to be a<br />
trigger for significant market reaction – and this<br />
favours risk-averse behaviour. In this context, we see<br />
room for a further decline in yields on benchmark<br />
paper, as their safe-haven status is likely to attract<br />
Source: <strong>BNP</strong> Paribas<br />
flows. We expect the 10y Bund to rally from 1.70% to<br />
1.58% in the week ahead and we could see a<br />
rebound to closer to 1.40%. This will go hand-in-hand<br />
with a flatter benchmark curve and wider spreads.<br />
Upcoming adverse events<br />
In addition to the economic background, several<br />
upcoming events are expected to fuel upward pressure<br />
in the gamma space. Budget presentations and<br />
warnings or negative moves by the ratings agencies on<br />
sovereign debt are among the many factors that could<br />
weigh on risk appetite. Political developments may add<br />
to this bias. Local elections in Spain, in particular, are<br />
likely to be a cause of volatility.<br />
With volatility rising, liquidity conditions are exposed<br />
to deterioration. As a result, we see scope for wider<br />
spreads where they are linked to liquidity conditions.<br />
This is the case for ASW spreads, second-tier core<br />
spreads versus benchmarks and OIS/BOR spreads.<br />
When it comes to ASW spreads, we see room for the<br />
10y Bund to richen in ASW terms, from 22bp at the<br />
moment to the 30bp area. As far as second-tier core<br />
markets are concerned, the 5y area has richened<br />
significantly over the last couple of weeks. We see<br />
some risk of a setback in this area.<br />
OIS/BOR spreads, meanwhile, are now back to precrisis<br />
levels. This looks overdone, and we see scope<br />
for corrective re-widening.<br />
Strategy: Sell the 10y Bund/swap spread at -22bp,<br />
with a target of -30bp. Buy the 5y OBL vs. France,<br />
Austria and Belgium. Pay OIS/BOR spreads at 15bp,<br />
with a target of 18-20bp.<br />
Patrick Jacq 20 September 2012<br />
Market Mover<br />
27<br />
www.GlobalMarkets.bnpparibas.com
EMU Debt Monitor: Trade Ideas<br />
This section is classified as non-objective research<br />
• We are maintaining our long-duration Bund<br />
call at 1.65-1.70%. The 10y Bund ASW is a<br />
buying opportunity in the -20/-22 area.<br />
• As regards non-core CDS, the sharp decline<br />
in the short end provides long CDS basis trade<br />
opportunities in 1y Italy and Spain.<br />
• The 10y Bono/BTP re-widened as we<br />
expected last week and has come back in the<br />
last few days. At current levels, we prefer 1y-2y<br />
compression trades in Spain vs. Italy.<br />
Chart 1: Rising Net Buying Flows in Bunds<br />
No change in our long-duration Bund call<br />
The Fed’s decision to embark on open-ended QE<br />
triggered a rally in risky assets and a return to the<br />
upper side of the 1.65/1.70% range for Bunds, a level<br />
that has been rapidly rejected to date.<br />
We do not see any reason to change our near-term<br />
call to increase duration in 10y Bunds in the<br />
1.65/1.70% area after the Fed meeting. The Fed’s<br />
commitment to keep rate at exceptionally low levels<br />
until at least mid-2015 underpins to some extent our<br />
scenario of a lasting ECB zero interest-rate policy<br />
(ZIRP), as we expect both GDP growth and inflation<br />
to be lower in the eurozone than in the US.<br />
Last week, we noted three near-term supportive<br />
factors for Bunds: their cheap valuation due to a low<br />
flight-to-quality premium of around 10bp for a yield of<br />
1.70%, a negative net core/semi-core supply through<br />
year end (compared with sizeable net positive supply<br />
in late 2011 and 2010) and rising demand from Asian<br />
investors above 1.60% (Chart 1). In addition, the<br />
relative valuation of 10y-30y Bunds to swaps has<br />
also reached very cheap levels (see our desknote<br />
published on 18 September, entitled 10y Bund ASW:<br />
buying opportunity in the -20/-22 area). This<br />
cheapness could herald a near-term decline in 10y<br />
Bund yields towards 1.40% over the coming weeks.<br />
Non-core CDS opportunities<br />
In mid-August, we underlined the extreme steepness<br />
of the short end of the Italian CDS curve, which<br />
implied a very high 1y1y forward CDS level – above<br />
the 5y spot – and recommended selling it (at that<br />
time, it was around 440/445). As Chart 2 shows, the<br />
decline has been much more pronounced than we<br />
expected, both in spot and the 1y1y forward CDS (-<br />
190 vs. -90bp estimated). While non-core cash<br />
outperformed CDS in August, the move has now fully<br />
reversed. Another indicator of the excessive decline<br />
Source: <strong>BNP</strong> Paribas<br />
Chart 2: 1y1y CDS Has Collapsed Over the Past<br />
Month<br />
700<br />
600<br />
500<br />
400<br />
300<br />
200<br />
Launch of<br />
SMP 2.0<br />
ECB 3y LTRO Ann.<br />
100<br />
2nd ECB 3y LTRO<br />
0<br />
May-10 Feb-11 Nov-11 Aug-12<br />
-190bp<br />
since<br />
Mid-Aug<br />
1y Italy CDS 1y1y Italy CDS 1y Spain CDS 1y1y Spain CDS<br />
Source: <strong>BNP</strong> Paribas<br />
200<br />
150<br />
100<br />
50<br />
0<br />
Chart 3: 1y and 2y Italy CDS Basis: CDS Has<br />
Outperformed Cash Since Sep ECB Meeting<br />
cash rich<br />
ECB Aug<br />
Meeting<br />
ECB Sep Meeting<br />
-50<br />
June EU<br />
Summit<br />
Draghi's +<br />
cash cheap<br />
comment<br />
-100<br />
Mar-12 Apr-12 Apr-12 May-12 Jun-12 Jul-12 Jul-12 Aug-12 Sep-12<br />
1y CDS basis<br />
2y CDS basis<br />
Source: <strong>BNP</strong> Paribas<br />
in short-dated CDS, both in Italy and Spain, is the<br />
decoupling of the cash and country CDS. Indeed, 1y-<br />
2y BTPs and Bonos have been fairly stable versus<br />
swaps, while 1y and 2y CDS have kept on declining<br />
in the past couple of weeks. This temporary break in<br />
Eric Oynoyan / Ioannis Sokos 20 September 2012<br />
Market Mover<br />
28<br />
www.GlobalMarkets.bnpparibas.com
This section is classified as non-objective research<br />
correlation since the September ECB meeting has<br />
pushed the 1y and 2y non-core CDS basis below<br />
their late July lows, even though the ECB has<br />
committed to an unlimited amount of 1y-3y paper<br />
once a country asks for EFSF/ESM assistance.<br />
In trading terms, the safest option is to buy shortdated<br />
BTPs, such as BTP Nov 13, and 1y Italy<br />
CDS, at around -15/20bp, with a view to a 50bp<br />
outperformance of the cash, or Bono Oct 13 and<br />
1y Spain CDS for a basis level of around -75bp.<br />
Peripheral cash curves<br />
Last week, we suggested a 10y Bono/BTP widener<br />
on the grounds that the 10y point has outperformed<br />
on the Spanish curve and the spread to Italy has<br />
returned to the bottom of its recent range. The<br />
spread widened from 60bp last week to 95bp on<br />
Monday and since then, it has come back down to<br />
85bp. The current level is in the middle of the recent<br />
range and cannot be considered attractive, either for<br />
wider or tighter spreads.<br />
In fact, what we find interesting is the widening of the<br />
short-end spreads between Spain and Italy. The<br />
SPGB Oct-13 vs. BTP Nov-13 (115bp) and SPGB<br />
Apr-14 vs. BTP Apr-14 (110bp) are wider than the<br />
longer-dated spreads on the 2014-15 maturities. This<br />
can be seen in Chart 5. As Spain is expected to<br />
make an official request for financial aid before Italy,<br />
thus becoming OMT eligible, we would expect the<br />
short-end spreads between Spain and Italy to be<br />
tighter than the longer-dated ones.<br />
Even considering that these bonds will soon fall out<br />
of the OMT purchasing basket (1y-3y), this does not<br />
justify spreads of more than 100bp for such shortdated<br />
time horizons. Let’s not forget that political<br />
concern about Italy will intensify as we approach the<br />
Italian elections in 2013. And as we no longer find<br />
10y spreads at these entry levels attractive, we<br />
prefer positioning ourselves for a compression in the<br />
Apr-14 spread between Bonos and BTPs. The<br />
spread is currently at 110bp and we are targeting a<br />
return to 80bp.<br />
The move in the CDS basis, shown in Chart 3, also<br />
favours tighter cash spreads at the short end. Under<br />
such a scenario, Spain is expected to outperform<br />
versus Italy based on its higher beta and its tendency<br />
to outperform in rallies and underperform in sell-offs.<br />
The Spanish auction on Thursday went well, and the<br />
size was above the pre-announced range. The<br />
supply rollercoaster continues with Italy in the week<br />
ahead, and this could work in favour of the<br />
compression trade at the short end of the curve.<br />
Chart 4: 1y and 2y Spain Basis: Inversion Move<br />
Back to Late July Lows<br />
300<br />
250<br />
200<br />
150<br />
100<br />
50<br />
0<br />
-50<br />
June EU<br />
Summit<br />
-100<br />
Draghi's +<br />
cash cheap<br />
comment<br />
-150<br />
Mar-12 Apr-12 Apr-12 May-12 Jun-12 Jul-12 Jul-12 Aug-12 Sep-12<br />
1y CDS basis<br />
Source: <strong>BNP</strong> Paribas<br />
140<br />
120<br />
100<br />
80<br />
60<br />
40<br />
20<br />
cash rich<br />
ECB Aug<br />
Meeting<br />
2y CDS basis<br />
ECB Sep Meeting<br />
Chart 5: Spanish/Italian Yield Spreads<br />
10-2013 4-2014 10-2014 4-2015 7-2015<br />
0<br />
01-Aug 08-Aug 15-Aug 22-Aug 29-Aug 05-Sep 12-Sep 19-Sep<br />
Source: <strong>BNP</strong> Paribas<br />
250<br />
200<br />
150<br />
100<br />
50<br />
0<br />
10-2013<br />
Chart 6: Spanish/Italian Spreads – 3m<br />
Candlestick<br />
Bono/BTP Spreads in Yield - 3m Range vs Current Spread<br />
4-2014<br />
10-2014<br />
Source: <strong>BNP</strong> Paribas<br />
4-2015<br />
7-2015<br />
4-2016<br />
10-2016<br />
7-2017<br />
7-2018<br />
10-2019<br />
10-2020<br />
4-2021<br />
1-2022<br />
Eric Oynoyan / Ioannis Sokos 20 September 2012<br />
Market Mover<br />
29<br />
www.GlobalMarkets.bnpparibas.com
This section is classified as non-objective research<br />
JGBs: Increase in Issuance Unavoidable<br />
• The MOF is planning to issue some<br />
JPY 119.9trn in refunding bonds in FY2013. The<br />
final figure will, of course, depend on the yet-tobe-drafted<br />
FY2013 budget, but an increase in<br />
JGB issuance appears unavoidable.<br />
Refunding bond issuance to rise to JPY 119.9trn<br />
FY2013 JGB issuance looks likely to be around<br />
JPY 7.5trn higher than in the initial FY2012 budget<br />
after counting JPY 119.9trn in refunding bonds as<br />
well as the need to refinance previously issued<br />
reconstruction bonds. Assumptions may need to be<br />
entirely rethought in the event of a general election,<br />
but, for the time being, let us assume JPY 44trn in<br />
new financial resource bonds (the maximum<br />
permitted under the government's self-imposed<br />
medium-term fiscal framework), JPY 2trn in<br />
reconstruction bond issuance (reflecting plans to<br />
spend JPY 19trn over five years), and JPY 15trn in<br />
FILP (fiscal investment and loan programme) bond<br />
issuance (unchanged from the initial FY2012 budget).<br />
With the government also needing to find an<br />
additional JPY 2.6trn to fund its contributions to the<br />
basic pension scheme (which were not counted in<br />
the initial FY2012 budget), total JGB issuance for<br />
FY2013 appears set to rise by around JPY 9.3trn to<br />
JPY 183.5trn.<br />
Calendar base market issuance (supply at scheduled<br />
auctions from April through March) will not<br />
necessarily need to be hiked by this entire amount,<br />
however. Given that redemptions of special pension<br />
bonds are to be funded from consumption tax<br />
revenues, the government would be permitted to<br />
deplete its frontloaded issuance of refunding bonds<br />
for the purpose of covering its contributions. Similar<br />
measures are likely to be taken during the current<br />
fiscal year and while the uptake of the non-price<br />
competitive auction II is down slightly from the<br />
comparable period of FY2011 at around JPY 3.4trn<br />
through September, it is on track to exceed the<br />
initially budgeted issuance level (JPY 4.185trn) by<br />
around JPY 2.6trn.<br />
The JPY 119.9trn figure for refunding bond issuance<br />
assumes that FY2013 buybacks will be unchanged<br />
from FY2012 at around JPY 3trn. The MOF<br />
explained that this would be funded by a JPY 0.3trn<br />
transfer from the FILP, JPY 2.2trn from the<br />
government debt consolidation fund and JPY 0.5trn<br />
in refunding bond issuance. Buybacks of 10y<br />
inflation-indexed JGBs have already been cut back in<br />
Table 1: JGB Issuance Size (JPY trn)<br />
FY2012<br />
Initial<br />
FY2013<br />
Forecast<br />
Chg<br />
Breakdown by regal grounds<br />
New financial resource bonds 44.2 44.0 -0.2<br />
Refunding bonds 112.3 119.9 7.6<br />
FILP bonds 15.0 15.0 0.0<br />
Reconstruction bonds 2.7 2.0 -0.7<br />
Special bonds 0.0 2.6 2.6<br />
Total 174.2 183.5 9.3<br />
Source: MoF, <strong>BNP</strong> Paribas<br />
1.4<br />
1.2<br />
1.0<br />
0.8<br />
0.6<br />
0.4<br />
0.2<br />
0.0<br />
Chart 1: Results of Non-Price Competitive<br />
Auction II (JPY trn)<br />
Apr May Jun Jul Aug Sep Oct Nov Dec Jan Feb Mar<br />
Source: MoF, <strong>BNP</strong> Paribas<br />
2y 5y 10y<br />
20y 30y 40y<br />
line with shrinking outstanding issuance and, with a<br />
similar reduction likely for 15y floating-rate JGBs<br />
ahead, it should be possible for the MOF to cut its<br />
total buybacks by around JPY 0.5trn and thereby<br />
obviate the need for refunding bond issuance.<br />
Frontloaded issuance of refunding bonds can also be<br />
depleted. However, projections published by the<br />
MOF in January of this year point to a further<br />
JPY 7trn increase in refunding bond issuance for<br />
FY2014. Revenues are set to increase by around<br />
JPY 6trn after the consumption tax is hiked from 5%<br />
to 8% in April 2014, but with some of these funds<br />
likely to be used for economic stimulus measures, we<br />
believe that the MOF will ultimately have little option<br />
but to increase FY2013 issuance with a view to<br />
preserving a buffer for future depletion. Therefore,<br />
we expect monthly issuance to be hiked by around<br />
JPY 100bn each for two maturities.<br />
A combination of shorter-dated and long-term<br />
issuance<br />
Assuming that the current pace of rinban outright<br />
purchase operations is maintained, the BoJ rollover<br />
is set to fall from JPY 16.7trn in FY2012 to around<br />
JPY 15trn in FY2013. These figures do not include<br />
asset purchase programme (APP) holdings, and the<br />
Tomohisa Fujiki 20 September 2012<br />
Market Mover<br />
30<br />
www.GlobalMarkets.bnpparibas.com
This section is classified as non-objective research<br />
decline can be at least partially attributed to a<br />
lengthening of the average maturity of rinban<br />
purchases stemming from the APP's concentration<br />
on the short end of the curve. However, with the<br />
BoJ's +1% "price stability goal" still looking to be well<br />
out of reach, we would expect APP holdings to be<br />
maintained at a high level even after the initial<br />
purchase targets are met, thereby creating a need for<br />
the MOF to issue JGBs to market investors.<br />
This could provide theoretical justification for hiking<br />
issuance of 2y JGBs. However, doing so would run<br />
counter to the MOF's goal of lengthening the average<br />
maturity of its debt. Hence, we expect to see an<br />
increase in 5y issuance aimed at reducing<br />
refinancing risk.<br />
Turning our attention to the super-long sector, it is<br />
worth noting that 30y and 40y issuance amounts<br />
have been unchanged since FY2011. Minutes of<br />
previous Meetings of JGB Market Special<br />
Participants indicate that the MOF has considered<br />
altering its auction frequencies in the event that<br />
higher issuance becomes necessary. We expect that<br />
the possibility of larger 30y or 40y offerings for<br />
FY2013 will be discussed at least to some extent, but<br />
with these sectors having performed relatively poorly<br />
so far in FY2012, issuance amounts are ultimately<br />
likely to be left on hold. The 20y sector has also<br />
underperformed the 10y sector quite significantly<br />
since monthly issuance was hiked (from JPY 1.1trn<br />
to JPY 1.2trn) in April, which suggests that the<br />
potential market impact of hiking super-long issuance<br />
might be too great to justify the increase in the<br />
average debt maturity.<br />
The government may therefore be left with little<br />
option but to increase issuance in the 10y sector,<br />
which should cause few (if any) problems for market<br />
0<br />
-5<br />
-10<br />
-15<br />
-20<br />
-25<br />
Chart 2: Yield Curve<br />
0 5 10 15 20 25 30 35 40<br />
Source: <strong>BNP</strong> Paribas<br />
Change (LH S, bp) 3/30/2012 (RH S, % )<br />
9/14/2012 (RH S, % )<br />
Table 2: JGB Issuance Size (JPY trn)<br />
FY2012<br />
Initial<br />
FY2013<br />
Forecast<br />
Chg<br />
Breakdown by JGB types<br />
40yr 1.6 1.6 0.0<br />
30yr 5.6 5.6 0.0<br />
20yr 14.4 14.4 0.0<br />
15yr floater 0.0 0.0 0.0<br />
10yr 27.6 28.8 1.2<br />
10yr Linker 0.0 0.0 0.0<br />
5yr 30.0 30.0 0.0<br />
2yr 32.4 33.6 1.2<br />
T-bill 30.9 30.9 0.0<br />
Enhanced Liquidity 7.2 7.2 0.0<br />
Calendar base 149.7 152.1 2.4<br />
Source: MoF, <strong>BNP</strong> Paribas<br />
digestion and will enable a modest lengthening of the<br />
average maturity. 10y issuance was also hiked (from<br />
JPY 2.2trn to JPY 2.3trn per month) from April of this<br />
year, but this did not have any discernible impact on<br />
pricing. The MOF might also wish to consider altering<br />
the maturities offered at auctions for enhanced<br />
liquidity as a means of issuing super-long JGBs<br />
without causing too much market disruption.<br />
2.5<br />
2.0<br />
1.5<br />
1.0<br />
0.5<br />
0.0<br />
Tomohisa Fujiki 20 September 2012<br />
Market Mover<br />
31<br />
www.GlobalMarkets.bnpparibas.com
Global Inflation Watch<br />
First Flash Estimates for Sept. Out Next Week<br />
Chart 1: Oil and Energy Price Forecasts<br />
The key releases of the week will come from the<br />
eurozone, where several national statistics offices will<br />
release flash estimates of September HICP and CPI<br />
inflation. The eurozone flash HICP is out next Friday.<br />
We saw a jump in headline rates across the<br />
eurozone in August, as the lagged effects of oil price<br />
rises fed through to fuel price indices and boosted<br />
headline inflation rates. Although further upward price<br />
pressure from energy is unlikely this month, price<br />
falls are also unlikely, so annual energy inflation<br />
should be flat on the month for much of the region.<br />
Our forecast for oil prices assumes little movement in<br />
either direction over the remainder of the year. This<br />
should mean that energy inflation in the eurozone<br />
continues to moderate. In the first quarter of 2013,<br />
we should see the pace of moderation pick up on<br />
base effects. Our current forecast suggests that by<br />
April 2013, energy price inflation in the eurozone will<br />
have fallen to 3% y/y (Chart 1).<br />
In terms of core price inflation in September, Italy and<br />
Spain will be mirror images of each other (Chart 2), as<br />
Italy’s 1pp VAT increase of last year washes out of the<br />
annual inflation rates and Spain’s new, higher VAT<br />
rates become effective. Spain’s VAT increase of 3pp<br />
on the standard rate (from 18% to 21%) is much larger<br />
than Italy’s increase last year (from 20% to 21%), so<br />
the boost to the Spanish indices this month should<br />
dwarf the falls in Italian inflation. However, at the<br />
eurozone level, Spain is a smaller fraction of the<br />
eurozone aggregate than Italy, so these tax effects<br />
should broadly offset each other at the eurozone level.<br />
The squeeze on the Spanish consumer is set to<br />
continue: the Spanish government announced this<br />
week that electricity tariffs would rise 10% from<br />
January 2013. We think this will add 0.5pp to energy<br />
price inflation in Spain in January, equivalent to<br />
0.06pp on headline HICP inflation. The impact on<br />
eurozone headline inflation will be minimal.<br />
The preliminary estimate of Belgian inflation in<br />
September will also be released next week. In a sign<br />
that weak domestic demand is depressing prices, car<br />
manufacturers have recently been offering heavy<br />
discounts. We think core inflation as a whole will<br />
moderate this month, contributing to a moderation in<br />
the headline rate from 2.9% y/y to 2.6%.<br />
Source: Reuters EcoWin Pro, <strong>BNP</strong> Paribas<br />
Chart 2: Core Inflation in Italy and Spain<br />
Source: Reuters EcoWin Pro, <strong>BNP</strong> Paribas<br />
Source: Reuters EcoWin Pro<br />
Chart 3: Inflation in Belgium<br />
Catherine Colebrook 20 September 2012<br />
Market Mover<br />
32<br />
www.GlobalMarkets.bnpparibas.com
Table 1: <strong>BNP</strong> Paribas' Inflation Forecasts<br />
Eurozone<br />
France<br />
US<br />
Headline HICP<br />
Ex-tobacco HICP<br />
Headline CPI<br />
Ex-tobacco CPI<br />
CPI Urban SA<br />
CPI Urban NSA<br />
Index % m/m % y/y Index % m/m % y/y Index % m/m % y/y index % m/m % y/y Index % m/m % y/y Index % m/m % y/y<br />
2010 109.8 - 1.6 109.5 - 1.5 121.1 - 1.5 119.8 - 1.5 218.1 - 1.6 218.1 - 1.6<br />
2011 112.8 - 2.7 112.4 - 2.7 123.7 - 2.1 122.2 - 2.1 224.9 - 3.1 224.9 - 3.2<br />
2012 (1) 115.7 - 2.5 115.2 - 2.5 126.3 - 2.1 124.7 - 2.0 229.7 - 2.1 229.7 - 2.1<br />
Q1 2011 111.3 - 2.5 110.9 - 2.4 122.5 - 1.8 121.0 - 1.7 222.1 - 2.1 221.7 - 2.1<br />
Q2 2011 113.1 - 2.8 112.7 - 2.7 123.9 - 2.1 122.4 - 2.0 224.5 - 3.3 225.5 - 3.4<br />
Q1 2012 114.3 - 2.7 113.8 - 2.6 125.3 - 2.3 123.8 - 2.2 228.3 - 2.8 227.9 - 2.8<br />
Q2 2012 115.9 - 2.5 115.4 - 2.4 126.3 - 2.0 124.8 - 1.9 228.8 - 1.9 229.8 - 1.9<br />
Q3 2012 (1) 115.7 - 2.5 115.2 - 2.5 126.3 - 2.0 124.7 - 1.9 230.0 - 1.7 230.2 - 1.7<br />
Q4 2012 (1) 116.9 - 2.5 116.4 - 2.4 127.1 - 2.0 125.4 - 1.9 231.7 - 2.1 230.9 - 2.1<br />
Q1 2013 (1) 116.7 - 2.1 116.2 - 2.0 127.7 - 1.9 125.9 - 1.7 233.0 - 2.0 232.6 - 2.0<br />
Q2 2013 (1) 118.0 - 1.9 117.5 - 1.8 128.6 - 1.8 126.8 - 1.6 234.2 - 2.4 235.2 - 2.4<br />
Jan-12 113.4 -0.8 2.7 112.96 -0.8 2.6 124.7 -0.4 2.3 123.06 -0.4 2.3 227.5 0.2 2.9 226.67 0.4 2.9<br />
Feb-12 114.0 0.5 2.7 113.53 0.5 2.7 125.2 0.4 2.3 123.58 0.4 2.2 228.4 0.4 2.9 227.66 0.4 2.9<br />
Mar-12 115.5 1.3 2.7 115.03 1.3 2.6 126.2 0.8 2.3 124.63 0.8 2.2 229.1 0.3 2.6 229.39 0.8 2.7<br />
Apr-12 116.0 0.5 2.6 115.56 0.5 2.5 126.4 0.1 2.1 124.80 0.1 2.0 229.2 0.0 2.3 230.09 0.3 2.3<br />
May-12 115.9 -0.1 2.4 115.38 -0.2 2.3 126.3 -0.1 2.0 124.73 -0.1 1.9 228.5 -0.3 1.7 229.82 -0.1 1.7<br />
Jun-12 115.8 -0.1 2.4 115.29 -0.1 2.3 126.4 0.0 1.9 124.78 0.0 1.9 228.6 0.0 1.7 229.48 -0.1 1.7<br />
Jul-12 115.1 -0.5 2.4 114.65 -0.6 2.3 125.8 -0.4 1.9 124.22 -0.4 1.9 228.7 0.0 1.4 229.10 -0.2 1.4<br />
Aug-12 115.6 0.4 2.6 115.10 0.4 2.5 126.6 0.7 2.1 125.06 0.7 2.0 230.1 0.6 1.7 230.38 0.6 1.7<br />
Sep 12 (1) 116.4 0.7 2.6 115.93 0.7 2.5 126.4 -0.2 2.0 124.86 -0.2 1.9 231.2 0.5 1.9 231.17 0.3 1.9<br />
Oct 12 (1) 116.8 0.3 2.5 116.27 0.3 2.5 126.9 0.3 2.1 125.16 0.2 2.0 231.3 0.0 2.0 230.86 -0.1 2.0<br />
Nov 12 (1) 116.7 0.0 2.4 116.24 0.0 2.4 127.0 0.1 1.9 125.30 0.1 1.9 231.8 0.2 2.1 231.01 0.1 2.1<br />
Dec 12 (1) 117.1 0.3 2.4 116.60 0.3 2.4 127.5 0.4 1.9 125.82 0.4 1.9 232.2 0.2 2.3 230.77 -0.1 2.3<br />
Jan 13 (1) 116.0 -1.0 2.3 115.44 -1.0 2.2 127.1 -0.3 2.0 125.28 -0.4 1.8 232.6 0.2 2.2 231.72 0.4 2.2<br />
Feb 13 (1) 116.5 0.4 2.2 115.91 0.4 2.1 127.7 0.5 2.0 125.91 0.5 1.9 233.0 0.2 2.0 232.23 0.2 2.0<br />
Mar 13 (1) 117.7 1.0 1.9 117.13 1.1 1.8 128.3 0.5 1.7 126.52 0.5 1.5 233.4 0.2 1.9 233.74 0.7 1.9<br />
Apr 13 (1) 117.9 0.2 1.6 117.38 0.2 1.6 128.5 0.2 1.7 126.72 0.2 1.5 233.8 0.2 2.0 234.74 0.4 2.0<br />
May 13 (1) 118.0 0.1 1.9 117.47 0.1 1.8 128.6 0.1 1.8 126.82 0.1 1.7 234.2 0.2 2.5 235.52 0.3 2.5<br />
Jun 13 (1) 118.2 0.1 2.1 117.62 0.1 2.0 128.6 0.0 1.8 126.81 0.0 1.6 234.6 0.1 2.6 235.43 0.0 2.6<br />
Updated<br />
Next<br />
Release<br />
Sep 14<br />
September Flash (Sep 28)<br />
Sep 12<br />
September CPI (Oct 11)<br />
Sep 14<br />
September CPI (Oct 16)<br />
Source: <strong>BNP</strong> Paribas, (1) Forecasts<br />
4.5<br />
4.0<br />
3.5<br />
3.0<br />
2.5<br />
2.0<br />
1.5<br />
1.0<br />
0.5<br />
0.0<br />
-0.5<br />
Chart 4: Eurozone HICP (% y/y)<br />
-1.0<br />
98 99 00 01 02 03 04 05 06 07 08 09 10 11 12<br />
Source: Reuters EcoWin Pro<br />
Core HICP<br />
Headline HICP<br />
Inflation ticked up to 2.6% y/y in August, largely on the back of<br />
energy prices. We expect only a slight moderation over the rest of<br />
this year, while base effects from energy should mean the annual<br />
rate falls more swiftly in early 2013. Core price pressures remain<br />
subdued, with indirect taxes the only significant source of upward<br />
pressure.<br />
6<br />
5<br />
4<br />
3<br />
2<br />
1<br />
0<br />
-1<br />
-2<br />
Chart 5: US CPI<br />
CPI % y/y - Contribution to Inflation<br />
Energy<br />
Food<br />
Core (ex-food & energy)<br />
-3<br />
Jan May Sep Jan May Sep Jan May Sep Jan May Sep Jan May<br />
08 09 10 11 12<br />
Source: Reuters EcoWin Pro<br />
Headline inflation picked up in August, accelerating to 1.7% y/y as<br />
previously favourable base effects from energy dissipated, though<br />
core inflation continued to moderate. We expect continued core<br />
price moderation in the coming months.<br />
Catherine Colebrook 20 September 2012<br />
Market Mover<br />
33<br />
www.GlobalMarkets.bnpparibas.com
Table 2: <strong>BNP</strong> Paribas' Inflation Forecasts<br />
Japan<br />
UK<br />
Sweden<br />
Core CPI SA<br />
Core CPI NSA<br />
Headline CPI<br />
RPI<br />
CPI<br />
CPIF<br />
Index % m/m % y/y Index % m/m % y/y Index % m/m % y/y Index % m/m % y/y Index % m/m % y/y Index % m/m % y/y<br />
2010 100.0 - -1.0 100.0 - -1.0 114.5 - 3.3 223.6 - 4.6 302.5 - 1.2 194.6 - 2.0<br />
2011 99.8 - -0.3 99.8 - -0.3 119.6 - 4.5 235.2 - 5.2 311.4 - 3.0 197.3 - 1.4<br />
2012 (1) 99.8 - 0.0 99.8 - 0.0 122.9 - 2.8 242.6 - 3.2 314.9 - 1.1 199.5 - 1.1<br />
Q3 2011 99.8 - 0.2 99.9 - 0.2 120.1 - 4.7 236.2 - 5.2 311.9 - 3.3 197.2 - 1.6<br />
Q4 2011 99.6 - -0.2 99.7 - -0.2 121.3 - 4.6 238.6 - 5.1 314.1 - 2.7 198.2 - 0.9<br />
Q1 2012 99.9 - 0.1 99.6 - 0.1 121.7 - 3.5 239.6 - 3.7 313.5 - 1.8 198.1 - 1.0<br />
Q2 2012 99.8 - 0.0 99.9 - 0.0 122.7 - 2.8 242.2 - 3.1 315.1 - 1.1 199.4 - 1.0<br />
Q3 2012 (1) 99.6 - -0.2 99.7 - -0.2 123.0 - 2.4 243.1 - 2.9 314.0 - 0.7 199.2 - 1.0<br />
Q4 2012 (1) 99.8 - 0.2 99.9 - 0.2 124.2 - 2.5 245.6 - 2.9 317.0 - 0.9 201.2 - 1.5<br />
Q1 2013 (1) 99.9 - 0.0 99.6 - 0.0 124.7 - 2.4 247.1 - 3.1 316.7 - 1.0 201.5 - 1.7<br />
Q2 2013 (1) 99.9 - 0.1 100.0 - 0.1 125.8 - 2.6 250.2 - 3.3 318.4 - 1.1 202.9 - 1.7<br />
Jan-12 99.7 0.1 -0.1 99.3 -0.3 -0.1 121.1 -0.5 3.6 238.0 -0.6 3.9 311.9 -0.9 1.9 196.9 -0.7 0.9<br />
Feb-12 99.9 0.2 0.1 99.5 0.2 0.1 121.8 0.6 3.4 239.9 0.8 3.7 313.9 0.7 1.9 198.3 0.7 1.1<br />
Mar-12 100.0 0.1 0.2 100.0 0.5 0.3 122.2 0.3 3.5 240.8 0.4 3.6 314.8 0.3 1.5 199.1 0.4 1.1<br />
Apr-12 100.1 0.1 0.2 100.2 0.2 0.2 122.9 0.6 3.0 242.5 0.7 3.5 315.5 0.2 1.3 199.6 0.3 1.0<br />
May-12 99.8 -0.3 -0.1 100.0 -0.2 -0.1 122.8 -0.1 2.8 242.4 0.0 3.1 315.2 -0.1 1.0 199.6 0.0 0.9<br />
Jun-12 99.5 -0.3 -0.2 99.6 -0.4 -0.2 122.3 -0.4 2.4 241.8 -0.2 2.8 314.5 -0.2 1.0 199.1 -0.3 0.9<br />
Jul-12 99.5 0.0 -0.3 99.5 -0.1 -0.3 122.5 0.1 2.6 242.1 0.1 3.2 313.2 -0.4 0.7 198.3 -0.4 0.8<br />
Aug 12 (1) 99.5 0.0 -0.3 99.6 0.1 -0.3 123.1 0.5 2.5 243.0 0.4 2.9 313.6 0.1 0.7 198.6 0.1 0.9<br />
Sep 12 (1) 99.7 0.2 0.0 99.9 0.3 0.0 123.6 0.4 2.3 244.2 0.5 2.6 315.1 0.5 0.6 200.5 1.0 1.2<br />
Oct 12 (1) 99.8 0.1 0.2 100.0 0.1 0.2 123.8 0.2 2.4 244.7 0.2 2.8 316.4 0.4 0.9 200.9 0.2 1.5<br />
Nov 12 (1) 99.8 0.0 0.2 99.8 -0.2 0.2 124.2 0.3 2.5 245.6 0.3 3.0 317.3 0.3 1.0 201.2 0.1 1.4<br />
Dec 12 (1) 99.8 0.0 0.2 99.8 0.0 0.2 124.7 0.4 2.5 246.6 0.4 3.0 317.2 0.0 0.8 201.4 0.1 1.6<br />
Jan 13 (1) 99.9 0.1 0.2 99.5 -0.3 0.2 124.1 -0.5 2.5 245.7 -0.3 3.2 314.8 -0.8 0.9 200.3 -0.6 1.8<br />
Feb 13 (1) 99.9 0.0 0.0 99.5 0.0 0.0 124.8 0.5 2.4 247.3 0.6 3.1 317.0 0.7 1.0 201.7 0.7 1.7<br />
Mar 13 (1) 99.8 -0.1 -0.2 99.8 0.3 -0.2 125.1 0.3 2.4 248.2 0.4 3.1 318.2 0.4 1.1 202.6 0.4 1.8<br />
Apr 13 (1) 99.9 0.1 -0.2 100.0 0.2 -0.2 125.7 0.5 2.3 249.7 0.6 3.0 318.3 0.0 0.9 202.8 0.1 1.6<br />
May 13 (1) 99.9 0.0 0.1 100.1 0.1 0.1 125.9 0.2 2.5 250.4 0.3 3.3 318.7 0.1 1.1 203.1 0.1 1.7<br />
Jun 13 (1) 99.9 0.0 0.4 100.0 -0.1 0.4 125.9 0.0 2.9 250.5 0.0 3.6 318.3 -0.1 1.2 202.9 -0.1 1.9<br />
Updated<br />
Next<br />
Release<br />
Sep 11<br />
Aug CPI (Sep 28)<br />
Sep 20<br />
Sep CPI (Oct 16)<br />
Sep 13<br />
Sep CPI (Oct 11)<br />
Source: <strong>BNP</strong> Paribas, (1) Forecasts<br />
Chart 6: Japanese CPI (% y/y)<br />
Chart 7: UK CPI<br />
2.5<br />
2.0<br />
'Core'<br />
1.5<br />
1.0<br />
Headline<br />
0.5<br />
0.0<br />
-0.5<br />
-1.0<br />
-1.5<br />
Ex Food and Energy<br />
-2.0<br />
-2.5<br />
06 07 08 09 10 11 12<br />
Source: Reuters EcoWin Pro<br />
Core inflation was flat on the month in July, below our expectation<br />
of a 0.1% m/m rise. This caused the annual rate to fall further into<br />
negative territory, to -0.3% y/y. The US-style core CPI fell 0.1% on<br />
the month versus our expectation of no change. We expect core<br />
inflation to remain at the -0.3% level in August.<br />
Source: Reuters EcoWin Pro, <strong>BNP</strong> Paribas<br />
Inflation fell back to 2.5% y/y in August, partially undoing the<br />
increase to 2.6% y/y in July. The falls, like the increases the month<br />
before, were broad based, suggesting that any talk of building<br />
inflationary pressure is premature.<br />
Catherine Colebrook 20 September 2012<br />
Market Mover<br />
34<br />
www.GlobalMarkets.bnpparibas.com
Table 3: <strong>BNP</strong> Paribas' Inflation Forecasts<br />
Canada Norway Australia<br />
CPI Core CPI Headline CPI Core<br />
CPI<br />
Core<br />
Index % q/q % y/y Index % q/q % y/y Index % q/q % y/y Index % q/q % y/y Index % q/q % y/y Index % q/q % y/y<br />
2010 116.5 1.8 115.6 1.7 128.8 2.4 120.1 1.4 172.6 2.8 - 2.8<br />
2011 119.9 2.9 117.5 1.7 130.4 1.3 121.2 1.0 178.4 3.4 - 2.6<br />
2012 (1) 121.8 1.6 119.6 1.8 131.1 0.5 122.7 1.2 181.7 1.8 - 2.1<br />
Q3 2011 120.6 0.2 3.0 118.4 0.4 1.9 130.1 -0.7 1.5 121.2 -0.3 1.1 179.3 0.6 3.5 - - 2.5<br />
Q4 2011 120.2 0.3 2.7 118.2 0.6 2.0 130.5 0.4 0.9 121.8 0.5 1.1 179.3 0.0 3.1 - - 2.6<br />
Q1 2012 121.7 0.5 2.3 119.2 0.2 2.1 131.2 0.5 0.8 122.0 0.1 1.4 179.5 0.1 1.6 - - 2.2<br />
Q2 2012 121.6 0.6 1.6 119.4 0.7 2.0 131.5 0.2 0.4 122.9 0.8 1.1 180.4 0.5 1.2 - - 2.0<br />
Q3 2012 (1) 122.2 -0.1 1.3 119.9 -0.1 1.5 130.5 -0.7 0.4 122.6 -0.3 1.1 182.2 1.0 1.6 - - 2.3<br />
Q4 2012 (1) 122.2 0.3 1.3 120.3 0.6 1.5 131.3 0.6 0.6 123.3 0.6 1.2 183.3 0.6 2.2 - - 2.2<br />
Q1 2013 (1) 124.0 0.8 1.7 121.6 0.6 1.9 131.8 0.4 0.4 123.5 0.2 1.3 184.8 0.9 3.0 2.4<br />
Q2 2013 (1) 124.8 1.2 2.2 121.9 0.7 1.9 133.0 0.9 1.2 124.8 1.0 1.6 185.7 0.4 2.9 2.5<br />
Updated<br />
Next<br />
Release<br />
Sep 19<br />
Aug CPI (Sep 21)<br />
Sep 10<br />
Sep CPI (Oct 10)<br />
Jul 25<br />
Q3 CPI (Oct 24)<br />
Source: <strong>BNP</strong> Paribas, (1) Forecasts<br />
Chart 8: Canadian Headline vs. Core CPI (% y/y)<br />
Chart 9: Australian CPI (% y/y)<br />
4.0<br />
3.5<br />
3.0<br />
2.5<br />
2.0<br />
1.5<br />
1.0<br />
0.5<br />
0.0<br />
-0.5<br />
-1.0<br />
BoC Mid-Point Inflation Target<br />
BoC CPI Core (% y/y)<br />
CPI Total (% y/y)<br />
04 05 06 07 08 09 10 11 12<br />
7.0<br />
6.0<br />
5.0<br />
4.0<br />
3.0<br />
2.0<br />
1.0<br />
0.0<br />
(% y/y)<br />
Headline CPI<br />
Underlying CPI<br />
<strong>BNP</strong>P<br />
Fcast<br />
-1.0<br />
Q193 Q195 Q197 Q199 Q101 Q103 Q105 Q107 Q109 Q111 Q113<br />
Source: Reuters EcoWin Pro, <strong>BNP</strong> Paribas<br />
Core inflation in Canada has fallen back after peaking in February,<br />
while wage growth is below the inflation rate. There is, therefore,<br />
little pressure on the Bank of Canada to change its policy stance.<br />
Source: Reuters EcoWin Pro, <strong>BNP</strong> Paribas<br />
Inflation continued to moderate in Q2, with the decline to 1.2% y/y<br />
marking the second consecutive downside surprise – the market<br />
had expected inflation of 1.3% y/y. Our forecast is for a gradual<br />
acceleration in both core and headline inflation this year.<br />
CPI Data Calendar for the Coming Week<br />
Day GMT Economy Indicator Previous <strong>BNP</strong>P Forecast Consensus<br />
Wed 26/09 12:00 Germany CPI (Prel) m/m : Sep 0.3% -0.1% 0.0%<br />
12:00 CPI (Prel) y/y : Sep 2.0% 1.9% 2.0%<br />
12:00 HICP (Prel) m/m : Sep 0.3% -0.1% 0.0%<br />
12:00 HICP (Prel) y/y : Sep 2.3% 2.0% 2.1%<br />
Thu 27/09 09:15 Belgium CPI m/m : Sep 0.4% 0.0% n/a<br />
09:15 CPI y/y : Sep 2.9% 2.6% n/a<br />
23:30 Japan CPI National y/y : Aug -0.4% -0.6% -0.6%<br />
23:30 CPI Tokyo y/y : Sep -0.7% -0.6% -0.6%<br />
Fri 28/09 07:00 Spain HICP Flash y/y : Sep 2.7% 3.6% n/a<br />
09:00 Eurozone HICP (Flash) y/y : Sep 2.6% 2.6% 2.3%<br />
09:00 Italy CPI (NIC, Prel) m/m : Sep 0.4% -0.3% n/a<br />
09:00 CPI (NIC, Prel) y/y : Sep 3.2% 2.9% n/a<br />
09:00 HICP (Prel) m/m : Sep 0.2% 1.5% n/a<br />
09:00 HICP (Prel) y/y : Sep 3.5% 2.8% n/a<br />
Release dates and forecasts as at c.o.b. prior to the date of publication: See Daily Economic Spotlight for any revision<br />
Source: <strong>BNP</strong> Paribas<br />
Catherine Colebrook 20 September 2012<br />
Market Mover<br />
35<br />
www.GlobalMarkets.bnpparibas.com
This section is classified as non-objective research<br />
Trade Reviews<br />
Options, Money Market and Bond Trades – Tactical & Strategic Trades<br />
This page summarises our main tactical (T) and strategic (S) trades. The former focus on short-term horizons (a few weeks),<br />
allowing one to play any near-term corrections within a defined trend, while the latter rely on a medium-term assumed trend.<br />
For each trade, we provide the expected target and the recommended stop-loss.<br />
Closed Strategies<br />
BUY Germany 5y CDS BUY<br />
Position stopped on 18/09. P&L: -150k<br />
Receive EUR 5y5y swap. Pay USD 5y5y swap.<br />
Position closed on the stop win on 20/09. P&L: +150k<br />
Current Strategies<br />
Outright<br />
JPY long JL135 swap spread BUY<br />
With the 5y JGB yield at 23bp, long-end ASWs should attract demand as a carry<br />
position.<br />
Yield Curves<br />
JPY fwd swap steepener REC<br />
1y1y/2y1y spread (versus six-month Libor) is historically low.<br />
Current* Targets Stop Entry<br />
.<br />
(S)<br />
.<br />
(S)<br />
L+14.8<br />
(S)<br />
Inflation<br />
Long (pay fixed, receive inflation) 10y HICPxT BUY 2.15<br />
(T)<br />
Options<br />
JPY: 2y2y/2y5y volatility ratio SELL<br />
The upper left-hand corner looks rich on the volatility matrix and there are some<br />
signs of overshooting.<br />
1<br />
(S)<br />
-340k<br />
(S)<br />
80/85 49 56.5<br />
(23-Aug)<br />
20bp 10bp 5bp<br />
(06-Sep)<br />
L+0 L+16 L+11<br />
(23-May)<br />
10 -1 3<br />
(23-May)<br />
2.15 2.00 2.09<br />
(04-Sep)<br />
2300k -1500k -200k<br />
(13-Sep)<br />
*Tactical (T) and strategic (S) trades. **Risk: vega, gamma for options, or ΔDV01 for futures, bonds and swaps.<br />
Carry<br />
/month<br />
Risk**<br />
20k<br />
30k<br />
JPY 500k<br />
JPY 500k<br />
P&L<br />
(ccy/bp)<br />
EUR<br />
-150k<br />
EUR<br />
180k<br />
JPY<br />
-1900k<br />
JPY<br />
-1000k<br />
0bp 20k EUR<br />
120k<br />
JPY1.7mn<br />
per 10%<br />
relative<br />
vega<br />
JPY<br />
-140k<br />
Interest Rate Strategy 20 September 2012<br />
Market Mover<br />
36<br />
www.GlobalMarkets.bnpparibas.com
This section is classified as non-objective research<br />
CAD: A Leader in the Commodity Bloc<br />
• Fed and ECB policy will remain supportive of<br />
the CAD.<br />
• The BoC is likely to hike rates in mid-2013.<br />
• USDCAD is heading for a low of 0.92 by Q3<br />
2013.<br />
Chart 1: US GDP vs. Canadian GDP<br />
The commitments by the Federal Reserve and the<br />
ECB to support the markets suggest that a risk rally<br />
is set to ensue for the unforeseeable future. The Fed<br />
intends to keep US interest rates low until mid-2015<br />
and buy bonds until the US economy improves and<br />
unemployment declines. The ECB will help to reduce<br />
risk premia in the eurozone by buying the short-dated<br />
government bonds of the peripheral countries once<br />
they sign up to an EFSF/ESM programme. With the<br />
central banks almost suppressing volatility in the<br />
markets, the environment bodes well for risky assets.<br />
We are most bullish on commodity currencies into<br />
year end, but expect the CAD to outperform its peers<br />
into 2013. We believe USDCAD is likely to drift to<br />
0.9200, a new low, by mid-2013.<br />
Source: Reuters EcoWin Pro, <strong>BNP</strong> Paribas<br />
Chart 2: USDCAD vs. USD-CAD 2yr Swap<br />
Ratio<br />
The Fed and ECB policies allow investors to pile into<br />
higher-yielding assets. The Fed’s policy stance, in<br />
particular, ensures that the USD will once again<br />
become the funding currency of choice. USD<br />
weakness is set to take hold until the Fed stops<br />
purchasing bonds at the end of 2013 or in mid-2014.<br />
Open-ended QE may translate into a USD1-1.5trn<br />
expansion of the Fed’s balance sheet, making it one<br />
of the most aggressive central banks on the stimulus<br />
front.<br />
The Fed’s goal to get the economy back on track<br />
bodes well for those economies most dependent on<br />
the US, not least Canada. With 70% of Canadian<br />
exports destined for the US market, the likely<br />
improvement in consumption in the US should boost<br />
growth in Canada. Indeed, we expect Canadian<br />
exports to outpace imports heading into 2013, not<br />
only because of the improvement of both the US and<br />
the global economy, but also the rise in oil prices.<br />
The Fed’s stimulative policy will push up oil prices,<br />
improving Canada’s terms of trade as an exporter of<br />
oil. After Q3, exports are expected to make a positive<br />
contribution to Canadian growth.<br />
Source: Reuters EcoWin Pro, <strong>BNP</strong> Paribas<br />
Chart 3: CAD TWI vs. Brent<br />
While Fed policy is crucial to the outlook for the CAD,<br />
the domestic backdrop also remains supportive.<br />
Business investment, which has been a key<br />
contributor to growth, thanks to investment in mining,<br />
should continue to expand at a solid pace. In<br />
addition, personal consumption is likely to grow near<br />
Source: Reuters EcoWin Pro, <strong>BNP</strong> Paribas<br />
FX Strategy / Mary Nicola 20 September 2012<br />
Market Mover<br />
37<br />
www.GlobalMarkets.bnpparibas.com
This section is classified as non-objective research<br />
trend. The only variable of the GDP formula that will<br />
remain flat is government consumption as the<br />
government continues to cut its fiscal deficit in a bid<br />
to achieve a balanced budget by late 2014/early<br />
2015.<br />
Chart 4: USDCAD vs. DJIA<br />
With the economy set to grow at trend of 2.1% in<br />
2013, the Bank of Canada (BoC) will likely cut rates<br />
in mid-2013, but at a gradual pace. Despite the<br />
global backdrop and the increased market volatility in<br />
recent months, the BoC has maintained a tightening<br />
bias in its statements, while acknowledging the risks.<br />
Inflation in Canada remains subdued and well below<br />
the BoC’s 2% target. The bank is in no rush to lift<br />
rates, but expected green shoots in the economy<br />
should see it hiking in 2013.<br />
As one of only two central banks (the other is<br />
Norway’s Norges Bank) looking to hike in 2013, the<br />
CAD stands to benefit, standing out in an<br />
environment in which central banks have made it<br />
very clear that monetary policy will remain stimulative<br />
for a long time. Expectations of a hike from the BoC<br />
should push USDCAD to new lows, 0.92 by the end<br />
of Q3 2013. A stronger CAD may not be in the BoC’s<br />
favour, but USDCAD below parity has become the<br />
new norm for Canada and it looks like the economy<br />
will have to adjust accordingly. The strength of the<br />
CAD will be less of an issue if the economy sustains<br />
trend growth.<br />
Besides the potential risks in the global economy i.e.<br />
a slower-than-expected Chinese recovery, the US<br />
fiscal cliff, resurfacing concerns over the eurozone,<br />
Source: Reuters EcoWin Pro, <strong>BNP</strong> Paribas<br />
the Canadian economy faces some of its own.<br />
Household debt continues to rise and a potential<br />
correction to the housing market would devastate the<br />
economy. However, our main scenario is that the<br />
global economy will improve into 2013, which should<br />
help the Canadian economy avert these risks.<br />
While we are bullish on the CAD and expect it to<br />
outperform its commodity-currency peers, particularly<br />
the AUD, we are reluctant to recommend a long CAD<br />
trade. Current positioning in the CAD looks<br />
overstretched and suggests limited potential upside<br />
from here. We think any pullbacks in the CAD would<br />
offer good buying opportunities.<br />
FX Strategy / Mary Nicola 20 September 2012<br />
Market Mover<br />
38<br />
www.GlobalMarkets.bnpparibas.com
This section is classified as non-objective research<br />
Adding USD Shorts: Ease into Long GBPUSD<br />
• The Fed’s bold policy initiative will extend<br />
USD downside.<br />
• We favour GBPUSD higher as UK<br />
fundamentals improve.<br />
• We initiate a conditional GBPUSD long<br />
recommendation on a pullback to 1.60, target 1.67,<br />
stop at 1.5750.<br />
Chart 1: GBP TWI vs. UK Bank of England<br />
Balance Sheet<br />
The Fed’s policy action on open-ended QE has set<br />
the trend for the USD over the coming months. We<br />
believe USD depreciation will persist for some time.<br />
ECB chief Mario Draghi’s strong rhetoric, pledging<br />
support for eurozone peripheral bonds, will add<br />
further momentum to a rally in risky assets and a<br />
yield-seeking environment. Our favoured way to play<br />
this trend in the FX markets is via long NZDUSD<br />
(targeting 0.8470), but the strength of our conviction<br />
in USD weakness encourages us to pursue further<br />
USD shorts, with GBPUSD our next preferred<br />
candidate.<br />
Looking at our FX forecasts, the most upside<br />
potential is in GBPUSD, with our forecasts for 1.67 at<br />
end Q3 and 1.73 at year end. These forecasts are<br />
driven largely by USD weakness on the back of<br />
open-ended QE, but also by expectations that the<br />
sharp run of very weak UK economic data has likely<br />
come to an end. We believe the GBP is set to<br />
outperform both the USD and EUR.<br />
Our US economists believe the Fed has initiated a<br />
bold new experiment in monetary policy that will<br />
result in balance-sheet expansion through to at least<br />
end 2013 and which will likely produce total balancesheet<br />
expansion of between USD 1.2trn and USD<br />
1.7trn. This is substantially more than QE1 or QE2.<br />
Accordingly, the USD is set to slide, just as it did<br />
during the previous bouts of Fed QE. We agree with<br />
Fed Chairman Ben Bernanke that the law of<br />
diminishing returns do not necessarily apply to<br />
balance-sheet expansion.<br />
In the UK, we believe the long spate of poor<br />
economic data may be coming to an end. Three<br />
straight quarters of GDP contraction has hurt the<br />
GBP, but our economists believe that UK GDP will<br />
rebound by 0.7% in Q3. Furthermore, <strong>BNP</strong> Paribas<br />
forecasts UK GDP growth of 1.1% in 2013 and 1.7%<br />
in 2014. As the market reassesses the recovery<br />
prospects for the UK economy, the GBP should start<br />
to outperform against not just the USD, but also the<br />
EUR. Additionally, even if the BoE expands its<br />
balance sheet further under its QE programme recent<br />
Source: Reuters EcoWin Pro, <strong>BNP</strong> Paribas<br />
Chart 2: GBPUSD vs. <strong>BNP</strong>P STEER<br />
1.62<br />
1.60<br />
1.58<br />
1.56<br />
1.54<br />
1.52<br />
21-Jun-2012 21-Jul-2012 21-Aug-2012<br />
Fair Value<br />
GBPUSD<br />
Source: Reuters EcoWin Pro, <strong>BNP</strong> Paribas<br />
Chart 3: Overall FX Positioning<br />
CAD<br />
11-Sep-12<br />
24<br />
NOK<br />
18-Sep-12<br />
23<br />
NZD<br />
22<br />
AUD<br />
21<br />
SEK<br />
18<br />
GBP<br />
13<br />
EUR<br />
12<br />
CHF<br />
-11<br />
USD<br />
-15<br />
JPY<br />
-21<br />
-50 -30 -10 10 30 50<br />
Source: Reuters EcoWin Pro, <strong>BNP</strong> Paribas<br />
FX Strategy / Steven Saywell 20 September 2012<br />
Market Mover<br />
39<br />
www.GlobalMarkets.bnpparibas.com
This section is classified as non-objective research<br />
evidence suggests that GBP will not weaken in<br />
response.<br />
We considered establishing a long GBPUSD<br />
recommendation simultaneously with our long<br />
NZDUSD position prior to the Fed’s announcement<br />
last week. We shied away from the GBPUSD idea,<br />
because the pair had already rallied sharply in<br />
contrast to NZDUSD, which had lagged. Long<br />
NZDUSD has performed strongly, however;<br />
GBPUSD would have, too. Still, opportunity may<br />
have knocked twice, as there are several factors that<br />
now suggest GBPUSD may retrace to allow for an<br />
attractive entry level. First, our <strong>BNP</strong> Paribas STEER<br />
model suggests that GBPUSD is overvalued on a<br />
short-term basis (see chart), signalling that fair value<br />
is around 1.60 (vs. spot at 1.62). Second, our <strong>BNP</strong><br />
Paribas positioning indicator signals that FX investors<br />
are still long GBP. However, long GBP positioning<br />
has retreated sharply over the past week. The GBP<br />
was the most owned currency a week ago, but has<br />
fallen to rank sixth. This move suggests that the GBP<br />
is approaching a level at which extreme positioning<br />
may no longer present a barrier to further<br />
appreciation.<br />
Our technical analysts note that GBPUSD is trading<br />
mid-range within a long-term triangle formation. Short<br />
term, GBPUSD has stalled at horizontal resistance<br />
around 1.63 and looks very overbought. A correction<br />
back to 1.5890 is now very probable (the 38.2%<br />
Chart 4: GBPUSD Vulnerable to Near-Term<br />
Correction<br />
Source: Reuters EcoWin Pro, <strong>BNP</strong> Paribas<br />
correction of the rise to 1.6274). Such a move would<br />
still respect the lower bound of the long-term triangle<br />
formation, while our overall FX strategy view is that<br />
an ultimate breakout will occur to the top side.<br />
To benefit from a near-term retracement in GBPUSD,<br />
but an ultimate move to the upside, we are initiating a<br />
conditional long GBPUSD spot FX recommendation<br />
on a pullback to 1.60. We target a move to 1.67 (our<br />
end-Q3 forecast), with a stop at 1.5750.<br />
FX Strategy / Steven Saywell 20 September 2012<br />
Market Mover<br />
40<br />
www.GlobalMarkets.bnpparibas.com
This section is classified as non-objective research<br />
Commodity Market Outlook<br />
• We expect a rise in oil prices over the next<br />
18 months.<br />
• Base metals prices have moved in a pack in<br />
2012, but are expected to diverge in 2013.<br />
• Higher demand and Black Sea trade barriers<br />
may lead to a leg up in agriculture.<br />
Oil and natural gas<br />
Despite the economic headwinds, we expect world oil<br />
demand to prove resilient, notably in emerging<br />
markets. Tighter sanctions on Iranian oil are likely to<br />
be accompanied by greater geopolitical tension and<br />
an erosion of spare production capacity in the OPEC<br />
countries. In non-OPEC countries, the only oil supply<br />
growth will come from the US but it will remain<br />
confined to the domestic market, while outages and<br />
declines in mature fields will persist elsewhere. The<br />
forthcoming global monetary-policy easing should<br />
bring about lower volatility, greater risk appetite and, in<br />
the case of the Fed, a weaker US dollar. All of this<br />
suggests a higher price for oil for the balance of 2012<br />
and into 2013. In the US natural gas markets, the<br />
oversupply from shale plays will continue to dominate<br />
market direction over the next quarter, but eventually<br />
ebb in 2013. We will only see demand-driven price<br />
support when winter demand picks up, eroding the<br />
overhang in stocks. We expect switches in baseload<br />
electricity generation and producer cutbacks to tighten<br />
balances progressively, suggesting gas prices will<br />
strengthen markedly in the second half of 2013.<br />
Metals<br />
A strong rally late in the quarter looks set to leave<br />
base metal prices down no more than 3-4%, on<br />
average, in Q3 2012. Monetary easing, other stimulus<br />
measures and tight supply in the flagship copper<br />
market are expected to drive further price recovery in<br />
Q4. Base metals have mostly moved in a pack this<br />
year, but we expect greater divergence in 2013.<br />
Copper prices may come under downward pressure<br />
due to faster supply growth, but the fundamentals of<br />
other metals should improve. We expect monetary<br />
accommodation to support gold and silver in Q4 2012.<br />
Higher liquidity and inflation expectations, plus a<br />
depreciating USD, should be positive factors. Officialsector<br />
purchases and a rebound in Chinese demand<br />
should more than offset shrinking <strong>India</strong>n jewellery<br />
demand. Platinum and palladium, too, should benefit<br />
from higher liquidity and risk appetite, while South<br />
African supply disruptions will erode market surpluses.<br />
Agriculture<br />
Grains and oilseeds prices surged by more than 50%<br />
this summer, as July was the hottest month on<br />
record in 48 US states. As a result, the US 2012-13<br />
corn yield may be at least 22% below its historical<br />
trend dating back to 1965, while the soybean yield<br />
may be cut further in Q4. Feed demand destruction,<br />
a stronger US dollar than last year and seasonal<br />
pressure linked to crop harvests across the northern<br />
hemisphere may offset part of US field losses short<br />
term and push prices down slightly by November.<br />
But, tight global stocks-to-use ratios, reviving biofuel<br />
demand and trade barriers in the Black Sea region<br />
may trigger a new leg up in agriculture this winter.<br />
Table 1: <strong>BNP</strong> Paribas commodity price forecasts, period averages<br />
Issue date 2012 (f) 2013 (f) Q4 2012 (f) Q1 2013 (f) Q2 2013 (f) Q3 2013 (f) Q4 2013 (f)<br />
NYMEX WTI 1m (USD/bbl) 07/09/2012 98 112 104 116 110 108 112<br />
ICE Brent 1m (USD/bbl) 07/09/2012 113 120 117 125 118 116 120<br />
NYMEX Henry Hub (USD/MBTU) 18/07/2012 2.70 4.00 3.05 3.60 3.65 4.15 4.65<br />
Aluminium cash (USD/t) 11/09/2012 2,055 2,350 2,145 2,250 2,325 2,375 2,450<br />
Copper cash (USD/t) 11/09/2012 8,100 8,000 8,500 8,525 8,225 7,825 7,425<br />
Nickel cash (USD/t) 11/09/2012 17,600 18,375 17,425 18,000 18,500 18,250 18,750<br />
Zinc cash (USD/t) 11/09/2012 1,980 2,325 2,080 2,175 2,250 2,350 2,525<br />
Lead cash (USD/t) 11/09/2012 2,065 2,550 2,235 2,375 2,475 2,600 2,750<br />
Tin cash (USD/t) 11/09/2012 21,200 25,500 22,000 24,000 25,500 26,000 26,500<br />
Gold spot (USD/oz) 14/09/2012 1,685 1,900 1,795 1,865 1,900 1,925 1,915<br />
Silver spot (USD/oz) 14/09/2012 32.75 41.45 39.15 42.60 43.00 41.85 38.35<br />
Platinum spot (USD/oz) 14/09/2012 1,575 1,820 1,705 1,785 1,815 1,835 1,840<br />
Palladium spot (USD/oz) 14/09/2012 665 900 725 800 860 925 1,010<br />
Corn (USD¢/bu) 12/09/2012 708 854 790 855 930 845 785<br />
Cotton (USD¢/lb) 12/09/2012 83 105 80 95 120 115 90<br />
Soybeans (USD¢/bu) 12/09/2012 1526 1793 1720 1900 1830 1730 1710<br />
Wheat (USD¢/bu) 12/09/2012 750 905 855 925 995 870 820<br />
Live cattle (USD¢/lb) 22/11/2011 122 140 128 135 140 140 145<br />
Sugar (USD¢/lb) 12/09/2012 22 26 22 25 28 27 25<br />
Source: <strong>BNP</strong> Paribas (f) Forecast<br />
Commodity Markets Strategy 20 September 2012<br />
Market Mover<br />
41<br />
www.GlobalMarkets.bnpparibas.com
Economic Calendar: 21 – 28 September<br />
GMT Local Previous Forecast Consensus<br />
Fri 21/09 06:45 08:45 France Wages (Final) q/q : Q2 0.5% (p) 0.5% n/a<br />
08:00 10:00 Eurozone ECB's Liikanen Speaks in a Finnish Parliament Hearing<br />
08:30 09:30 UK PSNCR : Aug GBP-22.9bn<br />
08:30 09:30 PSNB : Aug GBP-1.8bn<br />
08:30 09:30 PSNB Ex-Interventions : Aug GBP0.6bn GBP15.5bn GBP15.0bn<br />
12:30 08:30 Canada CPI m/m : Aug -0.1% 0.3% 0.3%<br />
12:30 08:30 CPI y/y : Aug 1.3% 1.3% 1.3%<br />
12:30 08:30 BoC Core CPI m/m : Aug -0.1% 0.2% 0.3%<br />
12:30 08:30 BoC Core CPI y/y : Aug 1.7% 1.5% 1.5%<br />
13:00 15:00 Belgium Business Confidence : Sep -11.8 -11.3 -11.3<br />
16:40 12:40 US Atlanta Fed's Lockhart Speaks on Policy and Economy in Atlanta<br />
Sun 23/09 07:00 10:00 Eurozone ECB's Coeuré Speaks on the Eurozone Crisis in a Medium and Long Term Perspective in<br />
Ramallah, Palestinian Territories<br />
Mon 24/09 23:50 08:50 Japan BoJ Minutes<br />
(23/09)<br />
07:30 09:30 Neths Producer Confidence : Sep -4.6 -4.0 n/a<br />
07:30 09:30 GDP (Final) q/q : Q2 0.2% (p) 0.2% n/a<br />
07:30 09:30 GDP (Final) y/y : Q2 -0.5% (p) -0.5% n/a<br />
08:00 10:00 Germany Ifo Business Climate : Sep 102.3 102.2 102.8<br />
08:00 10:00 Ifo Current Conditions : Sep 111.1 110.9 111.1<br />
08:00 10:00 Ifo Expectations : Sep 94.2 94.0 95.5<br />
08:00 10:00 Italy Non-EU Trade Balance (Prel) : Aug EUR0.3bn EUR-0.2bn n/a<br />
19:30 12:30 US San Francisco Fed's Williams to Speak at the City Club of San Francisco<br />
Tue 25/09 06:00 08:00 Germany GfK Consumer Confidence : Oct 5.9<br />
06:45 08:45 France Housing Starts (3-mths) y/y : Aug -9.4% -6.0% n/a<br />
06:45 08:45 Industry Survey : Sep 90 89 89<br />
06:45 08:45 <strong>Services</strong> Survey : Sep 85 85 n/a<br />
07:30 09:30 Sweden PPI (nsa) m/m : Aug -1.1% -0.2% n/a<br />
07:30 09:30 PPI (nsa) y/y : Aug -1.1% -1.6% n/a<br />
08:00 10:00 Italy ISAE Consumer Confidence : Sep 86.0 85.5 n/a<br />
09:00 11:00 Wages m/m : Aug 0.0% 0.0% n/a<br />
09:00 11:00 Wages y/y : Aug 1.5% 1.5% n/a<br />
13:00 15:00 Eurozone ECB President Draghi Speaks at Event in Berlin<br />
13:00 09:00 US S&P/Case-Shiller Home Price Index : Jul 142.2<br />
14:00 10:00 Consumer Confidence : Sep 60.6 64.0 63.0<br />
14:00 10:00 FHFA House Price Index m/m : Jul 0.7%<br />
16:00 12:00 Philadelphia Fed's Plosser Speaks on Economic Outlook in Philadelphia<br />
Wed 26/09 23:00 00:00 Eurozone ECB Vice President Constancio Speaks in London<br />
(25/09)<br />
06:45 08:45 France Consumer Confidence : Sep 87 86 86<br />
16:00 18:00 Jobseekers (ILO def) m/m : Aug 1.4% 0.7% n/a<br />
07:00 09:00 Sweden Consumer Confidence (sa) : Sep 5.4 6.1 n/a<br />
08:00 10:00 Italy Retail Sales m/m : Jul 0.4%<br />
08:00 10:00 Retail Sales y/y : Jul -0.5% -0.8% n/a<br />
08:00 10:00 Norway Unemployment Rate AKU (sa) : Jul 3.0% 3.0% .3.0%<br />
10:00 11:00 UK CBI Reported Sales : Sep -3<br />
Market Economics 20 September 2012<br />
Market Mover<br />
42<br />
www.GlobalMarkets.bnpparibas.com
Economic Calendar: 21 – 28 Sep (cont)<br />
GMT Local Previous Forecast Consensus<br />
Wed 26/09 12:00 14:00 Germany CPI (Prel) m/m : Sep 0.3% -0.1% 0.0%<br />
(cont) 12:00 14:00 CPI (Prel) y/y : Sep 2.0% 1.9% 2.0%<br />
12:00 14:00 HICP (Prel) m/m : Sep 0.3% -0.1% 0.0%<br />
12:00 14:00 HICP (Prel) y/y : Sep 2.3% 2.0% 2.1%<br />
14:00 10:00 US New Home Sales : Aug 372k 365k 380k<br />
14:30 10:30 EIA Oil Inventories<br />
17:15 13:15 Chicago Fed’s Evans Speaks to Chamber of Commerce in Hammond, <strong>India</strong>na<br />
Thu 27/09 07:00 09:00 Spain Retail Sales y/y : Aug -7.3% -7.5% n/a<br />
07:55 09:55 Germany Unemployment (Chg, sa) : Sep 9k 2k 10k<br />
07:55 09:55 Unemployment Rate : Sep 6.8% 6.8% 6.8%<br />
08:00 10:00 Eurozone Economic Sentiment : Sep 86.1 85.7 n/a<br />
08:00 10:00 Industrial Sentiment : Sep -15.3 -15.0 -15.0<br />
08:00 10:00 Consumer Sentiment : Sep -25.9 (p) -25.9 n/a<br />
08:00 10:00 M3 y/y : Aug 3.8% 3.2% 3.6%<br />
08:00 10:00 M3 3m y/y : Aug 3.4% 3.4% n/a<br />
08:30 09:30 UK GDP (Final) q/q : Q2 -0.5% (p) -0.5% -0.5%<br />
08:30 09:30 GDP (Final) y/y : Q2 -0.5% (p) -0.5% -0.5%<br />
09:00 11:00 Italy ISAE Business Confidence : Sep 87.2<br />
09:00 10:00 Portugal Consumer Confidence : Sep -49.2 -53.0 n/a<br />
09:00 10:00 Economic Climate Indicator : Sep -4.0 -4.2 n/a<br />
09:15 11:15 Belgium CPI m/m : Sep 0.4% 0.0% n/a<br />
09:15 11:15 CPI y/y : Sep 2.9% 2.6% n/a<br />
12:30 08:30 US Durable Goods Orders m/m : Aug 4.1% -4.9% -4.5%<br />
12:30 08:30 GDP (Final, saar) q/q : Q2 1.7% (p) 1.7% 1.7%<br />
12:30 08:30 Initial Claims 382k 385k n/a<br />
14:00 10:00 Pending Home Sales m/m : Aug 2.4% -1.0% -0.3%<br />
Fri 28/09 23:01 00:01 UK Gfk Consumer Confidence : Sep -29<br />
(27/09)<br />
23:30 08:30 Japan CPI National y/y : Aug -0.4% -0.6% -0.6%<br />
23:30 08:30 CPI Tokyo y/y : Sep -0.7% -0.6% -0.6%<br />
23:30 08:30 Household Consumption y/y : Aug 1.7% 2.5% 1.8%<br />
23:30 08:30 Unemployment Rate (sa) : Aug 4.3% 4.3% 4.3%<br />
23:50 08:50 Industrial Production (Prel, sa) m/m : Aug -1.0% -0.7% -0.7%<br />
23:50 08:50 Retail Sales y/y : Aug -0.7% 1.0% 0.2%<br />
(27/09)<br />
05:00 14:00 Housing Starts y/y : Aug -9.6% -5.5% -9.0%<br />
France Budget 2013<br />
05:30 07:30 GDP (Final, wda) q/q : Q2 0.0% (p) -0.1% n/a<br />
05:30 07:30 GDP (Final, wda) y/y : Q2 0.3% (p) 0.2% n/a<br />
06:45 08:45 Retail Sales m/m : Jul 0.1% 0.3% n/a<br />
06:45 08:45 Retail Sales y/y : Jul 0.2% 0.7% n/a<br />
06:45 08:45 Retail Sales m/m : Aug n/a -1.5% -0.4%<br />
06:45 08:45 Retail Sales y/y : Aug n/a -1.2% n/a<br />
07:45 09:45 PPI m/m : Jul -0.9% 1.5% n/a<br />
07:45 09:45 PPI y/y : Jul 1.3% 2.3% n/a<br />
07:45 09:45 PPI m/m : Aug n/a 1.0% 0.6%<br />
07:45 09:45 PPI y/y : Aug n/a 3.4% n/a<br />
07:00 09:00 Spain HICP Flash y/y : Sep 2.7% 3.6% n/a<br />
07:30 09:30 Sweden Retail Sales (sa) m/m : Aug 0.3% 0.5% n/a<br />
07:30 09:30 Retail Sales (nsa) y/y : Aug 2.4% 3.3% n/a<br />
Market Economics 20 September 2012<br />
Market Mover<br />
43<br />
www.GlobalMarkets.bnpparibas.com
Economic Calendar: 21 – 28 Sep (cont)<br />
GMT Local Previous Forecast Consensus<br />
Fri 28/09 08:00 10:00 Italy PPI m/m : Aug 0.4% 0.3% n/a<br />
(cont) 08:00 10:00 PPI y/y : Aug 2.4% 2.4% n/a<br />
09:00 11:00 CPI (NIC, Prel) m/m : Sep 0.4% -0.3% n/a<br />
09:00 11:00 CPI (NIC, Prel) y/y : Sep 3.2% 2.9% n/a<br />
09:00 11:00 HICP (Prel) m/m : Sep 0.0% 1.5% n/a<br />
09:00 11:00 HICP (Prel) y/y : Sep 3.3% 2.8% n/a<br />
08:00 10:00 Norway Retail Sales (sa) m/m : Aug -0.1% 0.8% n/a<br />
08:00 10:00 Retail Sales (nsa) y/y : Aug 2.7% -1.1% n/a<br />
08:00 10:00 Unemployment Rate (nsa) : Sep 2.6% 2.4% 2.4%<br />
08:30 10:30 Eurozone Eurocoin : Sep<br />
09:00 11:00 HICP (Flash) y/y : Sep 2.6% 2.6% 2.3%<br />
11:00 12:00 ECB's Godeffroy Speaks at Conference in Oporto, Portugal<br />
11:30 13:30 ECB's Asmussen Speaks in Berlin<br />
09:30 11:30 Switzerland KoF Leading Indicator : Sep 1.57<br />
10:00 11:00 Portugal Retail Sales y/y : Aug -7.9% -8.4% n/a<br />
12:30 08:30 Canada GDP (monthly) m/m : Jul 0.2% 0.2% n/a<br />
12:30 08:30 US Personal Income m/m : Aug 0.3% 0.2% 0.2%<br />
12:30 08:30 Personal Spending m/m : Aug 0.4% 0.3% 0.5%<br />
13:45 09:45 Chicago PMI : Sep 53.0 52.3 53.1<br />
13:55 09:55 Michigan Sentiment (Final) : Sep 79.2 (p) 78.0 78.8<br />
During 24-28/09 UK Nationwide House Prices Index m/m : Sep 1.3%<br />
Week Nationwide House Prices Index y/y : Sep -0.7%<br />
24-30/09 Germany Import Prices m/m : Aug 0.7%<br />
Import Prices y/y : Aug 1.2%<br />
Release dates and forecasts as at c.o.b. prior to the date of publication: See Daily Economic Spotlight for any revision<br />
Source: <strong>BNP</strong> Paribas<br />
Market Economics 20 September 2012<br />
Market Mover<br />
44<br />
www.GlobalMarkets.bnpparibas.com
Key Data Preview<br />
Chart 1: UK Cumulative PSNB (GBP bn)<br />
180<br />
160 2008 2009 2010<br />
140<br />
120<br />
2011 2012<br />
100<br />
80<br />
60<br />
40<br />
20<br />
0<br />
April May June July Aug Sept Oct Nov Dec Jan Feb Mar<br />
Sources: Reuters EcoWin Pro<br />
Aug (f) July June May<br />
PSNB (ex interventions) 15.5 0.6 14.6 18.5<br />
<strong>BNP</strong> Paribas Forecast: Better, but Only a Bit<br />
UK: Public sector (August)<br />
Release Date: Friday 21 September<br />
The recent figures for UK public finances have been<br />
disappointing. In July, the monthly public finances posted a<br />
GBP 0.6bn deficit, despite it normally being a bumper month<br />
for corporation- and income-tax receipts. Over the four<br />
months of the 2012/13 fiscal year to July, the deficit was<br />
GBP 9bn more than it was a year earlier, despite the Office<br />
for Budget Responsibility (OBR) forecasting borrowing for the<br />
full fiscal year at GBP 120bn, down from GBP 126bn in<br />
2011/12. Revisions and time issues could still markedly<br />
improve the deficit picture this year, but it appears that the<br />
weak cyclical position is also taking its toll.<br />
In the August data, we are expecting some of the weakness<br />
in tax receipts to unwind, though the underlying picture will<br />
still look a trifle worrying.<br />
Key Point:<br />
The August data should look okay, but the trend is not<br />
so encouraging.<br />
Sources: Reuters EcoWin Pro<br />
Chart 2: Canadian Inflation<br />
m/m % Aug (f) Jul Jun May<br />
Headline CPI 0.1 -0.1 -0.4 -0.1<br />
Bank of Canada Core -0.1 -0.1 -0.4 0.2<br />
<strong>BNP</strong> Paribas Forecast: Missing the Target<br />
Canada: CPI (August)<br />
Release Date: Friday 21 September<br />
Food and energy prices likely increased in August, which is<br />
expected to drive headline CPI higher on a m/m basis;<br />
however, due to base effects, the y/y pace of inflation is<br />
expected to be close to 1.1%. Meanwhile, core prices are<br />
expected to post another negative number with the y/y pace<br />
of core inflation likely to move significantly lower (from 1.7%<br />
in July to our expected 1.2% in August).<br />
The underlying pace of economic growth, wages and inflation<br />
has been weak as of late, which leaves little underlying<br />
pressure on the BoC to worry about inflation running above<br />
their 2% target (see chart). Given our current subdued GDP<br />
growth trajectory, we believe there is little reason for the BoC<br />
to be concerned with the current inflation outlook, and we<br />
expect the BoC to leave interest rates unchanged for some<br />
time.<br />
Key Point:<br />
Despite a likely monthly increase in food and energy<br />
prices, underlying price pressures are absent, taking<br />
any pressure off the BoC to raise interest rates anytime<br />
soon.<br />
Market Economics 20 September 2012<br />
Market Mover<br />
45<br />
www.GlobalMarkets.bnpparibas.com
Key Data Preview<br />
Chart 3: Ifo Business Cycle Clock<br />
Sources: Reuters EcoWin Pro<br />
Sep (f) Aug Jul Jun<br />
Headline 102.2 102.3 103.2 105.2<br />
Current conditions 110.9 111.2 111.5 113.8<br />
Expectations 94.0 94.2 95.5 97.2<br />
<strong>BNP</strong> Paribas Forecast: Moderate Decline<br />
Germany: Ifo Business Climate (September)<br />
Release Date: Monday 24 September<br />
The Ifo business climate index decreased for the fourth<br />
month running in August. The assessment of the current<br />
situation worsened, with the index standing at 102.3, only 2<br />
points above its long-term average.<br />
Expectations for the half year to come deteriorated, too. Ifo<br />
underscored that it was the first time in three years that<br />
export expectations had declined.<br />
We expect a further deterioration in both indicators in the<br />
September print, although the scope of the decline should<br />
continue to slow. The September surveys could be<br />
somewhat volatile, though, because a number of key events<br />
happened during the survey period, including the German<br />
Constitutional Court ruling on the ESM. We expect the<br />
uncertainty surrounding the ruling, as well as the negative<br />
public response to the ECB’s announcement of a bondbuying<br />
programme, to affect business sentiment in<br />
September. In October, however, we should see some<br />
improvement.<br />
Key Point:<br />
The deterioration is likely to continue in September, but<br />
things should improve after that.<br />
Sources: Reuters EcoWin Pro<br />
Chart 4: US Consumer Confidence<br />
Sep (f) Sep 2H (f) Sep p Aug<br />
Conference Board 64.0 – – 60.6<br />
Michigan Sentiment 78.0 76.8 79.2 74.3<br />
<strong>BNP</strong> Paribas Forecast: Rising Confidence<br />
US: Consumer Confidence (September)<br />
Release Date: Tuesday 25 September<br />
The University of Michigan index of consumer confidence<br />
jumped 4.9 index points in the beginning of September and<br />
reached the highest level since May, which was the highest<br />
reading in this cycle. The index surged in the first half of<br />
September, despite the negative news heard, particularly<br />
about labour market developments and climbing prices at<br />
the pump. The recent improvement in financial conditions,<br />
following the new monetary policy stimulus that was<br />
introduced by the Fed (and reflected in stock prices),<br />
should boost consumers’ optimism. We estimate the<br />
Conference Board index to increase to 64.0 in September<br />
from 60.6 in August.<br />
.<br />
Key Point:<br />
The Conference Board index is expected to show a solid<br />
increase on the back of a strong pick-up in stocks, after the<br />
new Fed stimulus implemented last week, which should<br />
outweigh the negative news heard, particularly about labour<br />
market developments and climbing prices at the pump.<br />
Market Economics 20 September 2012<br />
Market Mover<br />
46<br />
www.GlobalMarkets.bnpparibas.com
Key Data Preview<br />
Chart 5: German Headline and Core CPI<br />
Sources: Reuters EcoWin Pro<br />
Sep (f) Aug Jul Jun<br />
HICP (% m/m) -0.1 0.4 0.4 -0.2<br />
HICP (% y/y) 2.0 2.2 1.9 2.0<br />
CPI (% y/y) 1.9 2.1 1.7 1.7<br />
<strong>BNP</strong> Paribas Forecast: Slowing Again<br />
Germany: ‘Flash’ CPI and HICP (September)<br />
Release Date: Wednesday 26 September<br />
German consumer price inflation accelerated relatively<br />
dramatically in August. The HICP index posted a 0.4% m/m<br />
increase, driving annual inflation up to 2.2% y/y from 1.9% in<br />
July. One of the key drivers was transport prices. Core<br />
prices, meanwhile, only increased 0.2% m/m, leaving the<br />
annual inflation rate unchanged at 1.2% y/y.<br />
For the September prints, we expect a contraction of<br />
0.2% m/m in core prices, mainly due to the end of the<br />
summer season and its effect on leisure-related services<br />
prices. That should, again, leave core inflation unchanged in<br />
annual terms. Looking beyond that, we do not expect<br />
significant changes in core inflation before mid-2013.<br />
In September, we expect the effect on annual inflation of the<br />
surge in transport prices to be partly offset in September, so<br />
this should contribute less to the headline inflation rate than<br />
in August. The headline HICP index should therefore contract<br />
0.1% m/m and annual inflation should slow again to 2.0%.<br />
Key Point:<br />
The transport price surge in August should be partly<br />
offset in September. Core price inflation should remain<br />
unchanged.<br />
Chart 6: French Household Confidence & Elections <strong>BNP</strong> Paribas Forecast: Weaker<br />
115<br />
110<br />
105<br />
100<br />
95<br />
2002<br />
2007<br />
1995<br />
1988<br />
1981<br />
90<br />
2012<br />
85<br />
Presidential<br />
election<br />
month<br />
80<br />
0 1 2 3 4 5 6 7 8 9 10 11 12<br />
Source: Reuters EcoWin Pro<br />
Index (sa) Sep (f) Jul Jun Sep 11<br />
Overall (normalised index) 86 87.0 89.5 81.4<br />
Buying opportunity<br />
(diffusion index)<br />
-28 -26 -20 -26<br />
Key Point:<br />
The post-election feel-good factor is likely to wane<br />
further. The willingness to spend could fall to extremely<br />
low levels.<br />
France: Household Confidence (September)<br />
Release Date: Wednesday 26 September<br />
As usual, in France, there was no household confidence<br />
survey conducted in August due to the summer holidays.<br />
Consequently, we will have to compare the September data<br />
with July’s result.<br />
Back in March, when the French public realised that a<br />
change of government was a sure thing, confidence soared.<br />
The strongest gains were seen in surveys on future personal<br />
financial situation and future nationwide standard of living.<br />
These hopes have since been dashed and we expect a<br />
further decline in both items.<br />
Although confidence has been very low by historical<br />
standards since the start of the year, we expect it to weaken<br />
even more. The ECB’s bond-buying announcement and a cut<br />
in the tax on petrol have probably not been sufficient to have<br />
a material positive effect on confidence.<br />
What’s more, the situation in the labour market has<br />
worsened, according to the latest data, and all this is likely to<br />
weigh on purchasing plans. At -28, the diffusion index of<br />
willingness to make important purchases is expected to fall<br />
very close to the lowest print of the last three-and-a-half<br />
years, at -29.<br />
Market Economics 20 September 2012<br />
Market Mover<br />
47<br />
www.GlobalMarkets.bnpparibas.com
Key Data Preview<br />
12.5<br />
10.0<br />
7.5<br />
5.0<br />
2.5<br />
0.0<br />
Chart 7: Eurozone M3 & Bank Lending<br />
Bank Lending to<br />
Private Sector<br />
M3<br />
(% y/y)<br />
-2.5<br />
92 93 94 95 96 97 98 99 00 01 02 03 04 05 06 07 08 09 10 11 12<br />
Sources: Reuters EcoWin Pro<br />
% y/y Aug (f) Jul Jun May<br />
M3 3.2 3.8 3.2 3.1<br />
M3 (3-mth avg.) 3.4 3.4 3.0 3.0<br />
Private-Sector Loans -0.2 0.1 -0.2 -0.1<br />
Key Point:<br />
The growth rate in M3 has picked up, but bank lending<br />
to the private sector remains very weak.<br />
<strong>BNP</strong> Paribas Forecast: Still Soft<br />
Eurozone: Monetary Developments (August)<br />
Release Date: Thursday 27 September<br />
The y/y growth rate in M3 has accelerated markedly in recent<br />
months (see chart). The 3.8% y/y rise in July was the highest<br />
in more than three years. The principal reason is the pickup<br />
in the y/y growth rate of overnight deposits, which almost<br />
trebled in the period from April to July (rising to 4.5%). In turn,<br />
this is a reflection of a preference for liquidity in an<br />
environment of high uncertainty and low interest rates.<br />
The divergence between growth in M3 and bank lending to<br />
the private sector has become more pronounced (see chart).<br />
The latter remains weak. The key reason for the divergence<br />
is the pickup in bank lending to governments (i.e. sovereign<br />
debt purchases), which expanded by 9.4% y/y in July.<br />
The y/y rate of change in bank lending to the private sector<br />
has been hovering around zero since the spring. While the<br />
ECB’s Bank Lending Survey has shown a moderation in the<br />
tightening of credit conditions, the demand for loans remains<br />
weak across all sectors.<br />
The y/y rate of change in mortgage lending to households<br />
was stable at just 0.8% in July, well below the peak (of 4.5%<br />
in March 2011). The y/y change in consumer credit has been<br />
sub-zero (-2.0% in July) for more than three years. Lending<br />
growth to non-financial corporates also contracted in y/y<br />
terms in July (-0.4%) for the second straight month.<br />
Chart 8: Eurozone ESI Country Comparison<br />
Sources: Reuters EcoWin Pro<br />
Sep (f) Aug Jul Jun<br />
Economic Sentiment 85.7 85.8 87.9 89.9<br />
Industry Sentiment -15.0 -15.3 -15.1 -12.8<br />
<strong>Services</strong> Sentiment -10.3 -10.8 -8.5 -7.4<br />
Consumer Confidence -24.0 -24.6 -21.5 -19.8<br />
<strong>BNP</strong> Paribas Forecast: Moderate Decline<br />
Eurozone: Economic Sentiment Indicator (September)<br />
Release Date: Thursday 27 September<br />
Economic sentiment in the eurozone continued to deteriorate<br />
in August. The country breakdown showed that sentiment<br />
deteriorated most in the ‘big’ eurozone countries (Spain, Italy<br />
and Germany), with France a notable exception. Sector-wise,<br />
the deterioration was strongest in the retail trade and<br />
construction sector, as well on the consumer side.<br />
In September, we will take a careful look at the country<br />
breakdown once again. We expect the aggregate headline<br />
figure to remain nearly unchanged for the eurozone, but the<br />
trends in the individual countries could differ once again.<br />
The theme of recent months has been the ‘catch-down’ in<br />
sentiment in Germany, with the deterioration driven primarily<br />
by a weak industry sector. Here, growth prospects have been<br />
significantly affected by weakening new orders. Industrials<br />
had relied heavily on a backlog of work to smooth activity in<br />
the sector. But although German sentiment has weakened<br />
sharply of late, it still remains one of the most buoyant in the<br />
eurozone, suggesting that although growth may slow in the<br />
eurozone’s biggest economy, it is still set to outperform.<br />
Key Point:<br />
Economic sentiment should stabilise on aggregate in<br />
the eurozone, but the disparities between individual<br />
countries will persist.<br />
Market Economics 20 September 2012<br />
Market Mover<br />
48<br />
www.GlobalMarkets.bnpparibas.com
Key Data Preview<br />
Chart 9: German ESI Employment Expectations<br />
Sources: Reuters EcoWin Pro<br />
Unemployment Sep (f) Aug Jul Jun<br />
Change (‘000) 2 9 9 7<br />
Rate (%)) 6.8 6.8 6.8 6.8<br />
<strong>BNP</strong> Paribas Forecast: Easing Pressure<br />
Germany: Labour-Market Data (September)<br />
Release Date: Thursday 27 September<br />
The tightness of the German labour market is the key driver<br />
of the relatively stable consumer confidence in Germany.<br />
Confidence in the employment situation, coupled with higher<br />
real disposable income, is stabilising consumer demand and<br />
contributing to growth.<br />
However, the survey data suggest that hiring is gradually<br />
grinding to a halt. The PMI employment components have<br />
been oscillating around 50 for several months, while the<br />
European Commission’s economic sentiment subcomponents<br />
have also been signalling slowing labour-market<br />
dynamics. Consequently, German unemployment has risen<br />
for five months in a row now, and we expect another<br />
moderate increase in September, though this will not yet<br />
affect the unemployment rate.<br />
Looking ahead, we do not expect a major deterioration.<br />
Conditions will loosen compared with a year ago, but will<br />
remain relatively tight on an historical basis.<br />
Key Point:<br />
Tensions in the labour market will ease, but overall,<br />
unemployment will remain at historically low levels.<br />
6<br />
4<br />
2<br />
0<br />
-2<br />
-4<br />
Chart 10: Portuguese Economic Climate<br />
GDP<br />
% y/y<br />
Economic Climate<br />
Indicator<br />
( 3mth Avg)<br />
-6<br />
Mar-98 Sep-99 Mar-01 Sep-02 Mar-04 Sep-05 Mar-07 Sep-08 Mar-10 Sep-11<br />
Sources: Reuters EcoWin Pro<br />
% y/y Sep (f) Aug Jul Jun<br />
Economic Climate -4.2 -4.0 -4.4 -4.6<br />
<strong>BNP</strong> Paribas Forecast: Further Contraction<br />
Portugal: Economic Climate (September)<br />
Release Date: Thursday 27 September<br />
Portugal’s economic climate indicator is likely to fall to -4.2 in<br />
September from -4.0 in August, by our estimates. This will be<br />
the first pickup in the pace of contraction since January.<br />
This bigger fall will come mostly on the back of increasing<br />
uncertainty over the need for further austerity measures in<br />
the last quarter of 2012 or early 2013.<br />
The deceleration in exports due to a contraction in economic<br />
activity in Portugal’s main eurozone trading partners (mainly<br />
Spain) should also take its toll and contribute to the decline in<br />
Portuguese economic activity<br />
The economic climate indicator suggests a slower pace of<br />
decline in GDP in Q3 after an expected contraction of 1.2%<br />
q/q in Q2. In Q4, we expect the weakening to continue,<br />
though at a faster pace, as wage and pension cuts, in<br />
particular, are felt later in the year.<br />
Key Point:<br />
Contraction to intensify has exports are likely to slow<br />
and domestic demand is likely to fall further.<br />
Market Economics 20 September 2012<br />
Market Mover<br />
49<br />
www.GlobalMarkets.bnpparibas.com
Key Data Preview<br />
Chart 11: US Durable Goods Orders vs Shipments<br />
(% 3m/3m saar)<br />
40<br />
20<br />
0<br />
-20<br />
-40<br />
-60<br />
% 3m/3m ar<br />
Core Shipments<br />
Core Capital Goods Orders<br />
Feb 01 Feb 03 Feb 05 Feb 07 Feb 09 Feb 11<br />
Sources: Reuters EcoWin Pro<br />
% m/m Aug (f) Jul Jun May<br />
Durable Goods -4.9 4.1 1.6 1.5<br />
Ex-Transport 0.1 -0.6 -2.2 0.7<br />
Core Cap Goods Ship -1.0 -0.5 1.4 1.0<br />
<strong>BNP</strong> Paribas Forecast: A Boeing Drop<br />
US: Durable Goods (August)<br />
Release Date: Thursday 27 September<br />
Durable goods orders are expected to fall by 4.9% m/m in<br />
August, as Boeing orders totalled a whopping 1 order for the<br />
month, after an impressive 260 in the prior month. Boeing<br />
orders had been a source of strength previously, averaging<br />
164.6 orders from November to March; however, with just 36<br />
orders accumulated between April and June, that strength<br />
looked to have been fading until the July pop. We will look<br />
closely at the trend over the coming months. Meanwhile,<br />
excluding transportation, orders should be decent with a<br />
0.1% m/m gain for August, although the 3m/3m saar trend is<br />
expected to contract at a 9.1% pace in the month.<br />
Core capital goods shipments (shipments ex-defence and<br />
aircraft) are expected to decline by 1.0% in an atypical<br />
second month of the quarter, however, moving in line the 3m<br />
trend in core capital goods orders. In all, we see the pace of<br />
shipments slowing in Q3, although still contributing positively<br />
to GDP growth, but with some significant risks that Q4 could<br />
move into negative territory.<br />
Key Point:<br />
In August, just one Boeing order came in for the month,<br />
which is expected to drag the headline print into<br />
negative territory. Meanwhile, core capital goods<br />
shipments are expected to be in line with the negative<br />
trend in core orders.<br />
3<br />
2<br />
1<br />
0<br />
-1<br />
-2<br />
-3<br />
Chart 12: Japanese Core CPI (% y/y)<br />
CPI excluding energy and<br />
food, but not alcohol<br />
Core CPI<br />
05 06 07 08 09 10 11 12<br />
Sources: MIC, <strong>BNP</strong> Paribas<br />
% y/y Aug (f) Jul Jun May<br />
Core CPI -0.3 -0.3 -0.2 -0.1<br />
CPI -0.6 -0.4 -0.2 0.2<br />
Key Point:<br />
With petroleum product inflation decelerating on the<br />
drop in crude oil prices in May and June, we expect core<br />
CPI to have remained soft through August.<br />
<strong>BNP</strong> Paribas Forecast: Slight Decline<br />
Japan: CPI (National, August)<br />
Release Date: Friday 28 September<br />
Based on the Tokyo CPI report for August, and after making<br />
allowances for its disparities with other areas, we estimate<br />
that national core CPI inflation in August should have<br />
remained unchanged from July at -0.3% y/y. In July, the<br />
index’s rate of decline expanded 0.1pp from June, as the<br />
drop in the crude oil price in May and June caused price<br />
growth for petroleum products to decelerate substantially.<br />
While US-style core-core CPI inflation (excluding energy and<br />
food, but not alcohol) was unchanged for a third straight<br />
month at -0.6%, other price-trend indicators showed a<br />
modest deterioration, including the “10% trimmed mean CPI”<br />
(which excludes the top and bottom one-tenth of components<br />
ranked by the size of year-on-year price changes), which has<br />
been slightly below zero since May. But with energy prices<br />
stabilising in August (the month-on-month declines ended)<br />
thanks to higher electricity rates and the rebound in<br />
petroleum product prices in July-August, we expect energy<br />
prices at the national level to have risen in September,<br />
allowing the core CPI to recover.<br />
Market Economics 20 September 2012<br />
Market Mover<br />
50<br />
www.GlobalMarkets.bnpparibas.com
Key Data Preview<br />
Chart 13: Japanese Unemployment Rate (% sa)<br />
5.7<br />
5.5<br />
5.3<br />
5.1<br />
4.9<br />
4.7<br />
4.5<br />
4.3<br />
4.1<br />
3.9<br />
3.7<br />
3.5<br />
00 01 02 03 04 05 06 07 08 09 10 11 12<br />
Sources: MIC, <strong>BNP</strong> Paribas<br />
<strong>BNP</strong> Paribas Forecast: Unchanged<br />
Japan: Unemployment Rate (August)<br />
Release Date: Friday 28 September<br />
We expect the jobless rate for August to be unchanged from<br />
July at 4.3%. Despite some degree of support from latent<br />
demand from the nursing-healthcare industry, employment<br />
conditions are likely to have started to weaken gradually, as<br />
factory-sector activity remains flat because of the slowing<br />
global economy and the effects of reconstruction demand at<br />
home are waning. There are signs that job offers, which have<br />
continued to steadily rise, could also be weakening. Even so,<br />
because the effects of a rapidly greying population continue<br />
to weigh on the jobless rate, the unemployment rate moving<br />
forward should basically remain flat or modestly on the<br />
decline.<br />
% sa Aug (f) Jul Jun May<br />
Unemployment rate 4.3 4.3 4.3 4.4<br />
Key Point:<br />
Although employment conditions are likely to start<br />
weakening, the unemployment rate should stay flat or<br />
modestly on the decline, as the effects of a rapidly<br />
greying society continuing to weigh on the jobless rate.<br />
Chart 14: Japanese Production and Exports<br />
120<br />
115<br />
110<br />
105<br />
100<br />
95<br />
90<br />
85<br />
80<br />
75<br />
70<br />
65<br />
(2005=100, seasonally adjusted)<br />
Production<br />
00 01 02 03 04 05 06 07 08 09 10 11 12<br />
Sources: METI. MOF, <strong>BNP</strong> Paribas<br />
Exports (RHS)<br />
Industrial production Aug (f) Jul Jun May<br />
% m/m -0.7 -1.0 0.4 -3.4<br />
Key Point:<br />
With external demand dropping a further notch and<br />
domestic car sales already tumbling, production in<br />
August is likely to have been weak.<br />
150<br />
140<br />
130<br />
120<br />
110<br />
100<br />
90<br />
80<br />
70<br />
60<br />
50<br />
<strong>BNP</strong> Paribas Forecast: Decline<br />
Japan: Industrial Production (August)<br />
Release Date: Friday 28 September<br />
We expect industrial production to have fallen 0.8% m/m in<br />
August (-1.0% in July), a second straight contraction.<br />
Corrected for the distortions that have plagued METI’s<br />
seasonally adjusted data, factory output has been generally<br />
trending sideways, but we project that even without<br />
distortions, production should have declined in August. The<br />
reason for the weakness is not the supply constraints<br />
resulting from reduced summertime power consumption,<br />
which have had only a marginal impact, but rather the<br />
floundering of demand. Until now, weakness in overseas<br />
demand has largely been offset by fiscal policy factors such<br />
as the reconstruction-related spending and eco-car<br />
subsidies. But with external demand dropping again<br />
(previously firm exports to US have started falling) and<br />
domestic car sales tumbling even before subsidy programme<br />
ends in September, production in August is likely to have<br />
been weak. While the forecast index projects a further<br />
sideways movement of 0.1% m/m, the actual outturn should<br />
be a contraction. Although we do not expect overall factory<br />
activity to enter into a pronounced slowdown as long as the<br />
global economy avoids a shock, such as a further deepening<br />
of the European crisis, industrial output seems set to soften<br />
further in the coming months owing to weakness in the global<br />
economy and fallout at home from plunging cars sales.<br />
Market Economics 20 September 2012<br />
Market Mover<br />
51<br />
www.GlobalMarkets.bnpparibas.com
Key Data Preview<br />
8<br />
7<br />
6<br />
5<br />
4<br />
3<br />
2<br />
1<br />
0<br />
Chart 15: Eurozone HICP Inflation<br />
Frequency of revisions to flash estimate by 0.1pp or more since 2001<br />
(to 1d.p.), by month<br />
Final higher than flash<br />
Final lower than flash<br />
Jan Feb Mar Apr May Jun Jul Aug Sep Oct Nov Dec<br />
Sources: Reuters EcoWin Pro<br />
Sep (f) Aug Jul Jun<br />
HICP All Items (% y/y) 2.6 2.6 2.4 2.4<br />
HICP All Items (% m/m) 0.7 0.4 -0.1 0.1<br />
Key Point:<br />
Tax effects should be broadly offsetting this month, and<br />
we expect no change to the headline rate.<br />
<strong>BNP</strong> Paribas Forecast: Stable<br />
Eurozone: HICP (September)<br />
Release Date: Friday 28 September<br />
Inflation accelerated across the eurozone in August, primarily<br />
as a result of rising fuel prices. The headline All Items rate<br />
ticked up to 2.6% y/y from 2.4%, a level it had stabilised at for<br />
the previous three months. Food price inflation was broadly<br />
unchanged, while core price inflation fell 0.2pp to 1.5% y/y: the<br />
first time core inflation had moderated since January.<br />
September is typically a strong month for core prices,<br />
although the balance of items going up in price versus those<br />
being discounted as summer makes way for autumn means<br />
greater potential for volatility and/or revisions of preliminary<br />
estimates (see chart). On the one hand, clothing prices<br />
should rise strongly as the sale of full-price autumn-winter<br />
stock gets underway. New furnishings and household goods<br />
should also boost core prices, as should annual educational<br />
fee increases. Acting to push inflation down will be holidayrelated<br />
goods and services, including airfares.<br />
An additional unknown this month is the Spanish VAT hike,<br />
which became effective on 1 September. Assuming that we<br />
see most of the expected pass-through in the September<br />
figures, we expect a 1.3pp boost to Spanish HICP inflation,<br />
which would add 0.2pp to eurozone All Items HICP inflation<br />
this month. This should broadly offset any downward<br />
pressure from the Italian VAT hike of the previous September<br />
dropping out of year-on-year comparisons, meaning core<br />
inflation spends a second month at 1.5% y/y.<br />
115<br />
110<br />
105<br />
100<br />
95<br />
Chart 16: French Retail Sales Breakdown<br />
Indices<br />
2005=100<br />
Food<br />
Cars<br />
Total Retail Sales<br />
Energy<br />
90<br />
Jan May Sep Jan May Sep Jan May Sep Jan May Sep Jan<br />
08 09 10 11 12<br />
Source: INSEE, Reuters EcoWin Pro<br />
Volume (sa-wda) Aug (f) Jul (f) Jun Aug 11<br />
% m/m -1.5 0.3 0.1 0.5<br />
% y/y -1.2 0.7 0.2 0.5<br />
Key Point:<br />
Average sales for July and August are likely to be weak.<br />
<strong>BNP</strong> Paribas Forecast: Weak<br />
France: Retail Sales (July and August)<br />
Release Date: Friday 28 September<br />
As they are every year, French retail sales data for July<br />
and August will be published together, as the data are<br />
collected simultaneously in September. This should<br />
provide us with a major piece of information for the Q3<br />
GDP outlook on the day when the revised growth data for<br />
Q2 are released (we expect a downward revision from<br />
unchanged to -0.1% q/q).<br />
The unpredictable weather, cold and rainy in July, warm and<br />
sunny in August, may have caused some volatility in the<br />
consumption of food and energy. The cut in taxes on petrol<br />
may also have prompted some people to postpone refuelling<br />
their cars until early September. Car registrations were poor<br />
in both months, continuing the trend we have seen since the<br />
start of the year. The Bank of France's retailer survey<br />
suggests that demand for manufactured goods was relatively<br />
strong in July, but very weak in August, as people were<br />
keener to hit the shopping malls on rainy days.<br />
Our forecast reflects this evolution, with a gain in July<br />
followed by a collapse in August. For a fair assessment of the<br />
economic situation, we should look at the average of the two<br />
months, and this is likely to be weak, probably below the<br />
2011 average.<br />
Market Economics 20 September 2012<br />
Market Mover<br />
52<br />
www.GlobalMarkets.bnpparibas.com
Key Data Preview<br />
7000<br />
6500<br />
6000<br />
5500<br />
5000<br />
4500<br />
Chart 17: US Real PCE <strong>Services</strong><br />
Real Consumer Spending on <strong>Services</strong> (USD bn)<br />
4000<br />
95 95 96 97 98 99 00 01 02 03 04 05 06 06 07 08 09 10 11<br />
Sources: Reuters EcoWin Pro<br />
% m/m Aug (f) Jul Jun May<br />
Personal Income 0.2 0.3 0.3 0.3<br />
Consumption 0.3 0.4 0.0 -0.2<br />
Core PCE Prices 0.1 0.0 0.2 0.1<br />
Key Point:<br />
Nominal consumer spending should post a moderate<br />
increase in August on higher energy prices. Real<br />
spending and core inflation should be weak.<br />
<strong>BNP</strong> Paribas Forecast: Subdued Gain in Spending<br />
US: Personal Income & Spending (August)<br />
Release Date: Friday 28 September<br />
Nominal personal spending is expected to register a 0.3% gain<br />
in August, driven by higher energy prices. Meanwhile, real<br />
spending is expected to post a small decline. Auto sales<br />
posted a solid gain in August; however, virtually every other<br />
category of spending should be weak. Core retail sales fell<br />
back in August, and utility output plunged, which should weigh<br />
on services spending. The projected weakness in August<br />
comes after a solid 0.4% gain in July, and on balance,<br />
consumer spending is expected to grow moderately in Q2<br />
Personal income is forecast to increase 0.2% in August after<br />
rising 0.3% in July. Hours worked grew a modest 0.1%, and<br />
average hourly earnings were essentially flat, pointing to a<br />
subdued increase in wage income. With income growing just<br />
a touch slower than spending, the personal savings rate<br />
should post a small decline in the month.<br />
We think that the headline PCE deflator will rise 0.4%, on<br />
higher gas prices, pushing the annual pace to rise to 1.5%<br />
from 1.3%. Meanwhile, core inflation is expected to rise<br />
0.1%, with the annual pace edging down to 1.5% from 1.6%.<br />
This cooling in core pricing should further increase the Fed’s<br />
confidence that there are few indications of incipient inflation<br />
pressures.<br />
Market Economics 20 September 2012<br />
Market Mover<br />
53<br />
www.GlobalMarkets.bnpparibas.com
Economic Calendar: 1 – 26 October<br />
1 Oct 2 Oct 3 Oct 4 Oct 5 Oct<br />
Australia: Holiday<br />
Japan: BoJ Tankan Sep<br />
Eurozone: Manufacturing<br />
PMI (Final) Sep, Labour<br />
Aug<br />
UK: CIPS Manufacturing<br />
Sep, Net Consumer Credit<br />
Aug, Mortgages Aug, M4<br />
Aug<br />
Germany: Retail Sales<br />
Aug<br />
Switz: Manufacturing PMI<br />
Sep<br />
US: Construction Aug,<br />
ISM Manufacturing Sep<br />
Australia: RBA Rate<br />
Announcement<br />
Eurozone: PPI Aug<br />
US: Vehicle Sales Sep<br />
Australia: Trade Balance<br />
Aug<br />
Eurozone: <strong>Services</strong> PMI<br />
(Final) Sep, Retail Sales<br />
Aug<br />
UK: CIPS <strong>Services</strong> Sep<br />
Germany: Holiday<br />
US: ADP Sep, ISM Non-<br />
Manufacturing Sep,<br />
FOMC Minutes<br />
Australia: Retail Sales<br />
Aug<br />
Eurozone: ECB Rate<br />
Announcement & Press<br />
Conference<br />
UK: BoE Rate<br />
Announcement<br />
Neths: CPI Sep<br />
US: Challenger Layoffs<br />
Sep, Factory Orders Aug<br />
During Week: UK Halifax House Prices Sep<br />
8 Oct 9 Oct 10 Oct 11 Oct 12 Oct<br />
Holiday: Japan, US,<br />
Canada<br />
Germany: Industrial<br />
Production Aug, Trade<br />
Balance Aug<br />
Switz: CPI Sep<br />
Australia: NAB Business<br />
Survey Sep<br />
Japan: Current Account<br />
Aug<br />
UK: IP Aug, BRC Retail<br />
Sales Monitor Sep, Trade<br />
Balance Aug, RICS<br />
House Price Balance Sep<br />
France: Budget Balance<br />
Aug, Trade Balance Aug<br />
Italy: GDP (Final) Q2<br />
Neths: IP Aug<br />
US: NFIB Optimism Sep<br />
Australia: Westpac<br />
Consumer Confidence<br />
Oct<br />
France: IP Aug<br />
Italy: IP Aug<br />
Sweden: IP Aug<br />
Norway: CPI Sep, PPI<br />
Sep<br />
US: Beige Book,<br />
Wholesale Trade Aug<br />
Australia: Labour Sep<br />
Japan: BoJ Monetary<br />
Policy Meeting Minutes,<br />
Machinery Orders Aug<br />
Eurozone: ECB Bulletin<br />
Germany: CPI (Final) Sep<br />
France: CPI Sep<br />
Spain: CPI (Final) Sep<br />
Portugal: HICP Sep<br />
Sweden: CPI Sep, PES<br />
Labour Sep<br />
US: Import Prices Sep,<br />
Trade Balance Aug,<br />
Treasury Statement Sep<br />
During Week: Germany WPI Sep, France BoF Survey Sep<br />
15 Oct 16 Oct 17 Oct 18 Oct 19 Oct<br />
US: Empire<br />
Manufacturing Survey<br />
Oct, Retail Sales Sep,<br />
Business Inventories Aug<br />
Australia: RBA MPC<br />
Minutes<br />
Eurozone: HICP Sep,<br />
Trade Balance Aug,<br />
EU27 New Car<br />
Registrations Sep<br />
UK: ONS HPI Aug, CPI<br />
Sep, PPI Sep<br />
Germany: ZEW Oct<br />
Italy: EU Trade Balance<br />
Aug<br />
Neths: Retail Sales Aug<br />
US: CPI Sep, TICS Data<br />
Aug, IP Sep, NAHB HPI<br />
Oct<br />
UK: BoE Minutes, Labour<br />
Sep<br />
US: Housing Starts Sep<br />
Eurozone: Governing<br />
Council Meeting (No Rate<br />
Announcement)<br />
UK: Retail Sales Sep<br />
Neths: Consumer<br />
Confidence Oct, Labour<br />
Sep<br />
Belgium: Consumer<br />
Confidence Oct<br />
Sweden: Labour Sep<br />
US: Philly Fed Survey<br />
Oct, Leading Indicators<br />
Sep<br />
During Week: UK CBI Monthly Industrial Trends Oct<br />
22 Oct 23 Oct 24 Oct 25 Oct 26 Oct<br />
Japan: Trade Balance<br />
Sep<br />
Eurozone: Consumer<br />
Confidence (Prel) Oct<br />
France: Business Survey<br />
Oct<br />
Italy: Non-EU Trade<br />
Balance (Prel) Sep<br />
Belgium: Business<br />
Confidence Oct<br />
Canada: BoC Rate<br />
Announcement<br />
Australia: CPI Q3<br />
Eurozone: PMIs (Flash)<br />
Oct<br />
Germany: Ifo Survey Oct<br />
France: Job Seekers Sep<br />
Italy: Consumer<br />
Confidence Oct<br />
US: FOMC Rate<br />
Announcement, New<br />
Home Sales Sep, FHFA<br />
HPI Aug<br />
Canada: BoC Monetary<br />
Policy Report<br />
Eurozone: Monetary<br />
Developments Sep<br />
UK: GDP (Prel) Q3<br />
Italy: Wages Sep, Retail<br />
Sales Aug<br />
Spain: PPI Sep<br />
Neths: Producer<br />
Confidence Oct<br />
Sweden: Riksbank Rate<br />
Announcement &<br />
Monetary Policy Report,<br />
Consumer Confidence<br />
Oct, PPI Sep<br />
US: Durable Goods<br />
Orders Sep, Pending<br />
Home Sales Sep<br />
Japan: BoJ Rate<br />
Announcement<br />
Eurozone: GDP (Final)<br />
Q2<br />
Germany: Factory Orders<br />
Aug, GDP (Final) Q2<br />
Spain: Industrial<br />
Production Aug<br />
Portugal: Holiday<br />
Norway: Industrial<br />
Production Aug<br />
US: Labour Sep,<br />
Consumer Credit Aug<br />
Canada: Labour Sep<br />
Japan: M2 Sep, Tertiary<br />
Index Aug, CGPI Sep<br />
Eurozone: IP Aug<br />
France: Current Account<br />
Aug<br />
Italy: CPI (Final) Sep<br />
Spain: Holiday<br />
Sweden: Current Account<br />
Aug<br />
US: PPI Sep, UoM<br />
Sentiment (Prel) Oct<br />
Eurozone: Current<br />
Account Aug<br />
UK: PSNB Sep, PSNCR<br />
Sep<br />
Germany: PPI Sep<br />
Italy: Industrial Orders<br />
Aug<br />
US: Existing Home Sales<br />
Sep<br />
Canada: CPI Sep<br />
Japan: CPI Tokyo Oct,<br />
CPI National Sep<br />
Eurozone: Eurocoin Oct<br />
Germany: GfK Consumer<br />
Confidence Nov<br />
France: Consumer<br />
Confidence Oct<br />
Italy: Business Confidence<br />
Oct<br />
Spain: Labour Q3<br />
Switz: KOF Leading<br />
Indicator Oct<br />
US: GDP (Adv) Q3, UoM<br />
Sentiment (Final) Oct<br />
During Week: UK CBI Reported Sales Oct, Germany Import Prices Sep<br />
Source: <strong>BNP</strong> Paribas<br />
Release dates as of c.o.b. prior to the date of this publication. See our Daily Spotlight for any revisions.<br />
Market Economics 20 September 2012<br />
Market Mover<br />
54<br />
www.GlobalMarkets.bnpparibas.com
Treasury and SAS Issuance Calendar<br />
This publication is classified as non-objective research<br />
In the pipeline - Treasuries:<br />
Italy: To issue a new CTZ Sep 14 in Q3<br />
UK: DMO will consider scheduling up to two gilt mini-tenders in Q4<br />
UK: Gilt 30-year (new, syndicated) to be offered in the second half of October (details a month in advance)<br />
UK: Index-Linked Gilt to be offered via syndication in the second half of November (details a month in advance)<br />
Finland: Likely to arrange 1 or 2 tap auctions in H2<br />
During the week:<br />
UK: Index-Linked Gilt 0.25% Mar 2052 (new, syndicated)<br />
FHLMC: Second Optional Reference Notes announcement in September on Thursday 27<br />
Date Day Closing Country Issues Details <strong>BNP</strong>P forecasts<br />
Local GMT<br />
21/09 Fri 11:00 15:00 US Outright Treasury Coupon Purchase (Nov22-Feb31) USD 1.5-2bn<br />
24/09 Mon 11:00 09:00 Norway NGB 4.5% 22 May 2019 (NST 473) NOK 2bn<br />
14:45 13:45 UK Gilt Purchase (7 Gilts 2016-2019) GBP 1bn<br />
12:00 10:00 Belgium OLO 3.50% 28 Jun 2017 (OLO 63)<br />
OLO 3.00% 28 Sep 2019 (OLO 67)<br />
OLO 4.25% 28 Sep 2021 (OLO 61)<br />
21 Sep EUR 2-3bn<br />
OLO 4.25% 28 Sep 2022 (OLO 65)<br />
11:00 15:00 US Outright Treasury Coupon Purchase (Feb36-Aug42) USD 1.5-2bn<br />
25/09 Tue 12:00 03:00 Japan JGBs 10-year Auction for Enhanced-liquidity issue<br />
289-319; 7 issues excl<br />
JGBs 20-year Auction for Enhanced-liquidity<br />
issue 51-101; 15 issues excl.<br />
JPY 0.3tn<br />
10:55 08:55 Italy CTZ 21 Sep EUR 2.5-3.5bn<br />
BTPeis 21 Sep EUR 1-1.5bn<br />
14:45 13:45 UK Gilt Purchase (15 Gilts 2027-2060) GBP 1bn<br />
Neths DSL 2.5% 15 Jan 2033 EUR 1.5-2.5bn<br />
12:00 16:00 Canada Repurchase of 6 Cash Mgt Bonds (Dec12 to Nov13) CAD 1bn<br />
11:00 15:00 US Outright Treasury Coupon Purchase (Nov20-Aug22) USD 4.50-5.50bn<br />
13:00 17:00 US Notes 0.250% 30 Sep 2014 (new) USD 35bn<br />
26/09 Wed 11:30 09:30 Germany Bund 1.50% 4 Sep 2022 EUR 5bn<br />
14:45 13:45 UK Gilt Purchase (5 Gilts 2020-2025) GBP 1bn<br />
10:15 08:15 Denmark DGB 4% 15 Nov 2012 (Buy-back)<br />
DGB 5% 15 Nov 2013 (Buy-back)<br />
12:00 16:00 Canada CAN 2-year 20 Sep<br />
11:00 15:00 US Outright Treasury Coupon Purchase (Sep18-Aug20) USD 4.25-5bn<br />
13:00 17:00 US Notes 0.625% 30 Sep 2017 (new) USD 35bn<br />
27/09 Thu 12:00 03:00 Japan JGB 15 Oct 2014 JPY 2.7tn<br />
10:55 08:55 Italy 5 & 10y BTPs and possibly CCTeu 24 Sep EUR 6-7bn<br />
13:00 17:00 US Notes 1.125% 30 Sep 2019 (new) USD 29bn<br />
Outright Treasury Coupon Sales (Sep15-Nov15)<br />
USD 7-8bn<br />
28/09 Fri 11:00 15:00 US Outright Treasury Coupon Purchase (Feb36-Aug42) USD 1.5-2bn<br />
01/10 Mon 14:45 13:45 UK Gilt Purchase (3-7 year Gilts) GBP 1bn<br />
02/10 Tue 12:00 03:00 Japan Auction for Enhanced-liquidity 25 Sep JPY 0.3tn<br />
11:00 09:00 Austria RAGBs 25 Sep EUR 1-1.5bn<br />
10:30 09:30 UK Gilt 1.75% 7 Sep 2022 25 Sep GBP 3.5bn<br />
14:45 13:45 UK Gilt Purchase (over 15 year Gilts) GBP 1bn<br />
03/10 Wed 11:30 09:30 Germany OBL 0.50% 13 Oct 2017 (Series 164, date TBC) EUR 4bn<br />
11:00 09:00 Sweden T-bonds 26 Sep SEK 3.5bn<br />
14:45 13:45 UK Gilt Purchase (7-15 year Gilts) GBP 1bn<br />
04/10 Thu 12:00 03:00 Japan JGB 10-year 27 Sep JPY 2.3tn<br />
10:30 08:30 Spain Bonos 28 Sep EUR 3-5bn<br />
10:50 08:50 France OATs 28 Sep EUR 7-9bn<br />
08/10 Mon 11:00 09:00 Norway NGBs 3 Oct<br />
14:45 13:45 UK Gilt Purchase (3-7 year Gilts) GBP 1bn<br />
09/10 Tue 10:30 09:30 UK Gilt 4.25% 7 Jun 2032 2 Oct GBP 2bn<br />
14:45 13:45 UK Gilt Purchase (over 15 year Gilts) GBP 1bn<br />
Neths DSLs EUR 2-2.5bn<br />
10:15 08:15 Denmark DGBs (Tentative date) 4 Oct<br />
13:00 17:00 US Notes 3-year (new) 4 Oct USD 32bn<br />
10/10 Wed 11:30 09:30 Germany Schatz 0.00% 12 Sep 2014 (Date to be confirmed) EUR 5bn<br />
14:45 13:45 UK Gilt Purchase (7-15 year Gilts) GBP 1bn<br />
13:00 17:00 US Notes 10-year 4 Oct USD 21bn<br />
11/10 Thu 12:00 03:00 Japan JGB 30-year 4 Oct JPY 0.7tn<br />
10:55 08:55 Italy 3-year BTP and possibly 15- or 30-year BTP 8 Oct EUR 5-7bn<br />
11:00 09:00 Sweden ILBs 4 Oct SEK 0.5bn<br />
10:30 09:30 UK Index-Linked Gilt 22 Mar 2024 (new) 2 Oct GBP 1.3bn<br />
13:00 17:00 US Bond 30-year 4 Oct USD 13bn<br />
12/10 Fri 12:00 10:00 Belgium ORI (Optional Reverse Inquiry OLO Auction) 11 Oct EUR 0.4bn<br />
Sources: Treasuries, <strong>BNP</strong> Paribas<br />
Interest Rate Strategy 20 September 2012<br />
Market Mover<br />
55<br />
www.GlobalMarkets.bnpparibas.com
This publication is classified as non-objective research<br />
Next week's T-Bills Supply<br />
Date Country Issues Details<br />
21/09 Japan T-Bills Nov 2012 JPY 2.5tn<br />
UK T-Bills Oct 2012 GBP 1bn<br />
T-Bills Dec 2012<br />
GBP 0.5bn<br />
T-Bills Mar 2013<br />
GBP 1.5bn<br />
Canada T-Bill Oct12 (Cash Mgt) (new) CAD 2bn<br />
24/09 France BTFs 21 Sep<br />
Germany Bubills Sep 2013 (new) EUR 3bn<br />
US T-Bills Dec 2012 USD 32bn<br />
T-Bills Mar 2013 (new) USD 28bn<br />
FHLMC Bills 3-month & 6-month 24 Sep<br />
25/09 Spain Letras Dec 2012 24 Sep<br />
Letras Mar 2013<br />
24 Sep<br />
Canada T-Bill Jan 2013 CAD 8.6bn<br />
T-Bill Mar 2013 (new)<br />
CAD 3.2bn<br />
T-Bill Sep 2013 (new)<br />
CAD 3.2bn<br />
US T-Bills 4-week 24 Sep<br />
FHLB Discount Notes<br />
26/09 Italy BOT Mar 2013 21 Sep<br />
Sweden T-Bills Dec 2012 SEK 5bn<br />
T-Bills Mar 2013<br />
SEK 10bn<br />
FNMA Bills 3-month & 6-month 24 Sep<br />
27/09 Japan T-Bills Jan 2013 JPY 5.7tn<br />
Denmark T-Bills 25 Sep<br />
FHLB Discount Notes<br />
28/09 UK T-Bills 21 Sep<br />
Sources: Treasuries, <strong>BNP</strong> Paribas<br />
Next week's Eurozone Redemptions<br />
Date Country Details Amount<br />
28/09 Belgium OLO 5% (OLO 38) EUR 7.7bn<br />
Total Eurozone Long-term Redemption<br />
EUR 7.7bn<br />
26/09 Germany Bubills (12m) EUR 3.0bn<br />
27/09 France BTF EUR 9.4bn<br />
28/09 Italy BOT (6m) EUR 8.5bn<br />
28/09 Neths DTC EUR 6.4bn<br />
Total Eurozone Short-term Redemption EUR 27.3bn<br />
20<br />
15<br />
10<br />
5<br />
0<br />
Next week's Eurozone Coupons<br />
Country<br />
France<br />
Italy<br />
Belgium<br />
Greece<br />
Portugal<br />
Total Long-term Coupon Payments<br />
Chart 1: Investors’ Net Cash Flows<br />
(EUR bn, 10y equivalent)<br />
Net Investors' Cash Flows<br />
(EUR bn , 10y equivalent)<br />
Amount<br />
EUR 0.3bn<br />
EUR 0.4bn<br />
EUR 4.4bn<br />
EUR 0.0bn<br />
EUR 0.5bn<br />
EUR 5.6bn<br />
-5<br />
-10<br />
Comments and charts<br />
• EGBs gross supply is likely to increase further in the<br />
week ahead from already elevated levels. We indeed<br />
expect EUR 22bn of gross supply, up from EUR 19bn,<br />
while only EUR 7.7bn debt will redeem (OLO). In 10y<br />
duration-adjusted terms, this would be equivalent to<br />
EUR 16bn.<br />
• On Monday, Belgium will kick off a busy week with<br />
EUR 2-3bn (forecast) issuance in OLOs Jun-17, Sep-19,<br />
Sep-21 and Sep-22. On Tuesday, Italy will sell CTZ and<br />
BTPeis for forecast amounts of EUR 3bn and EUR<br />
1.5bn respectively. Later on, the Netherlands plan to sell<br />
EUR 1.5-2.5bn of DSL Jan-33. On Wednesday,<br />
Germany will sell EUR 5bn of Bund Sep-22. And on<br />
Thursday, Italy will come back to the market for the sale<br />
of 5y and 10y BTPs and possibly CCTeu, for a forecast<br />
amount of EUR 6-7bn.<br />
• Outside of the eurozone, Norway will sell NOK 2bn<br />
of NGB May-19, the US will sell a new 2y, 5y and 7y<br />
notes for a total of USD 99bn, and Japan will reopen<br />
JGB Oct-14 for JPY 2.7tn. Finally, Canada will raise<br />
cash in a 2y format.<br />
18<br />
16<br />
14<br />
-15<br />
-20<br />
20<br />
18<br />
16<br />
14<br />
12<br />
10<br />
8<br />
6<br />
4<br />
2<br />
0<br />
Week of Sep 17th Week of Sep 24th Week of Oct 1st Week of Oct 8th<br />
Chart 2: EGB Gross Supply Breakdown by<br />
Country (EUR bn, 10y equivalent)<br />
Germany Italy Portugal Belgium<br />
France Spain Netherlands Austria<br />
Finland Greece Ireland<br />
Week of Sep 17th Week of Sep 24th Week of Oct 1st Week of Oct 8th<br />
Chart 3: EGB Gross Supply Breakdown by<br />
Maturity (EUR bn, 10y equivalent)<br />
EGBs Gross Supply (EUR bn, 10y equivalent)<br />
2-3-YR<br />
10-YR<br />
5-7-YR<br />
>10-YR<br />
12<br />
10<br />
8<br />
6<br />
4<br />
2<br />
0<br />
Week of Sep 17th Week of Sep 24th Week of Oct 1st Week of Oct 8th<br />
All Charts Source: <strong>BNP</strong> Paribas<br />
Interest Rate Strategy 20 September 2012<br />
Market Mover<br />
56<br />
www.GlobalMarkets.bnpparibas.com
Central Bank Watch<br />
Interest Rate<br />
EUROZONE<br />
Current<br />
Rate (%)<br />
Minimum Bid Rate 0.75<br />
US<br />
Fed Funds Rate 0 to 0.25<br />
Discount Rate 0.75<br />
JAPAN<br />
Call Rate 0 to 0.10<br />
Basic Loan Rate 0.30<br />
UK<br />
Bank Rate 0.5<br />
DENMARK<br />
Lending Rate 0.20<br />
SWEDEN<br />
Repo Rate 1.25<br />
NORWAY<br />
Sight Deposit Rate 1.50<br />
SWITZERLAND<br />
3 Mth LIBOR Target<br />
Range<br />
CANADA<br />
0 to 0.25<br />
Overnight Rate 1.00<br />
Bank Rate 1.25<br />
AUSTRALIA<br />
Cash Rate 3.50<br />
CHINA<br />
1Y Bank Lending<br />
Rate<br />
BRAZIL<br />
6.00<br />
Selic Overnight Rate 7.50<br />
Date of<br />
Last<br />
Change<br />
-25bp<br />
(5/7/12)<br />
-75bp<br />
(16/12/08)<br />
+25bp<br />
(18/2/10)<br />
-10bp<br />
(5/10/10)<br />
-20bp<br />
(19/12/08)<br />
-50bp<br />
(5/3/09)<br />
-25bp<br />
(5/7/12)<br />
-25bp<br />
(6/9/12)<br />
-25bp<br />
(14/3/12)<br />
-50bp<br />
(3/8/11)<br />
+25bp<br />
(8/9/10)<br />
+25bp<br />
(8/9/10)<br />
-25bp<br />
(6/5/12)<br />
-31bp<br />
(5/7/12)<br />
-50bp<br />
(29/8/12)<br />
Next Change in<br />
Coming 6 Months<br />
-25bp<br />
(6/12/12)<br />
No Change<br />
No Change<br />
No Change<br />
No Change<br />
-25bp<br />
(702/13)<br />
-15bp<br />
(6/12/12)<br />
-25bp<br />
(18/12/12)<br />
No Change<br />
No Change<br />
No Change<br />
No Change<br />
-25bp<br />
(2/10/2012)<br />
-25bp<br />
(Q3 2012)<br />
No Change<br />
Source: <strong>BNP</strong> Paribas<br />
For the full Emerging Market Central Bank Watch, please see our Local Markets Mover.<br />
Comments<br />
Because of the economic outlook, the door is still open for the ECB<br />
to cut policy rates further. We see December as the most likely<br />
timing, in tandem with the staff projections, which will include 2014<br />
for the first time. Downward surprises on the economy and/or a<br />
return to more turbulent markets could prompt an earlier move.<br />
The FOMC announced an aggressive open-ended programme of<br />
quantitative easing at its September meeting. We think the Fed will<br />
end up expanding its balance sheet by an additional USD 1-1.5trn.<br />
It also pushed the forward guidance for the first rate hike into mid-<br />
2015.<br />
Under its de facto flexible inflation-targeting regime, the BoJ will<br />
probably undertake additional easing (increase in JGB<br />
purchases under its asset purchase programme) at a gradual<br />
tempo until the goal of 1% inflation is in sight.<br />
QE was increased by GBP 75bn in October 2011, GBP 50bn in<br />
February 2012 and GBP 50bn in July 2012. We expect another<br />
GBP 50bn in QE in November and again in February 2013. We<br />
also expect a 25bp cut in the Bank Rate in February.<br />
We expect a 15bp cut of the policy rate in December, a smaller<br />
cut than the ECB, to keep the policy rate above zero.<br />
The Riksbank is likely to deliver one more rate cut this year, in<br />
Q4, as economic activity slows and inflation remains low.<br />
Domestic economic conditions continue to strengthen. But, due to<br />
uncertainty stemming from the eurozone, we do not expect a<br />
change in the policy rate this year.<br />
The SNB maintains a minimum exchange rate of 1.20 to the<br />
euro. We do not expect a shift in the policy stance, but emphasis<br />
on rising imbalances in the real estate market is likely to<br />
increase in upcoming statements.<br />
Inflation has fallen sharply, as wage pressures remain subdued and<br />
growth has disappointed. Despite this, the BoC has maintained a<br />
hiking bias, as high household debt and risks in the domestic<br />
housing market remain key vulnerabilities. We expect the BoC to<br />
keep its policy rate on hold until mid-2013.<br />
Downside risks emanating from Europe and, increasingly,<br />
China, argue for some further modest policy easing later in the<br />
year.<br />
Although the economy has yet to show signs of recovery,<br />
borrowing costs have risen. Hence, another rate cut is still<br />
needed near term. We also expect one more RRR cut this year.<br />
BCB has cut rates by 500bp since mid-2011. A final 25bp cut in<br />
October remains a possibility, but the most likely outcome is that<br />
rates are now kept on hold.<br />
Change since our last weekly in bold and italics<br />
Market Economics 20 September 2012<br />
Market Mover<br />
57<br />
www.GlobalMarkets.bnpparibas.com
Economic Forecasts<br />
GDP<br />
Year 2012<br />
(% y/y) ’11 (1) ’12 (1) ’13 (1) Q1 Q2 (1) Q3 (1) Q4 (1)<br />
US 1.8 2.2 2.1 2.4 2.3 2.3 1.7<br />
Eurozone 1.5 -0.4 0.2 0.0 -0.5 -0.7 -0.5<br />
Japan -0.8 2.2 0.6 2.9 3.2 1.5 1.3<br />
World (2) 4.0 3.1 3.4 3.4 3.2 3.0 2.9<br />
Industrial Production<br />
Year<br />
2012<br />
(% y/y) ’11 ’12 (1) ’13 (1) Q1 Q2 (1) Q3 (1) Q4 (1)<br />
US 4.1 3.7 2.3 4.4 4.8 3.3 2.3<br />
Eurozone 3.5 -2.3 0.3 -1.7 -2.4 -3.5 -1.7<br />
Japan -2.4 0.2 0.8 4.7 5.3 -3.6 -4.3<br />
Unemployment Rate<br />
Year<br />
2012<br />
(%) ’11 ’12 (1) ’13 (1) Q1 Q2 (1) Q3 (1) Q4 (1)<br />
US 9.0 8.2 7.9 8.3 8.2 8.2 8.1<br />
Eurozone 10.2 11.4 12.2 10.9 11.2 11.5 11.8<br />
Japan 4.6 4.4 4.0 4.5 4.4 4.3 4.2<br />
CPI<br />
Year<br />
2012<br />
(% y/y) ’11 ’12 (1) ’13 (1) Q1 Q2 (1) Q3 (1) Q4 (1)<br />
US 3.2 2.1 2.2 2.8 1.9 1.7 2.1<br />
Eurozone 2.7 2.5 2.0 2.7 2.5 2.5 2.5<br />
Japan (Core) -0.3 0.0 0.2 0.1 0.0 -0.2 0.2<br />
Current Account<br />
Year<br />
Budget Bal<br />
Year<br />
(% GDP) ’11 (1) ’12 (1) ’13 (1) (% GDP) ’11 (1) ’12 (1) ’13 (1)<br />
US -3.0 -2.8 -2.2 -8.7 -7.4 -6.3<br />
Eurozone 0.0 0.9 1.4 -4.1 -3.3 -2.4<br />
Japan 2.0 1.2 1.0 -9.7 -8.3 -7.2<br />
Interest Rate Forecasts<br />
Year<br />
2012<br />
(%) ’11 ’12 (1) ’13 (1) Q1 Q2 Q3 (1) Q4 (1)<br />
US<br />
Fed Funds Rate 0-0.25 0-0.25 0-0.25 0-0.25 0-0.25 0-0.25 0-0.25<br />
3-month Rate 0.58 0.40 0.40 0.47 0.46 0.38 0.40<br />
2-year yield 0.25 0.25 0.25 0.34 0.31 0.26 0.25<br />
10-year yield 1.88 2.00 2.95 2.21 1.64 1.81 2.00<br />
2y/10y Spread (bp) 163 175 270 188 134 155 175<br />
Eurozone<br />
Refinancing Rate 1.00 0.50 0.50 1.00 1.00 0.75 0.50<br />
3-month Rate 1.36 0.05 0.05 0.78 0.65 0.24 0.05<br />
2-year yield (5) 0.14 0.10 0.45 0.22 0.13 0.08 0.10<br />
10-year yield (5) 1.83 1.45 2.00 1.81 1.60 1.64 1.45<br />
2y/10y Spread (bp) (5) 169 135 155 159 147 156 135<br />
Japan<br />
O/N Call Rate 0.10 0.10 0.10 0.10 0.10 0.10 0.10<br />
3-month Rate 0.33 0.35 0.35 0.33 0.33 0.35 0.35<br />
2-year yield 0.14 0.10 0.15 0.12 0.11 0.10 0.10<br />
10-year yield 0.99 0.70 1.00 0.99 0.84 0.80 0.70<br />
2y/10y Spread (bp) 85 60 85 87 74 70 60<br />
Footnotes: (1) Forecast (2) <strong>BNP</strong>P estimates based on country weights in the IMF World Economic Outlook Update<br />
October 2011 (3) End Period (4) Fiscal year Figures are y/y percentage change unless otherwise indicated (5) German benchmark<br />
Source: <strong>BNP</strong> Paribas<br />
Market Economics 20 September 2012<br />
Market Mover<br />
58<br />
www.GlobalMarkets.bnpparibas.com
This section is classified as non-objective research<br />
FX Forecasts*<br />
USD Bloc Q3 '12 Q4 '12 Q1 '13 Q2 '13 Q3 '13 Q4 '13 Q1 '14 Q2 '14 Q3 '14 Q4 '14 Q1 '15<br />
EUR/USD 1.30 1.35 1.32 1.35 1.32 1.35 1.31 1.29 1.27 1.25 1.25<br />
USD/JPY 78 77 76 76 75 75 78 80 85 85 90<br />
USD/CHF 0.94 0.93 0.95 0.93 0.98 0.96 1.03 1.05 1.06 1.08 1.04<br />
GBP/USD 1.67 1.73 1.74 1.78 1.78 1.82 1.82 1.79 1.81 1.79 1.52<br />
USD/CAD 0.98 0.96 0.95 0.94 0.92 0.92 0.96 1.00 1.05 1.05 0.98<br />
AUD/USD 1.06 1.08 1.00 1.02 1.04 1.06 1.05 1.05 1.00 0.95 0.93<br />
NZD/USD 0.84 0.86 0.83 0.85 0.88 0.90 0.87 0.83 0.80 0.76 0.78<br />
USD/SEK 6.85 6.56 6.70 6.67 6.82 6.67 6.72 6.82 6.77 6.88 7.20<br />
USD/NOK 5.85 5.56 5.68 5.48 5.61 5.48 5.65 5.74 5.83 5.92 6.00<br />
EUR Bloc Q3 '12 Q4 '12 Q1 '13 Q2 '13 Q3 '13 Q4 '13 Q1 '14 Q2 '14 Q3 '14 Q4 '14 Q1 '15<br />
EUR/JPY 101 104 100 103 99 101 102 103 108 106 113<br />
EUR/GBP 0.78 0.78 0.76 0.76 0.74 0.74 0.72 0.72 0.70 0.70 0.82<br />
EUR/CHF 1.22 1.25 1.25 1.25 1.30 1.30 1.35 1.35 1.35 1.35 1.30<br />
EUR/SEK 8.90 8.85 8.85 9.00 9.00 9.00 8.80 8.80 8.60 8.60 9.00<br />
EUR/NOK 7.60 7.50 7.50 7.40 7.40 7.40 7.40 7.40 7.40 7.40 7.50<br />
EUR/DKK 7.46 7.46 7.46 7.46 7.46 7.46 7.46 7.46 7.46 7.46 7.46<br />
Central Europe Q3 '12 Q4 '12 Q1 '13 Q2 '13 Q3 '13 Q4 '13 Q1 '14 Q2 '14 Q3 '14 Q4 '14 Q1 '15<br />
USD/PLN 3.15 3.15 3.26 3.11 3.14 3.04 3.13 3.02 3.11 3.28 3.08<br />
EUR/CZK 24.6 25.5 26.2 25.8 25.0 24.1 23.6 24.1 23.8 23.1 22.7<br />
EUR/HUF 282 275 275 273 277 272 280 282 275 270 240<br />
USD/ZAR 8.37 8.50 8.00 8.10 8.00 7.85 7.65 7.68 7.80 7.93 7.93<br />
USD/TRY 1.80 1.74 1.72 1.74 1.79 1.79 1.84 1.85 1.89 1.90 1.84<br />
EUR/RON 4.47 4.52 4.45 4.42 4.35 4.37 4.35 4.33 4.25 4.25 4.15<br />
USD/RUB 30.75 30.24 29.98 29.81 31.29 31.10 31.07 30.87 31.92 32.54 33.17<br />
EUR/PLN 4.10 4.25 4.30 4.20 4.15 4.10 4.10 3.90 3.95 4.10 3.85<br />
USD/UAH 8.0 9.0 9.0 9.0 9.0 9.0 9.0 9.0 9.0 9.0 9.0<br />
EUR/RSD 115 110 105 100 103 102 100 99 95 90 87<br />
Asia Bloc Q3 '12 Q4 '12 Q1 '13 Q2 '13 Q3 '13 Q4 '13 Q1 '14 Q2 '14 Q3 '14 Q4 '14 Q1 '15<br />
USD/SGD 1.24 1.24 1.22 1.20 1.18 1.15 1.15 1.15 1.15 1.15 1.15<br />
USD/MYR 3.10 3.10 3.05 3.00 2.95 2.90 2.85 2.80 2.80 2.80 2.80<br />
USD/IDR 9600 9800 9850 9900 9950 9900 9800 9700 9800 9600 9500<br />
USD/THB 31.00 30.00 29.50 29.00 28.70 28.40 28.40 28.40 28.40 28.40 28.40<br />
USD/PHP 41.00 40.00 39.50 39.00 38.50 38.00 38.00 38.00 38.00 38.00 38.00<br />
USD/HKD 7.75 7.75 7.75 7.75 7.75 7.75 7.80 7.80 7.80 7.80 7.80<br />
USD/RMB 6.35 6.30 6.27 6.25 6.30 6.29 6.25 6.27 6.21 6.20 6.00<br />
USD/TWD 29.60 29.00 28.50 28.00 27.80 27.50 27.50 27.50 27.50 27.50 27.50<br />
USD/KRW 1125 1100 1080 1050 1030 1000 1000 1000 1000 1000 1050<br />
USD/INR 55.00 55.00 54.50 54.00 53.50 53.00 52.50 51.00 50.50 50.00 50.00<br />
USD/VND 21000 21000 21000 21000 21000 21000 21000 21000 21000 21000 21000<br />
LATAM Bloc Q3 '12 Q4 '12 Q1 '13 Q2 '13 Q3 '13 Q4 '13 Q1 '14 Q2 '14 Q3 '14 Q4 '14 Q1 '15<br />
USD/ARS 4.68 4.85 5.00 5.15 5.35 5.55 5.70 5.85 6.05 6.25 -----<br />
USD/BRL 2.00 1.98 1.98 1.96 1.95 1.95 1.98 2.00 2.02 2.05 -----<br />
USD/CLP 485 482 480 483 486 490 495 500 502 505 -----<br />
USD/MXN 13.00 12.75 12.60 12.50 12.30 12.10 12.20 12.30 12.45 12.60 -----<br />
USD/COP 1800 1850 1875 1830 1815 1800 1810 1820 1830 1840 -----<br />
USD/VEF 4.30 4.30 7.00 7.00 7.00 7.00 7.00 7.00 7.00 7.00 -----<br />
USD/PEN 2.62 2.60 2.59 2.58 2.57 2.55 2.55 2.56 2.57 2.58 -----<br />
Others Q3 '12 Q4 '12 Q1 '13 Q2 '13 Q3 '13 Q4 '13 Q1 '14 Q2 '14 Q3 '14 Q4 '14 Q1 '15<br />
USD Index 79.21 76.71 77.60 76.24 77.15 75.82 78.10 79.60 81.25 82.25 83.99<br />
*End Quarter<br />
FX Strategy 20 September 2012<br />
Markets Mover<br />
59<br />
www.GlobalMarkets.bnpparibas.com
Market Cover<br />
Market Economics<br />
Paul Mortimer-Lee Global Head of Market Economics London 44 20 7595 8551 paul.mortimer-lee@uk.bnpparibas.com<br />
Ken Wattret Chief Eurozone Market Economist London 44 20 7595 8657 kenneth.wattret@uk.bnpparibas.com<br />
Luigi Speranza Head of Inflation & Fiscal Economics London 44 20 7595 8322 luigi.speranza@uk.bnpparibas.com<br />
David Tinsley UK, Ireland London 4420 7595 8150 david.tinsley@uk.bnpparibas.com<br />
Gizem Kara Scandinavia, Greece London 44 20 7595 8783 gizem.kara@uk.bnpparibas.com<br />
Evelyn Herrmann Germany, Austria, Switzerland, Europe London 44 20 7595 8476 evelyn.herrmann@uk.bnpparibas.com<br />
Ricardo Santos Spain, Portugal, Europe London 44 20 7595 8369 ricardo.a.santos@uk.bnpparibas.com<br />
Catherine Colebrook Eurozone Inflation London 44 20 7595 1298 catherine.colebrook@uk.bnpparibas.com<br />
Dominique Barbet Eurozone, France Paris 33 1 4298 1567 dominique.barbet@bnpparibas.com<br />
Michelle Lam Economist London 44 20 7595 8226 michelle.h.lam@uk.bnpparibas.com<br />
Julia Coronado Chief Economist North America New York 1 212 841 2281 julia.l.coronado@us.bnpparibas.com<br />
Jeremy Lawson US New York 1 212 471-8180 Jeremy.lawson@us.bnpparibas.com<br />
Yelena Shulyatyeva US New York 1 212 841 2258 yelena.shulyatyeva@us.bnpparibas.com<br />
Bricklin Dwyer US, Canada New York 1 212 471-7996 bricklin.dwyer@us.bnpparibas.com<br />
Ryutaro Kono Chief Economist Japan Tokyo 81 3 6377 1601 ryutaro.kono@japan.bnpparibas.com<br />
Hiroshi Shiraishi Japan Tokyo 81 3 6377 1602 hiroshi.shiraishi@japan.bnpparibas.com<br />
Azusa Kato Japan Tokyo 81 3 6377 1603 azusa.kato@japan.bnpparibas.com<br />
Makoto Watanabe Japan Tokyo 81 3 6377 1605 makoto.watanabe@japan.bnpparibas.com<br />
Richard Iley Head of Asia Economics Hong Kong 852 2108 5104 richard.iley@asia.bnpparibas.com<br />
Dominic Bryant Asia, Australia Hong Kong 852 2108 5105 dominic.bryant@asia.bnpparibas.com<br />
Mole Hau Asia Hong Kong 852 2108 5620 mole.hau@asia.bnpparibas.com<br />
Xingdong Chen Chief China Economist Beijing 86 10 6535 3327 xd.chen@asia.bnpparibas.com<br />
Ken Peng Senior Economist, China China 86 10 6535 3380 ken.peng@asia.bnpparibas.com<br />
Marcelo Carvalho Head of Latin America Economics São Paulo 55 11 3841 3418 marcelo.carvalho@br.bnpparibas.com<br />
Gustavo Arruda Latin America Economist São Paulo 55 11 3841 3466 gustavo.arruda@br.bnpparibas.com<br />
Nader Nazmi Latin America Economist New York 1 212 471 8216 nader.nazmi@us.bnpparibas.com<br />
Florencia Vazquez Latin America Economist Buenos Aires 54 11 4875 4363 florencia.vazquez@ar.bnpparibas.com<br />
Michal Dybula Chief Economist CEEMEA Warsaw 48 22 697 2354 michal.dybula@pl.bnpparibas.com<br />
Julia Tsepliaeva Russia & CIS Moscow 74 95 785 6022 julia.tsepliaeva@ru.bnpparibas.com<br />
Selim Cakir Chief Economist Turkey and GCC Istanbul 90 216 635 2972 selim.cakir@teb.com.tr<br />
Emre Tekmen Economist Turkey and GCC Istanbul 90 216 635 2975 emre.tekmen@teb.com.tr<br />
Nazli Toraganli Economist Turkey and GCC Istanbul 90 216 635 2986 nazli.toraganli@teb.com.tr<br />
Interest Rate Strategy<br />
Patrick Jacq Europe Strategist Paris 33 1 4316 9718 patrick.jacq@bnpparibas.com<br />
Christophe Duval-Kieffer Global Head of Inflation Strategy London 44 20 7 595 8351 christophe.duval-kieffer@bnpparibas.com<br />
Shahid Ladha Inflation & UK Strategist London 44 20 7 595 8573 shahid.ladha@uk.bnpparibas.com<br />
Eric Oynoyan Europe Strategist London 44 20 7595 8613 eric.oynoyan@uk.bnpparibas.com<br />
Matteo Regesta Europe Strategist London 44 20 7595 8607 matteo.regesta@uk.bnpparibas.com<br />
Ioannis Sokos Europe Strategist London 44 20 7595 8671 ioannis.sokos@uk.bnpparibas.com<br />
Camille de Courcel Europe Strategist London 44 20 7595 8295 camille.decourcel@uk.bnpparibas.com<br />
Bülent Baygün Head of Interest Rate Strategy US New York 1 212 471 8043 bulent.baygun@us.bnpparibas.com<br />
Mary-Beth Fisher US Strategist New York 1 212 841 2912 mary-beth.fisher@us.bnpparibas.com<br />
Aaron Kohli US Strategist New York 1 212 841 2026 aaron.kohli@us.bnpparibas.com<br />
Suvrat Prakash US Strategist New York 1 917 472 4374 suvrat.prakash@us.bnpparibas.com<br />
Anish Lohokare MBS Strategist New York 1 212 841 2867 anish.lohokare@us.bnpparibas.com<br />
Olurotimi Ajibola MBS Strategist New York 1 212 8413831 olurotimi.ajibola@us.bnpparibas.com<br />
Bo Peng US Strategist New York 1 212 8412241 bo.peng@us.bnpparibas.com<br />
Tomohisa Fujiki Japan Strategist Tokyo 81 3 6377 1703 Tomohisa.fujiki@japan.bnpparibas.com<br />
Hidehiko Maejima Japan Strategist Tokyo 81 3 6377 1701 Hidehiko.maejima@japan.bnpparibas.com<br />
Satoshi Igarashi Japan Strategist Tokyo 81 (0)3 6377 1710 satoshi.igarashi@japan.bnpparibas.com<br />
Christian Séné Technical Analyst Paris 33 1 4316 9717 christian.séné@bnpparibas.com<br />
FX Strategy<br />
Steven Saywell Head of FX Strategy - Europe London 44 20 7595 8487 steven.saywell@uk.bnpparibas.com<br />
Michael Sneyd FX Strategist London 44 20 7595 1307 michael.sneyd@uk.bnpparibas.com<br />
Kiran Kowshik FX Strategist London 44 20 7595 1495 kiran.kowshik@bnpparibas.com<br />
James Hellawell Quantitative Strategist London 44 20 7595 8485 james.hellawell@uk.bnpparibas.com<br />
Mary Nicola FX Strategist New York 1 212 841 2492 mary.nicola@us.bnpparibas.com<br />
Local Markets FX & Interest Rate Strategy<br />
Chin Loo Thio FX & IR Asia Strategist Singapore 65 6210 3263 chin.thio@asia.bnpparibas.com<br />
Jasmine Poh FX & IR Asia Strategist Singapore 65 6210 3418 jasmine.j.poh@asia.bnpparibas.com<br />
Bartosz Pawlowski Head of CEEMEA Strategy London 44 20 7595 8195 Bartosz.pawlowski@uk.bnpparibas.com<br />
Dina Ahmad FX & IR CEEMEA Strategist London 44 20 7 595 8620 dina.ahmad@uk.bnpparibas.com<br />
Erkin Isik FX & IR CEEMEA Strategist Istanbul 90 (216) 635 29 87 erkin.isik@teb.com.tr<br />
Vivek Tawadey Head of Credit Strategy CEEMEA London 44 20 7 595 8894 vivek.tawadey@uk.bnpparibas.com<br />
Diego Donadio FX & IR Latin America Strategist São Paulo 55 11 3841 3421 diego.donadio@br.bnpparibas.com<br />
Thiago Alday FX & IR Latin America Strategist São Paulo 55 11 3841 3445 thiago.alday@br.bnpparibas.com<br />
Market Mover<br />
60<br />
www.GlobalMarkets.bnpparibas.com
For Production and Distribution, please contact:<br />
Ann Aston, Market Economics, London. Tel: 44 20 7595 8503 Email: ann.aston@uk.bnpparibas.com,<br />
Jessica.Bakkioui, Market Economics, London. Tel: 44 20 7595 8478 Email: jessica.bakkioui@uk.bnpparibas.com,<br />
Judith Moretto, Market Economics, London. Tel: 44 20 7595 8161 Email: Judith.moretto@us.bnpparibas.com<br />
Danielle Catananzi, Interest Rate Strategy, London. Tel: 44 20 7595 4418 Email: danielle.catananzi@uk.bnpparibas.com,<br />
Diana Seifert, FX Strategy, London. Tel: 44 20 7595 8486 Email:diana.seifert@uk.bnpparibas.com,<br />
Martine Borde, Market Economics/Interest Rate Strategy, Paris. Tel: 33 1 4298 4144 Email martine.borde@bnpparibas.com<br />
Editors: Amanda Grantham-Hill, Interest Rate Strategy/Market Economics, London. Tel: 44 20 7595 4107 Email: amanda.grantham-hill@bnpparibas.com;<br />
Poilin Breathnach, Interest Rate Strategy/Market Economics, London. Tel: 44 20 7595 3145 Poilin.Breathnach@uk.bnpparibas.com,<br />
Louise Bylicki, Interest Rate Strategy/Market Economics, New York. Tel: 212 841 8449 Email: louise.bylicki@us.bnpparibas.com<br />
<strong>BNP</strong> Paribas Global Fixed Income Website<br />
www.globalmarkets.bnpparibas.com<br />
Bloomberg<br />
Fixed Income Research BPCM Market Economics BPEC<br />
Interest Rate Strategy BPBS Forex Strategy BPFR<br />
RESEARCH DISCLAIMERS - Please see important disclosures in the text of this report.<br />
Some sections of this report have been written by our strategy teams. These sections do not purport to be an exhaustive analysis, and may be<br />
subject to conflicts of interest resulting from their interaction with sales and trading which could affect the objectivity of this report. (Please<br />
see further important disclosures in the text of this report). These sections are a marketing communication. They are not independent<br />
investment research. They have not been prepared in accordance with legal requirements designed to provide the independence of<br />
investment research, and are not subject to any prohibition on dealing ahead of the dissemination of investment research.<br />
The information and opinions contained in this report have been obtained from, or are based on, public sources believed to be reliable, but no<br />
representation or warranty, express or implied, is made that such information is accurate, complete or up to date and it should not be relied upon as such.<br />
This report does not constitute an offer or solicitation to buy or sell any securities or other investment. Information and opinions contained in the report are<br />
published for the assistance of recipients, but are not to be relied upon as authoritative or taken in substitution for the exercise of judgement by any<br />
recipient, are subject to change without notice and not intended to provide the sole basis of any evaluation of the instruments discussed herein. Any<br />
reference to past performance should not be taken as an indication of future performance. To the fullest extent permitted by law, no <strong>BNP</strong> Paribas group<br />
company accepts any liability whatsoever (including in negligence) for any direct or consequential loss arising from any use of or reliance on material<br />
contained in this report. All estimates and opinions included in this report are made as of the date of this report. Unless otherwise indicated in this report<br />
there is no intention to update this report. <strong>BNP</strong> Paribas SA and its affiliates (collectively “<strong>BNP</strong> Paribas”) may make a market in, or may, as principal or<br />
agent, buy or sell securities of any issuer or person mentioned in this report or derivatives thereon. Prices, yields and other similar information included in<br />
this report are included for information purposes. Numerous factors will affect market pricing and there is no certainty that transactions could be executed<br />
at these prices<br />
<strong>BNP</strong> Paribas may have a financial interest in any issuer or person mentioned in this report, including a long or short position in their securities and/or<br />
options, futures or other derivative instruments based thereon, or vice versa. <strong>BNP</strong> Paribas, including its officers and employees may serve or have served<br />
as an officer, director or in an advisory capacity for any person mentioned in this report. <strong>BNP</strong> Paribas may, from time to time, solicit, perform or have<br />
performed investment banking, underwriting or other services (including acting as adviser, manager, underwriter or lender) within the last 12 months for<br />
any person referred to in this report. <strong>BNP</strong> Paribas may be a party to an agreement with any person relating to the production of this report. <strong>BNP</strong> Paribas,<br />
may to the extent permitted by law, have acted upon or used the information contained herein, or the research or analysis on which it was based, before<br />
its publication. <strong>BNP</strong> Paribas may receive or intend to seek compensation for investment banking services in the next three months from or in relation to<br />
any person mentioned in this report. Any person mentioned in this report may have been provided with sections of this report prior to its publication in<br />
order to verify its factual accuracy.<br />
<strong>BNP</strong> Paribas is incorporated in France with limited liability. Registered Office 16 Boulevard des Italiens, 75009 Paris. This report was produced by a <strong>BNP</strong><br />
Paribas group company. This report is for the use of intended recipients and may not be reproduced (in whole or in part) or delivered or transmitted to any<br />
other person without the prior written consent of <strong>BNP</strong> Paribas. By accepting this document you agree to be bound by the foregoing limitations.<br />
Certain countries within the European Economic Area:<br />
This report is solely prepared for professional clients. It is not intended for retail clients and should not be passed on to any such persons. This report has<br />
been approved for publication in the United Kingdom by <strong>BNP</strong> Paribas London Branch. <strong>BNP</strong> Paribas London Branch is authorised and supervised by the<br />
Autorité de Contrôle Prudentiel and authorised and subject to limited regulation by the Financial <strong>Services</strong> Authority. Details of the extent of our<br />
authorisation and regulation by the Financial <strong>Services</strong> Authority are available from us on request.<br />
This report has been approved for publication in France by <strong>BNP</strong> Paribas SA, incorporated in France with Limited Liability and is authorised by the Autorité<br />
de Contrôle Prudentiel (ACP) and regulated by the Autorité des Marchés Financiers (AMF) whose head office is 16, Boulevard des Italiens 75009 Paris,<br />
France.<br />
This report is being distributed in Germany either by <strong>BNP</strong> Paribas London Branch or by <strong>BNP</strong> Paribas Niederlassung Frankfurt am Main , a branch of <strong>BNP</strong><br />
Paribas S.A. whose head office is in Paris, France. <strong>BNP</strong> Paribas S.A. – Niederlassung Frankfurt am Main, Europa Allee 12, 60327 Frankfurt is authorised<br />
and supervised by the Autorité de Contrôle Prudentiel and it is authorised and subject to limited regulation by the Bundesanstalt für<br />
Finanzdienstleistungsaufsicht (BaFin).<br />
United States: This report is being distributed to US persons by <strong>BNP</strong> Paribas Securities Corp., or by a subsidiary or affiliate of <strong>BNP</strong> Paribas that is not<br />
registered as a US broker-dealer to US major institutional investors only. <strong>BNP</strong> Paribas Securities Corp., a subsidiary of <strong>BNP</strong> Paribas, is a broker-dealer<br />
registered with the U.S. Securities and Exchange Commission and a member of the Financial Industry Regulatory Authority and other principal<br />
exchanges. For the purposes of, and to the extent subject to, §§ 1.71 and 23.605 of the U.S. Commodity Exchange Act, this report is a general solicitation<br />
of derivatives business. <strong>BNP</strong> Paribas Securities Corp. accepts responsibility for the content of a report prepared by another non-U.S. affiliate only when<br />
distributed to U.S. persons by <strong>BNP</strong> Paribas Securities Corp.<br />
Japan: This report is being distributed to Japanese based firms by <strong>BNP</strong> Paribas Securities (Japan) Limited or by a subsidiary or affiliate of <strong>BNP</strong> Paribas<br />
not registered as a financial instruments firm in Japan, to certain financial institutions defined by article 17-3, item 1 of the Financial Instruments and<br />
Exchange Law Enforcement Order. <strong>BNP</strong> Paribas Securities (Japan) Limited is a financial instruments firm registered according to the Financial<br />
Instruments and Exchange Law of Japan and a member of the Japan Securities Dealers Association and the Financial Futures Association of Japan.<br />
<strong>BNP</strong> Paribas Securities (Japan) Limited accepts responsibility for the content of a report prepared by another non-Japan affiliate only when distributed to<br />
Japanese based firms by <strong>BNP</strong> Paribas Securities (Japan) Limited. Some of the foreign securities stated on this report are not disclosed according to the<br />
Financial Instruments and Exchange Law of Japan.<br />
Hong Kong: This report is being distributed in Hong Kong by <strong>BNP</strong> Paribas Hong Kong Branch, a branch of <strong>BNP</strong> Paribas whose head office is in Paris,<br />
France. <strong>BNP</strong> Paribas Hong Kong Branch is registered as a Licensed Bank under the Banking Ordinance and regulated by the Hong Kong Monetary<br />
Authority. <strong>BNP</strong> Paribas Hong Kong Branch is also a Registered Institution regulated by the Securities and Futures Commission for the conduct of<br />
Regulated Activity Types 1, 4 and 6 under the Securities and Futures Ordinance.<br />
Some or all the information reported in this document may already have been published on https://globalmarkets.bnpparibas.com<br />
© <strong>BNP</strong> Paribas (2012). All rights reserved.


