

MARKET MOVER - BNP PARIBAS - Investment Services India
MARKET MOVER - BNP PARIBAS - Investment Services India
MARKET MOVER - BNP PARIBAS - Investment Services India

Create successful ePaper yourself
Turn your PDF publications into a flip-book with our unique Google optimized e-Paper software.
This section is classified as non-objective research<br />
QE Impacts on Spread Sector Relative Value<br />
• Steep MBS demand from the Fed in the face<br />
of negative net MBS issuance has driven MBS<br />
to negative Treasury OASs. While we expect<br />
MBS to further outperform Treasuries, riskier<br />
asset classes, particularly corporate bonds,<br />
with their similar credit quality and liquidity, are<br />
likely to do even better.<br />
• A broad range of global debt investors who<br />
employ benchmarks will face asset shortages in<br />
the face of this QE-induced contraction in<br />
available investment grade assets. This is<br />
expected to provide technical support to US IG<br />
credit, despite low yields and historically full<br />
valuations, and will help to perpetuate the<br />
current strong demand for high-quality new<br />
issue paper. High yield and emerging markets<br />
credit also benefit from this dynamic.<br />
• This incremental demand from non-credit<br />
sectors combined with significant re-investment<br />
cash flows from the shrinkage of the large bank<br />
balance sheets is expected to drive relative<br />
outperformance of bank/finance bonds, quasisovereign/yankee<br />
securities and select BBB's<br />
over the next 6 months.<br />
MBS Rich as Demand Far Outstrips Supply<br />
Our economists expect QE3 MBS purchases to<br />
continue at the USD 40bn per month pace at least<br />
until year-end 2013, and possibly tapering into 2014.<br />
Including reinvestments of maturing agency debt in<br />
the Fed's portfolio into agency MBS, the net demand<br />
from the Fed would exceed USD 500bn over the next<br />
12 months. The issuance of the TBA deliverable<br />
bonds where Fed purchases have been concentrated<br />
was negative USD 172bn over the past 12 months,<br />
roughly a negative USD 14.3bn per month average.<br />
Thus, the Fed demand for MBS is particularly high in<br />
relation to the negative supply of the bonds that the<br />
Fed has traditionally purchased.<br />
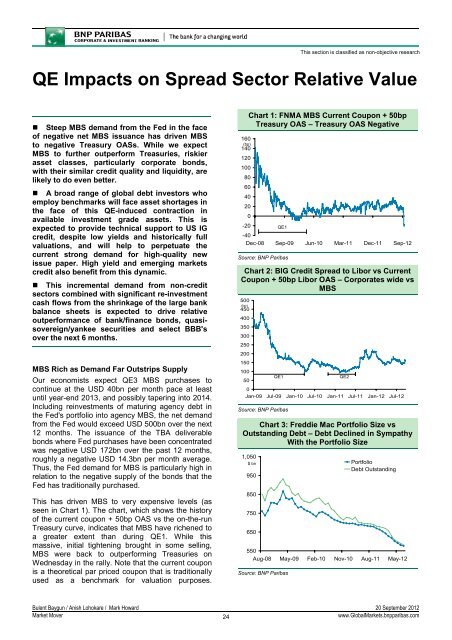
This has driven MBS to very expensive levels (as<br />
seen in Chart 1). The chart, which shows the history<br />
of the current coupon + 50bp OAS vs the on-the-run<br />
Treasury curve, indicates that MBS have richened to<br />
a greater extent than during QE1. While this<br />
massive, initial tightening brought in some selling,<br />
MBS were back to outperforming Treasuries on<br />
Wednesday in the rally. Note that the current coupon<br />
is a theoretical par priced coupon that is traditionally<br />
used as a benchmark for valuation purposes.<br />
Chart 1: FNMA MBS Current Coupon + 50bp<br />
Treasury OAS – Treasury OAS Negative<br />
160<br />
(bp)<br />
140<br />
120<br />
100<br />
80<br />
60<br />
40<br />
20<br />
0<br />
-20<br />
QE1<br />
-40<br />
Dec-08 Sep-09 Jun-10 Mar-11 Dec-11 Sep-12<br />
Source: <strong>BNP</strong> Paribas<br />
Chart 2: BIG Credit Spread to Libor vs Current<br />
Coupon + 50bp Libor OAS – Corporates wide vs<br />
MBS<br />
500<br />
(bp)<br />
450<br />
400<br />
350<br />
300<br />
250<br />
200<br />
150<br />
100<br />
50<br />
QE1<br />
QE2<br />
0<br />
Jan-09 Jul-09 Jan-10 Jul-10 Jan-11 Jul-11 Jan-12 Jul-12<br />
Source: <strong>BNP</strong> Paribas<br />
Chart 3: Freddie Mac Portfolio Size vs<br />
Outstanding Debt – Debt Declined in Sympathy<br />
With the Portfolio Size<br />
1,050<br />
$ bn<br />
950<br />
850<br />
750<br />
650<br />
Portfolio<br />
Debt Outstanding<br />
550<br />
Aug-08 May-09 Feb-10 Nov-10 Aug-11 May-12<br />
Source: <strong>BNP</strong> Paribas<br />
Bulent Baygun / Anish Lohokare / Mark Howard 20 September 2012<br />
Market Mover<br />
24<br />
www.GlobalMarkets.bnpparibas.com


