

MARKET MOVER - BNP PARIBAS - Investment Services India
MARKET MOVER - BNP PARIBAS - Investment Services India
MARKET MOVER - BNP PARIBAS - Investment Services India

You also want an ePaper? Increase the reach of your titles
YUMPU automatically turns print PDFs into web optimized ePapers that Google loves.
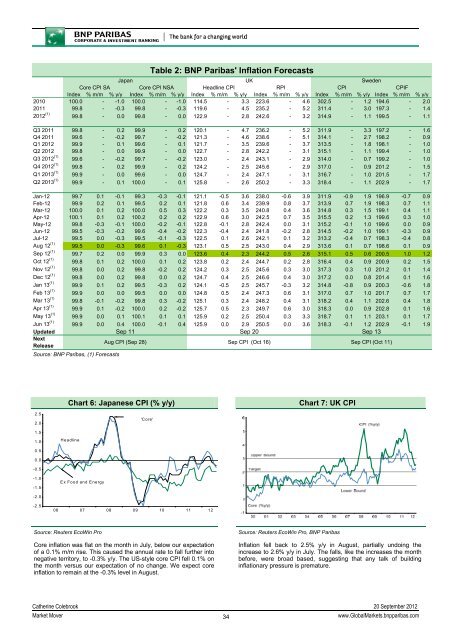
Table 2: <strong>BNP</strong> Paribas' Inflation Forecasts<br />
Japan<br />
UK<br />
Sweden<br />
Core CPI SA<br />
Core CPI NSA<br />
Headline CPI<br />
RPI<br />
CPI<br />
CPIF<br />
Index % m/m % y/y Index % m/m % y/y Index % m/m % y/y Index % m/m % y/y Index % m/m % y/y Index % m/m % y/y<br />
2010 100.0 - -1.0 100.0 - -1.0 114.5 - 3.3 223.6 - 4.6 302.5 - 1.2 194.6 - 2.0<br />
2011 99.8 - -0.3 99.8 - -0.3 119.6 - 4.5 235.2 - 5.2 311.4 - 3.0 197.3 - 1.4<br />
2012 (1) 99.8 - 0.0 99.8 - 0.0 122.9 - 2.8 242.6 - 3.2 314.9 - 1.1 199.5 - 1.1<br />
Q3 2011 99.8 - 0.2 99.9 - 0.2 120.1 - 4.7 236.2 - 5.2 311.9 - 3.3 197.2 - 1.6<br />
Q4 2011 99.6 - -0.2 99.7 - -0.2 121.3 - 4.6 238.6 - 5.1 314.1 - 2.7 198.2 - 0.9<br />
Q1 2012 99.9 - 0.1 99.6 - 0.1 121.7 - 3.5 239.6 - 3.7 313.5 - 1.8 198.1 - 1.0<br />
Q2 2012 99.8 - 0.0 99.9 - 0.0 122.7 - 2.8 242.2 - 3.1 315.1 - 1.1 199.4 - 1.0<br />
Q3 2012 (1) 99.6 - -0.2 99.7 - -0.2 123.0 - 2.4 243.1 - 2.9 314.0 - 0.7 199.2 - 1.0<br />
Q4 2012 (1) 99.8 - 0.2 99.9 - 0.2 124.2 - 2.5 245.6 - 2.9 317.0 - 0.9 201.2 - 1.5<br />
Q1 2013 (1) 99.9 - 0.0 99.6 - 0.0 124.7 - 2.4 247.1 - 3.1 316.7 - 1.0 201.5 - 1.7<br />
Q2 2013 (1) 99.9 - 0.1 100.0 - 0.1 125.8 - 2.6 250.2 - 3.3 318.4 - 1.1 202.9 - 1.7<br />
Jan-12 99.7 0.1 -0.1 99.3 -0.3 -0.1 121.1 -0.5 3.6 238.0 -0.6 3.9 311.9 -0.9 1.9 196.9 -0.7 0.9<br />
Feb-12 99.9 0.2 0.1 99.5 0.2 0.1 121.8 0.6 3.4 239.9 0.8 3.7 313.9 0.7 1.9 198.3 0.7 1.1<br />
Mar-12 100.0 0.1 0.2 100.0 0.5 0.3 122.2 0.3 3.5 240.8 0.4 3.6 314.8 0.3 1.5 199.1 0.4 1.1<br />
Apr-12 100.1 0.1 0.2 100.2 0.2 0.2 122.9 0.6 3.0 242.5 0.7 3.5 315.5 0.2 1.3 199.6 0.3 1.0<br />
May-12 99.8 -0.3 -0.1 100.0 -0.2 -0.1 122.8 -0.1 2.8 242.4 0.0 3.1 315.2 -0.1 1.0 199.6 0.0 0.9<br />
Jun-12 99.5 -0.3 -0.2 99.6 -0.4 -0.2 122.3 -0.4 2.4 241.8 -0.2 2.8 314.5 -0.2 1.0 199.1 -0.3 0.9<br />
Jul-12 99.5 0.0 -0.3 99.5 -0.1 -0.3 122.5 0.1 2.6 242.1 0.1 3.2 313.2 -0.4 0.7 198.3 -0.4 0.8<br />
Aug 12 (1) 99.5 0.0 -0.3 99.6 0.1 -0.3 123.1 0.5 2.5 243.0 0.4 2.9 313.6 0.1 0.7 198.6 0.1 0.9<br />
Sep 12 (1) 99.7 0.2 0.0 99.9 0.3 0.0 123.6 0.4 2.3 244.2 0.5 2.6 315.1 0.5 0.6 200.5 1.0 1.2<br />
Oct 12 (1) 99.8 0.1 0.2 100.0 0.1 0.2 123.8 0.2 2.4 244.7 0.2 2.8 316.4 0.4 0.9 200.9 0.2 1.5<br />
Nov 12 (1) 99.8 0.0 0.2 99.8 -0.2 0.2 124.2 0.3 2.5 245.6 0.3 3.0 317.3 0.3 1.0 201.2 0.1 1.4<br />
Dec 12 (1) 99.8 0.0 0.2 99.8 0.0 0.2 124.7 0.4 2.5 246.6 0.4 3.0 317.2 0.0 0.8 201.4 0.1 1.6<br />
Jan 13 (1) 99.9 0.1 0.2 99.5 -0.3 0.2 124.1 -0.5 2.5 245.7 -0.3 3.2 314.8 -0.8 0.9 200.3 -0.6 1.8<br />
Feb 13 (1) 99.9 0.0 0.0 99.5 0.0 0.0 124.8 0.5 2.4 247.3 0.6 3.1 317.0 0.7 1.0 201.7 0.7 1.7<br />
Mar 13 (1) 99.8 -0.1 -0.2 99.8 0.3 -0.2 125.1 0.3 2.4 248.2 0.4 3.1 318.2 0.4 1.1 202.6 0.4 1.8<br />
Apr 13 (1) 99.9 0.1 -0.2 100.0 0.2 -0.2 125.7 0.5 2.3 249.7 0.6 3.0 318.3 0.0 0.9 202.8 0.1 1.6<br />
May 13 (1) 99.9 0.0 0.1 100.1 0.1 0.1 125.9 0.2 2.5 250.4 0.3 3.3 318.7 0.1 1.1 203.1 0.1 1.7<br />
Jun 13 (1) 99.9 0.0 0.4 100.0 -0.1 0.4 125.9 0.0 2.9 250.5 0.0 3.6 318.3 -0.1 1.2 202.9 -0.1 1.9<br />
Updated<br />
Next<br />
Release<br />
Sep 11<br />
Aug CPI (Sep 28)<br />
Sep 20<br />
Sep CPI (Oct 16)<br />
Sep 13<br />
Sep CPI (Oct 11)<br />
Source: <strong>BNP</strong> Paribas, (1) Forecasts<br />
Chart 6: Japanese CPI (% y/y)<br />
Chart 7: UK CPI<br />
2.5<br />
2.0<br />
'Core'<br />
1.5<br />
1.0<br />
Headline<br />
0.5<br />
0.0<br />
-0.5<br />
-1.0<br />
-1.5<br />
Ex Food and Energy<br />
-2.0<br />
-2.5<br />
06 07 08 09 10 11 12<br />
Source: Reuters EcoWin Pro<br />
Core inflation was flat on the month in July, below our expectation<br />
of a 0.1% m/m rise. This caused the annual rate to fall further into<br />
negative territory, to -0.3% y/y. The US-style core CPI fell 0.1% on<br />
the month versus our expectation of no change. We expect core<br />
inflation to remain at the -0.3% level in August.<br />
Source: Reuters EcoWin Pro, <strong>BNP</strong> Paribas<br />
Inflation fell back to 2.5% y/y in August, partially undoing the<br />
increase to 2.6% y/y in July. The falls, like the increases the month<br />
before, were broad based, suggesting that any talk of building<br />
inflationary pressure is premature.<br />
Catherine Colebrook 20 September 2012<br />
Market Mover<br />
34<br />
www.GlobalMarkets.bnpparibas.com


