

Market Economics | Interest Rate Strategy - BNP PARIBAS ...
Market Economics | Interest Rate Strategy - BNP PARIBAS ...
Market Economics | Interest Rate Strategy - BNP PARIBAS ...

Create successful ePaper yourself
Turn your PDF publications into a flip-book with our unique Google optimized e-Paper software.
The legislative changes to CPI indexation from<br />
RPI could potentially impact 80% of defined<br />
benefit pension fund members but is likely to be<br />
much lower due to explicit RPI indexation in trust<br />
deeds (40%?). The market impact of the news has<br />
been very limited with 30y cash breakevens now<br />
close to/above levels seen on 7 th July. We expect to<br />
see breakeven weakness in the summer as the<br />
implications of the legislative change to CPI are<br />
calculated and supply continues. Nevertheless, there<br />
is no liquid UK inflation hedging alternative to RPI<br />
currently – RPI/CPI basis quoted at -5/-50bp (-30bp<br />
mid) following the announcement. Furthermore,<br />
given the size of the remaining ALM gap with respect<br />
to inflation, we do not expect LDI demand for RPIlinked<br />
assets to fall dramatically. Rather, the nature<br />
of future UK inflation hedging demand will likely<br />
evolve over time and become index specific<br />
assuming the creation of a CPI-linked market.<br />
Sell 30y BE, but i-40s Supply will be the Real Test<br />
Beyond structural uncertainties, mid-summer months<br />
typically exhibit limited LDI demand, particularly<br />
August with (long) 30y BE total returns negative for<br />
each of the past five years – Table 4. That said, 2010<br />
is not a typical year given the abnormally poor Q2<br />
performance of breakevens. Summer discounting<br />
should limit the potential for further upside surprises<br />
to UK inflation data, although June RPI surprised to<br />
the upside yet again.<br />
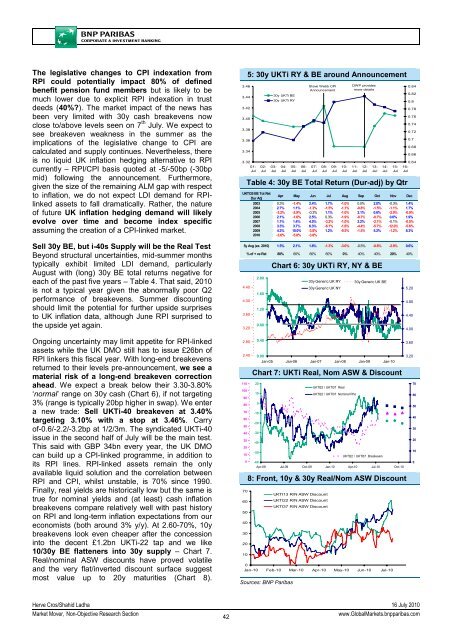
Ongoing uncertainty may limit appetite for RPI-linked<br />
assets while the UK DMO still has to issue £26bn of<br />
RPI linkers this fiscal year. With long-end breakevens<br />
returned to their levels pre-announcement, we see a<br />
material risk of a long-end breakeven correction<br />
ahead. We expect a break below their 3.30-3.80%<br />
‘normal’ range on 30y cash (Chart 6), if not targeting<br />
3% (range is typically 20bp higher in swap). We enter<br />
a new trade: Sell UKTi-40 breakeven at 3.40%<br />
targeting 3.10% with a stop at 3.46%. Carry<br />
of-0.6/-2.2/-3.2bp at 1/2/3m. The syndicated UKTi-40<br />
issue in the second half of July will be the main test.<br />
This said with GBP 34bn every year, the UK DMO<br />
can build up a CPI-linked programme, in addition to<br />
its RPI lines. RPI-linked assets remain the only<br />
available liquid solution and the correlation between<br />
RPI and CPI, whilst unstable, is 70% since 1990.<br />
Finally, real yields are historically low but the same is<br />
true for nominal yields and (at least) cash inflation<br />
breakevens compare relatively well with past history<br />
on RPI and long-term inflation expectations from our<br />
economists (both around 3% y/y). At 2.60-70%, 10y<br />
breakevens look even cheaper after the concession<br />
into the decent £1.2bn UKTi-22 tap and we like<br />
10/30y BE flatteners into 30y supply – Chart 7.<br />
Real/nominal ASW discounts have proved volatile<br />
and the very flat/inverted discount surface suggest<br />
most value up to 20y maturities (Chart 8).<br />
3.46<br />
3.44<br />
3.42<br />
3.40<br />
3.38<br />
3.36<br />
3.34<br />
5: 30y UKTi RY & BE around Announcement<br />
3.32<br />
01-<br />
Jul<br />
02-<br />
Jul<br />
30y UKTi BE<br />
30y UKTi RY<br />
03-<br />
Jul<br />
04-<br />
Jul<br />
05-<br />
Jul<br />
06-<br />
Jul<br />
Steve Webb CPI<br />
Announcement<br />
07-<br />
Jul<br />
08-<br />
Jul<br />
09-<br />
Jul<br />
10-<br />
Jul<br />
DWP provides<br />
more details<br />
Table 4: 30y BE Total Return (Dur-adj) by Qtr<br />
11-<br />
Jul<br />
12-<br />
Jul<br />
13-<br />
Jul<br />
14-<br />
Jul<br />
15-<br />
Jul<br />
0.84<br />
0.82<br />
0.8<br />
0.78<br />
0.76<br />
0.74<br />
0.72<br />
0.7<br />
0.68<br />
0.66<br />
0.64<br />
16-<br />
Jul<br />
UKTI35 BE Tot Ret<br />
Dur Adj<br />
Apr May Jun Jul Aug Sep Oct Nov Dec<br />
2003 0.3% -1.4% 2.4% 1.7% -1.0% 0.0% 2.0% -0.3% 1.4%<br />
2004 2.7% 1.1% -1.3% -1.5% -1.1% -0.8% -1.5% -1.1% 1.7%<br />
2005 -3.2% -2.9% -0.3% 1.1% -1.0% 2.1% 0.6% -2.0% -0.9%<br />
2006 2.1% -1.6% 2.5% 0.3% -1.9% -0.7% -0.7% 0.6% 1.9%<br />
2007 1.1% 1.4% 4.5% -3.2% -1.0% 2.2% -2.1% -0.1% -0.5%<br />
2008 3.3% 3.7% 6.3% -6.1% -1.6% -4.4% -5.7% -12.0% -5.6%<br />
2009 4.2% 10.0% -3.8% 1.2% -9.5% -1.5% 5.2% -1.2% 8.3%<br />
2010 -3.6% -5.8% -3.8%<br />
5y Avg (ex. 2010) 1.5% 2.1% 1.8% -1.3% -3.0% -0.5% -0.6% -2.9% 0.6%<br />
4.40<br />
4.00<br />
3.60<br />
3.20<br />
2.80<br />
2.40<br />
110<br />
100<br />
90<br />
80<br />
70<br />
60<br />
50<br />
40<br />
30<br />
20<br />
10<br />
0<br />
70<br />
60<br />
50<br />
40<br />
30<br />
20<br />
10<br />
% of + ve Ret 80% 60% 60% 60% 0% 40% 40% 20% 40%<br />
2.00<br />
1.60<br />
1.20<br />
0.80<br />
0.40<br />
Chart 6: 30y UKTi RY, NY & BE<br />
30y Generic UK RY<br />
30y Generic UK NY<br />
30y Generic UK BE<br />
0.00<br />
Jan-05 Jan-06 Jan-07 Jan-08 Jan-09 Jan-10<br />
Chart 7: UKTi Real, Nom ASW & Discount<br />
20<br />
10<br />
0<br />
-10<br />
-20<br />
-30<br />
-40<br />
-50<br />
UKTI22 / UKTI37 Real<br />
UKTI22 / UKTI37 Nominal Rhs<br />
UKTI22 / UKTI37 Breakeven<br />
-60<br />
Apr-09 Jul-09 Oct-09 Jan-10 Apr-10 Jul-10 Oct-10<br />
8: Front, 10y & 30y Real/Nom ASW Discount<br />
0<br />
Jan-10 Feb-10 Mar-10 Apr-10 May-10 Jun-10 Jul-10<br />
Sources: <strong>BNP</strong> Paribas<br />
UKTI13 R/N ASW Discount<br />
UKTI22 R/N ASW Discount<br />
UKTI37 R/N ASW Discount<br />
5.20<br />
4.80<br />
4.40<br />
4.00<br />
3.60<br />
3.20<br />
70<br />
60<br />
50<br />
40<br />
30<br />
20<br />
10<br />
0<br />
Herve Cros/Shahid Ladha 16 July 2010<br />
<strong>Market</strong> Mover, Non-Objective Research Section<br />
42<br />
www.Global<strong>Market</strong>s.bnpparibas.com


