

Market Economics | Interest Rate Strategy - BNP PARIBAS ...
Market Economics | Interest Rate Strategy - BNP PARIBAS ...
Market Economics | Interest Rate Strategy - BNP PARIBAS ...

You also want an ePaper? Increase the reach of your titles
YUMPU automatically turns print PDFs into web optimized ePapers that Google loves.
Key Data Preview<br />
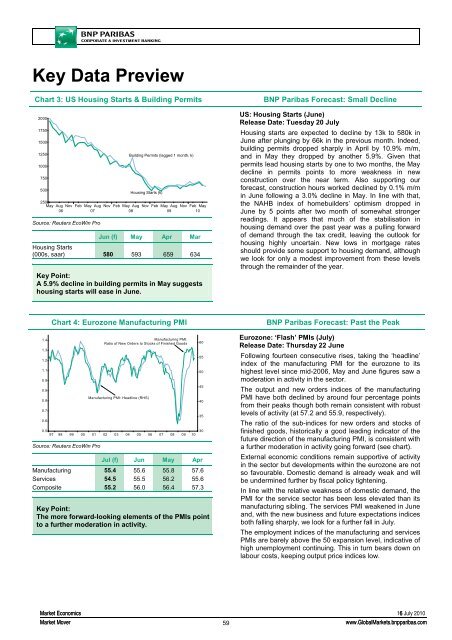
Chart 3: US Housing Starts & Building Permits<br />
2000<br />
1750<br />
1500<br />
1250<br />
1000<br />
750<br />
500<br />
Building Permits (lagged 1 month, k)<br />
Housing Starts (k)<br />
250<br />
May Aug Nov Feb May Aug Nov Feb May Aug Nov Feb May Aug Nov Feb May<br />
06 07 08 09 10<br />
Source: Reuters EcoWin Pro<br />
Jun (f) May Apr Mar<br />
Housing Starts<br />
(000s, saar) 580 593 659 634<br />
Key Point:<br />
A 5.9% decline in building permits in May suggests<br />
housing starts will ease in June.<br />
<strong>BNP</strong> Paribas Forecast: Small Decline<br />
US: Housing Starts (June)<br />
Release Date: Tuesday 20 July<br />
Housing starts are expected to decline by 13k to 580k in<br />
June after plunging by 66k in the previous month. Indeed,<br />
building permits dropped sharply in April by 10.9% m/m,<br />
and in May they dropped by another 5.9%. Given that<br />
permits lead housing starts by one to two months, the May<br />
decline in permits points to more weakness in new<br />
construction over the near term. Also supporting our<br />
forecast, construction hours worked declined by 0.1% m/m<br />
in June following a 3.0% decline in May. In line with that,<br />
the NAHB index of homebuilders’ optimism dropped in<br />
June by 5 points after two month of somewhat stronger<br />
readings. It appears that much of the stabilisation in<br />
housing demand over the past year was a pulling forward<br />
of demand through the tax credit, leaving the outlook for<br />
housing highly uncertain. New lows in mortgage rates<br />
should provide some support to housing demand, although<br />
we look for only a modest improvement from these levels<br />
through the remainder of the year.<br />
1.2<br />
1.1<br />
0.9<br />
0.9<br />
0.8<br />
0.7<br />
0.6<br />
Chart 4: Eurozone Manufacturing PMI<br />
1.4 Manufacturing PMI:<br />
Ratio of New Orders to Stocks of Finished Goods<br />
1.3<br />
Manufacturing PMI: Headline (RHS)<br />
0.5<br />
30<br />
97 98 99 00 01 02 03 04 05 06 07 08 09 10<br />
Source: Reuters EcoWin Pro<br />
Jul (f) Jun May Apr<br />
Manufacturing 55.4 55.6 55.8 57.6<br />
Services 54.5 55.5 56.2 55.6<br />
Composite 55.2 56.0 56.4 57.3<br />
Key Point:<br />
The more forward-looking elements of the PMIs point<br />
to a further moderation in activity.<br />
60<br />
55<br />
50<br />
45<br />
40<br />
35<br />
<strong>BNP</strong> Paribas Forecast: Past the Peak<br />
Eurozone: ‘Flash’ PMIs (July)<br />
Release Date: Thursday 22 June<br />
Following fourteen consecutive rises, taking the ‘headline’<br />
index of the manufacturing PMI for the eurozone to its<br />
highest level since mid-2006, May and June figures saw a<br />
moderation in activity in the sector.<br />
The output and new orders indices of the manufacturing<br />
PMI have both declined by around four percentage points<br />
from their peaks though both remain consistent with robust<br />
levels of activity (at 57.2 and 55.9, respectively).<br />
The ratio of the sub-indices for new orders and stocks of<br />
finished goods, historically a good leading indicator of the<br />
future direction of the manufacturing PMI, is consistent with<br />
a further moderation in activity going forward (see chart).<br />
External economic conditions remain supportive of activity<br />
in the sector but developments within the eurozone are not<br />
so favourable. Domestic demand is already weak and will<br />
be undermined further by fiscal policy tightening.<br />
In line with the relative weakness of domestic demand, the<br />
PMI for the service sector has been less elevated than its<br />
manufacturing sibling. The services PMI weakened in June<br />
and, with the new business and future expectations indices<br />
both falling sharply, we look for a further fall in July.<br />
The employment indices of the manufacturing and services<br />
PMIs are barely above the 50 expansion level, indicative of<br />
high unemployment continuing. This in turn bears down on<br />
labour costs, keeping output price indices low.<br />
<strong>Market</strong> <strong>Economics</strong> 166 July 2010<br />
<strong>Market</strong> Mover<br />
59<br />
www.Global<strong>Market</strong>s.bnpparibas.com


