

Market Economics | Interest Rate Strategy - BNP PARIBAS ...
Market Economics | Interest Rate Strategy - BNP PARIBAS ...
Market Economics | Interest Rate Strategy - BNP PARIBAS ...

Create successful ePaper yourself
Turn your PDF publications into a flip-book with our unique Google optimized e-Paper software.
averaging introduces sizable upside bias (0.5%)<br />
relative to the ‘geometric’ CPI. Over 10 years, we find<br />
the RPI/CPI spread averages 71bp vs. 54bp over the<br />
past 20 years but is very sensitive to the start<br />
date/period. Assuming CPI is 0.75% below RPI (on<br />
average) and all private sector pension funds switch<br />
to CPI (unlikely) – we see a maximum impact on the<br />
net funding position in the region of £70bn (which<br />
would be similar to the benefit from PPF’s actuarial<br />
changes in Oct-09). With many private pension funds<br />
unlikely to be included in CPI indexation bracket, at<br />
least in the current state of legislation, the use of<br />
AER (instead of SVR) in MIPS and the encapsulation<br />
of housing related prices eventually in CPI suggest<br />
the gap could be lower over time (subject to a likely<br />
lower bound of 0.50% from formula effect). We<br />
expect the realised impact on aggregate PFs’ net<br />
asset/liability to be closer to half this amount (around<br />
£30-40bn). However, optionality in indexation of<br />
pensions (caps and floors) and maximum of (CPI,<br />
RPI and cap) in cases where the Trust Deed<br />
specifies RPI but is subject to the statutory minimum<br />
requirement (CPI), complicates the issue and under<br />
certain assumptions could even increase pension<br />
fund liabilities (according to Redington).<br />
<strong>Market</strong> downplays Risk of Switch to CPI<br />
Understandably, the announcement from Steve<br />
Webb triggered a correction in (long-end)<br />
breakevens. Uncertainty over the impact on private<br />
sector PFs could cause LDI programmes to be<br />
scaled back or placed on hold, weighing further on<br />
breakevens (and liquidity) near-term as sovereign<br />
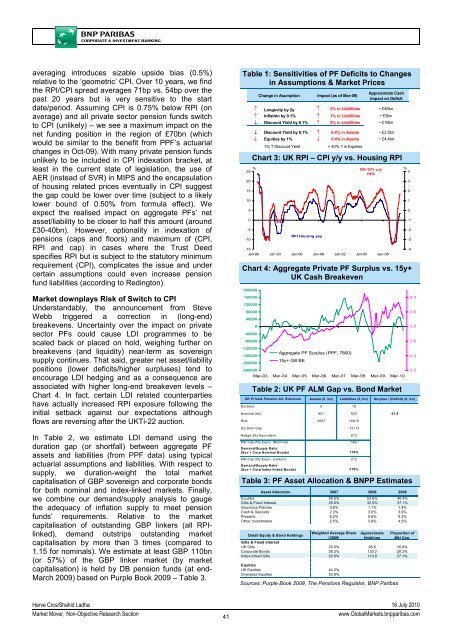
supply continues. That said, greater net asset/liability<br />
positions (lower deficits/higher surpluses) tend to<br />
encourage LDI hedging and as a consequence are<br />
associated with higher long-end breakeven levels –<br />
Chart 4. In fact, certain LDI related counterparties<br />
have actually increased RPI exposure following the<br />
initial setback against our expectations although<br />
flows are reversing after the UKTi-22 auction.<br />
In Table 2, we estimate LDI demand using the<br />
duration gap (or shortfall) between aggregate PF<br />
assets and liabilities (from PPF data) using typical<br />
actuarial assumptions and liabilities. With respect to<br />
supply, we duration-weight the total market<br />
capitalisation of GBP sovereign and corporate bonds<br />
for both nominal and index-linked markets. Finally,<br />
we combine our demand/supply analysis to gauge<br />
the adequacy of inflation supply to meet pension<br />
funds’ requirements. Relative to the market<br />
capitalisation of outstanding GBP linkers (all RPIlinked),<br />
demand outstrips outstanding market<br />
capitalisation by more than 3 times (compared to<br />
1.15 for nominals). We estimate at least GBP 110bn<br />
(or 57%) of the GBP linker market (by market<br />
capitalisation) is held by DB pension funds (at end-<br />
March 2009) based on Purple Book 2009 – Table 3.<br />
Table 1: Sensitivities of PF Deficits to Changes<br />
in Assumptions & <strong>Market</strong> Prices<br />
20<br />
15<br />
10<br />
5<br />
0<br />
-5<br />
-10<br />
Change in Asumption<br />
Impact (as of Mar-09)<br />
Approximate Cash<br />
Impact on Deficit<br />
↑ Longevity by 2y ↑ 5% in Liabilities ~ £45bn<br />
↑ Inflation by 0.1% ↑ 1% in Liabilities ~ £9bn<br />
↓ Discount Yield by 0.1% ↑ 2% in Liabilities ~ £18bn<br />
↓ Discount Yield by 0.1% ↑ 0.4% in Assets ~ £3.5bn<br />
↓ Equities by 1% ↓ 0.4% in Assets ~ £4.4bn<br />
1% ? Discount Yield = 40% ? in Equities<br />
Chart 3: UK RPI – CPI y/y vs. Housing RPI<br />
% RPI-CPI yoy<br />
%<br />
25<br />
4<br />
RHS<br />
RPI Housing yoy<br />
-15<br />
Jan-90 Jan-93 Jan-96 Jan-99 Jan-02 Jan-05 Jan-08<br />
Chart 4: Aggregate Private PF Surplus vs. 15y+<br />
UK Cash Breakeven<br />
200000<br />
160000<br />
120000<br />
80000<br />
40000<br />
0<br />
-40000<br />
-80000<br />
-120000<br />
-160000<br />
-200000<br />
Aggregate PF Surplus (PPF, 7800)<br />
15y+ Gilt BE<br />
-240000<br />
Mar-03 Mar-04 Mar-05 Mar-06 Mar-07 Mar-08 Mar-09 Mar-10<br />
Table 2: UK PF ALM Gap vs. Bond <strong>Market</strong><br />
UK Private Pension A/L Structure<br />
Assets (£, bn) Liabilities (£, bn) Surplus / (Deficit) (£, bn)<br />
Duration 5 18<br />
Nominal (bn) 901 923 -21.8<br />
Risk 4507 16619<br />
Duration Gap -12112<br />
Hedge 20y Equivalent 673<br />
Mkt Cap 20y Equiv. (Nominal)<br />
Demand/Supply Ratio<br />
582<br />
(Sov + Corp Nominal Bonds)<br />
116%<br />
Mkt Cap 20y Equiv. (Linkers)<br />
Demand/Supply Ratio<br />
212<br />
(Sov + Corp Index-linked Bonds)<br />
318%<br />
Table 3: PF Asset Allocation & <strong>BNP</strong>P Estimates<br />
Asset Allocation 2007 2008 2009<br />
Equities 59.5% 53.6% 46.4%<br />
Gilts & Fixed <strong>Interest</strong> 29.6% 32.9% 37.1%<br />
Insurance Policies 0.8% 1.1% 1.4%<br />
Cash & Deposits 2.3% 3.0% 3.9%<br />
Property 5.2% 5.6% 5.2%<br />
Other Investments 2.5% 3.8% 4.5%<br />
Detail Equity & Bond Holdings<br />
Weighted Average Share<br />
(2009)<br />
Approximate<br />
Holdings<br />
3<br />
2<br />
1<br />
0<br />
-1<br />
-2<br />
-3<br />
-4<br />
4.0<br />
3.6<br />
3.2<br />
2.8<br />
2.4<br />
2.0<br />
Proportion of<br />
Mkt Cap.<br />
Gilts & Fixed <strong>Interest</strong><br />
UK Gilts 29.0% 98.6 16.8%<br />
Corporate Bonds 38.3% 130.2 28.2%<br />
Index-linked Gilts 32.6% 110.8 57.1%<br />
Equities<br />
UK Equities 44.2%<br />
Overseas Equities 53.8%<br />
Sources: Purple Book 2009, The Pensions Regulator, <strong>BNP</strong> Paribas<br />
Herve Cros/Shahid Ladha 16 July 2010<br />
<strong>Market</strong> Mover, Non-Objective Research Section<br />
41<br />
www.Global<strong>Market</strong>s.bnpparibas.com


