

Market Economics | Interest Rate Strategy - BNP PARIBAS ...
Market Economics | Interest Rate Strategy - BNP PARIBAS ...
Market Economics | Interest Rate Strategy - BNP PARIBAS ...

You also want an ePaper? Increase the reach of your titles
YUMPU automatically turns print PDFs into web optimized ePapers that Google loves.
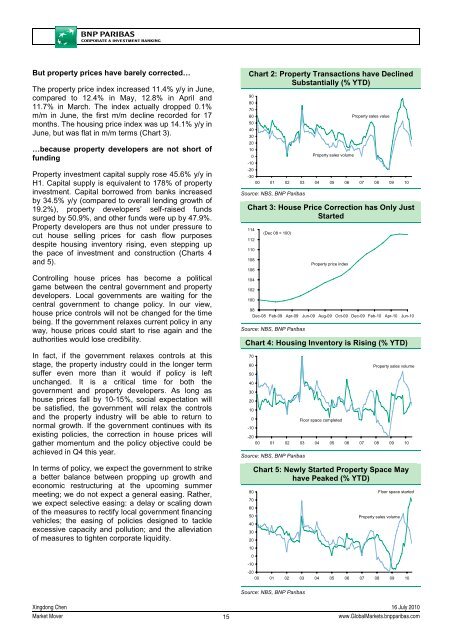
But property prices have barely corrected…<br />
The property price index increased 11.4% y/y in June,<br />
compared to 12.4% in May, 12.8% in April and<br />
11.7% in March. The index actually dropped 0.1%<br />
m/m in June, the first m/m decline recorded for 17<br />
months. The housing price index was up 14.1% y/y in<br />
June, but was flat in m/m terms (Chart 3).<br />
…because property developers are not short of<br />
funding<br />
Property investment capital supply rose 45.6% y/y in<br />
H1. Capital supply is equivalent to 178% of property<br />
investment. Capital borrowed from banks increased<br />
by 34.5% y/y (compared to overall lending growth of<br />
19.2%), property developers’ self-raised funds<br />
surged by 50.9%, and other funds were up by 47.9%.<br />
Property developers are thus not under pressure to<br />
cut house selling prices for cash flow purposes<br />
despite housing inventory rising, even stepping up<br />
the pace of investment and construction (Charts 4<br />
and 5).<br />
Controlling house prices has become a political<br />
game between the central government and property<br />
developers. Local governments are waiting for the<br />
central government to change policy. In our view,<br />
house price controls will not be changed for the time<br />
being. If the government relaxes current policy in any<br />
way, house prices could start to rise again and the<br />
authorities would lose credibility.<br />
In fact, if the government relaxes controls at this<br />
stage, the property industry could in the longer term<br />
suffer even more than it would if policy is left<br />
unchanged. It is a critical time for both the<br />
government and property developers. As long as<br />
house prices fall by 10-15%, social expectation will<br />
be satisfied, the government will relax the controls<br />
and the property industry will be able to return to<br />
normal growth. If the government continues with its<br />
existing policies, the correction in house prices will<br />
gather momentum and the policy objective could be<br />
achieved in Q4 this year.<br />
In terms of policy, we expect the government to strike<br />
a better balance between propping up growth and<br />
economic restructuring at the upcoming summer<br />
meeting; we do not expect a general easing. Rather,<br />
we expect selective easing: a delay or scaling down<br />
of the measures to rectify local government financing<br />
vehicles; the easing of policies designed to tackle<br />
excessive capacity and pollution; and the alleviation<br />
of measures to tighten corporate liquidity.<br />
Chart 2: Property Transactions have Declined<br />
Substantially (% YTD)<br />
90<br />
80<br />
70<br />
60<br />
Property sales value<br />
50<br />
40<br />
30<br />
20<br />
10<br />
0<br />
Property sales volume<br />
-10<br />
-20<br />
-30<br />
00 01 02 03 04 05 06 07 08 09 10<br />
Source: NBS, <strong>BNP</strong> Paribas<br />
Chart 3: House Price Correction has Only Just<br />
Started<br />
114<br />
112<br />
110<br />
108<br />
106<br />
104<br />
102<br />
100<br />
(Dec 08 = 100)<br />
Property price index<br />
98<br />
Dec-08 Feb-09 Apr-09 Jun-09 Aug-09 Oct-09 Dec-09 Feb-10 Apr-10 Jun-10<br />
Source: NBS, <strong>BNP</strong> Paribas<br />
Chart 4: Housing Inventory is Rising (% YTD)<br />
70<br />
60<br />
50<br />
40<br />
30<br />
20<br />
10<br />
0<br />
-10<br />
Floor space completed<br />
Property sales volume<br />
-20<br />
00 01 02 03 04 05 06 07 08 09 10<br />
Source: NBS, <strong>BNP</strong> Paribas<br />
80<br />
70<br />
60<br />
50<br />
40<br />
30<br />
20<br />
Chart 5: Newly Started Property Space May<br />
have Peaked (% YTD)<br />
Floor space started<br />
Property sales volume<br />
10<br />
0<br />
-10<br />
-20<br />
00 01 02 03 04 05 06 07 08 09 10<br />
Source: NBS, <strong>BNP</strong> Paribas<br />
Xingdong Chen 16 July 2010<br />
<strong>Market</strong> Mover<br />
15<br />
www.Global<strong>Market</strong>s.bnpparibas.com


