

Market Economics | Interest Rate Strategy - BNP PARIBAS ...
Market Economics | Interest Rate Strategy - BNP PARIBAS ...
Market Economics | Interest Rate Strategy - BNP PARIBAS ...

Create successful ePaper yourself
Turn your PDF publications into a flip-book with our unique Google optimized e-Paper software.
term structure models mentioned below that 30-year<br />
spread dynamics have been incorporated with some<br />
success into the standard framework.<br />
One of the drawbacks to linear regression models is<br />
that they can’t capture any tendency for the influence<br />
of the factors to vary over time or operate across<br />
different horizons. For example, the effect of corporate<br />
issuance on swap spreads acts as a rather short-term<br />
effect – e.g. the swapping of a fixed rate issue to<br />
floating exerts tightening pressure on spreads on the<br />
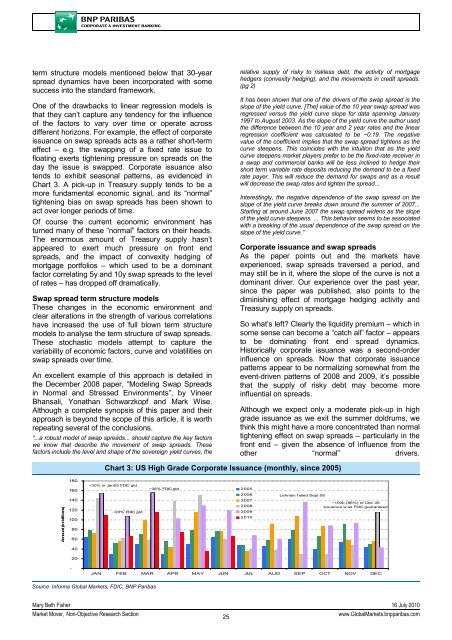
day the issue is swapped. Corporate issuance also<br />
tends to exhibit seasonal patterns, as evidenced in<br />
Chart 3. A pick-up in Treasury supply tends to be a<br />
more fundamental economic signal, and its “normal”<br />
tightening bias on swap spreads has been shown to<br />
act over longer periods of time.<br />
Of course the current economic environment has<br />
turned many of these “normal” factors on their heads.<br />
The enormous amount of Treasury supply hasn’t<br />
appeared to exert much pressure on front end<br />
spreads, and the impact of convexity hedging of<br />
mortgage portfolios – which used to be a dominant<br />
factor correlating 5y and 10y swap spreads to the level<br />
of rates – has dropped off dramatically.<br />
Swap spread term structure models<br />
These changes in the economic environment and<br />
clear alterations in the strength of various correlations<br />
have increased the use of full blown term structure<br />
models to analyse the term structure of swap spreads.<br />
These stochastic models attempt to capture the<br />
variability of economic factors, curve and volatilities on<br />
swap spreads over time.<br />
An excellent example of this approach is detailed in<br />
the December 2008 paper, “Modeling Swap Spreads<br />
in Normal and Stressed Environments”, by Vineer<br />
Bhansali, Yonathan Schwarzkopf and Mark Wise.<br />
Although a complete synopsis of this paper and their<br />
approach is beyond the scope of this article, it is worth<br />
repeating several of the conclusions.<br />
“...a robust model of swap spreads... should capture the key factors<br />
we know that describe the movement of swap spreads. These<br />
factors include the level and shape of the sovereign yield curves, the<br />
relative supply of risky to riskless debt, the activity of mortgage<br />
hedgers (convexity hedging), and the movements in credit spreads.<br />
(pg 2)<br />
It has been shown that one of the drivers of the swap spread is the<br />
slope of the yield curve. [The] value of the 10 year swap spread was<br />
regressed versus the yield curve slope for data spanning January<br />
1997 to August 2003. As the slope of the yield curve the author used<br />
the difference between the 10 year and 2 year rates and the linear<br />
regression coefficient was calculated to be −0.19. The negative<br />
value of the coefficient implies that the swap spread tightens as the<br />
curve steepens. This coincides with the intuition that as the yield<br />
curve steepens market players prefer to be the fixed-rate receiver in<br />
a swap and commercial banks will be less inclined to hedge their<br />
short term variable rate deposits reducing the demand to be a fixed<br />
rate payer. This will reduce the demand for swaps and as a result<br />
will decrease the swap rates and tighten the spread...<br />
<strong>Interest</strong>ingly, the negative dependence of the swap spread on the<br />
slope of the yield curve breaks down around the summer of 2007...<br />
Starting at around June 2007 the swap spread widens as the slope<br />
of the yield curve steepens. ... This behavior seems to be associated<br />
with a breaking of the usual dependence of the swap spread on the<br />
slope of the yield curve.”<br />
Corporate issuance and swap spreads<br />
As the paper points out and the markets have<br />
experienced, swap spreads traversed a period, and<br />
may still be in it, where the slope of the curve is not a<br />
dominant driver. Our experience over the past year,<br />
since the paper was published, also points to the<br />
diminishing effect of mortgage hedging activity and<br />
Treasury supply on spreads.<br />
So what’s left? Clearly the liquidity premium – which in<br />
some sense can become a “catch all” factor – appears<br />
to be dominating front end spread dynamics.<br />
Historically corporate issuance was a second-order<br />
influence on spreads. Now that corporate issuance<br />
patterns appear to be normalizing somewhat from the<br />
event-driven patterns of 2008 and 2009, it’s possible<br />
that the supply of risky debt may become more<br />
influential on spreads.<br />
Although we expect only a moderate pick-up in high<br />
grade issuance as we exit the summer doldrums, we<br />
think this might have a more concentrated than normal<br />
tightening effect on swap spreads – particularly in the<br />
front end – given the absence of influence from the<br />
other “normal” drivers.<br />
Chart 3: US High Grade Corporate Issuance (monthly, since 2005)<br />
Amount (in billions)<br />
180<br />
160<br />
140<br />
120<br />
100<br />
80<br />
60<br />
~30% in Jan09 FDIC gtd<br />
~20% FDIC gtd<br />
~36% FDIC gtd<br />
2005<br />
2006<br />
2007<br />
2008<br />
2009<br />
2010<br />
Lehman failed Sept 08<br />
~100b (86%) of Dec 08<br />
issuance w as FDIC guaranteed<br />
40<br />
20<br />
-<br />
JAN FEB MAR APR MAY JUN JUL AUG SEP OCT NOV DEC<br />
Source: Informa Global <strong>Market</strong>s, FDIC, <strong>BNP</strong> Paribas<br />
Mary Beth Fisher 16 July 2010<br />
<strong>Market</strong> Mover, Non-Objective Research Section<br />
25<br />
www.Global<strong>Market</strong>s.bnpparibas.com


